Py之pymc:pymc的简介、安装、使用方法之详细攻略
pymc的简介
PyMC(以前称为PyMC3)是一个专注于高级马尔科夫链蒙特卡洛(MCMC)和变分推断(VI)算法的Python包,用于贝叶斯统计建模。其灵活性和可扩展性使其适用于各种问题。PyMC是一个功能强大的贝叶斯建模工具,提供了丰富的特性和算法,适用于各种统计建模和推断任务。包括(广义)线性模型和层次线性模型案例研究、因果推断、诊断和模型评估、高斯过程、ODE模型推断、马尔科夫链蒙特卡洛方法、混合模型、生存分析、时间序列、变分推断。其特点如下:
直观的模型规范语法,例如,x ~ N(0,1) 可以翻译为 x = Normal('x',0,1)
强大的采样算法,例如 No U-Turn Sampler,可以处理具有成千上万个参数的复杂模型,>> 而无需特殊的拟合算法知识。
变分推断:提供快速近似后验估计的ADVI以及用于大型数据集的小批量ADVI。
依赖于PyTensor提供:
计算优化和动态的C或JAX编译
NumPy广播和高级索引
线性代数运算符
简单的可扩展性
透明支持缺失值填充
GitHub链接:GitHub - pymc-devs/pymc: Bayesian Modeling in Python
文档:Introductory Overview of PyMC — PyMC dev documentation
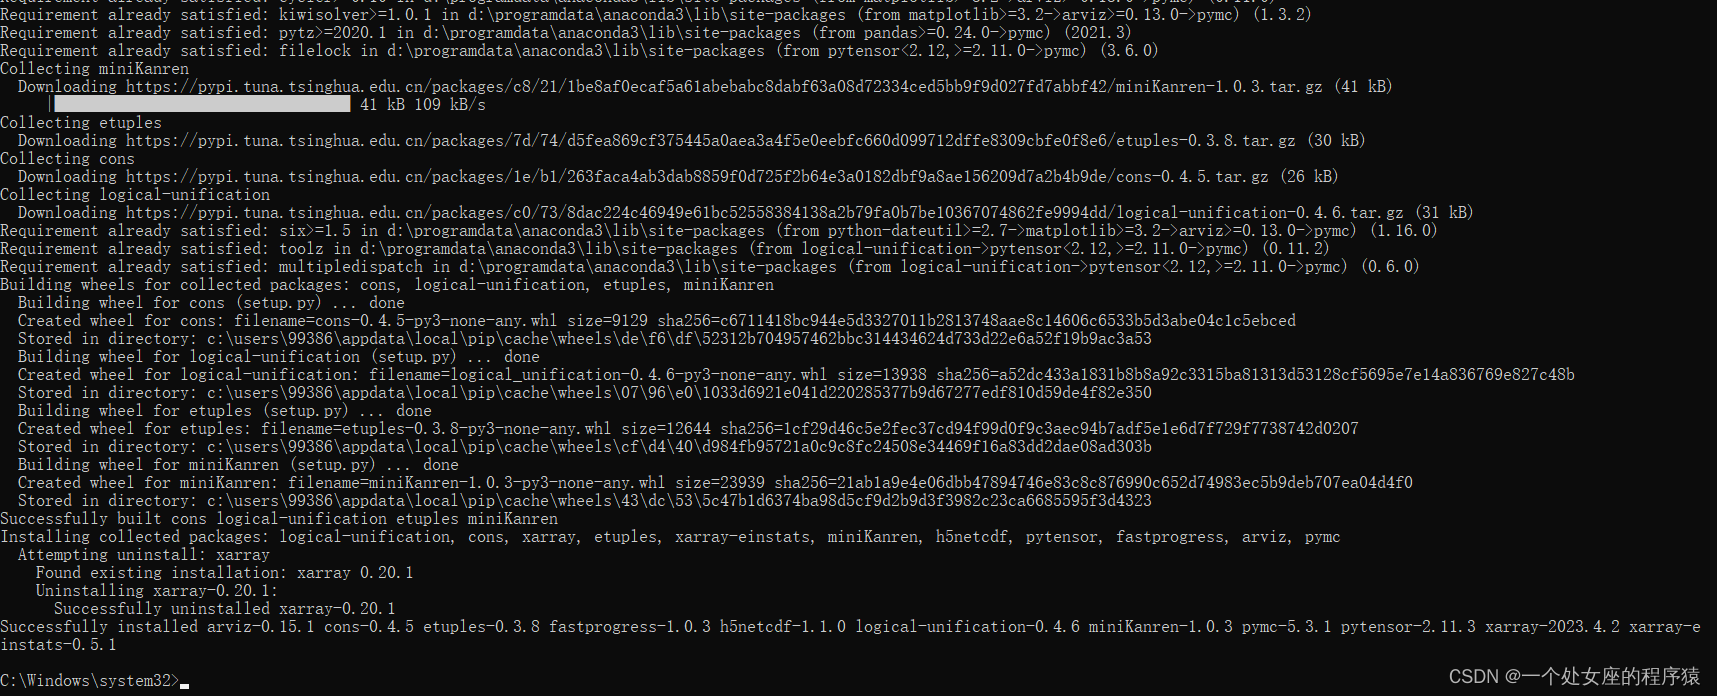
pymc的安装
pip install pymc

pip install -i https://pypi.tuna.tsinghua.edu.cn/simple pymc


pymc的使用方法
更多案例:PyMC Example Gallery — PyMC example gallery
1、时序性任务
(1)、使用 Euler-Maruyama 方案推断 SDE 的参数
%pylab inline
import arviz as az
import pymc as pm
import scipy
import theano.tensor as tt

from pymc.distributions.timeseries import EulerMaruyama

%config InlineBackend.figure_format = 'retina'
az.style.use("arviz-darkgrid")

# parameters
λ = -0.78
σ2 = 5e-3
N = 200
dt = 1e-1

# time series
x = 0.1
x_t = []

# simulate
for i in range(N):
    x += dt * λ * x + sqrt(dt) * σ2 * randn()
    x_t.append(x)

x_t = array(x_t)

# z_t noisy observation
z_t = x_t + randn(x_t.size) * 5e-3

figure(figsize=(10, 3))
subplot(121)
plot(x_t[:30], "k", label="$x(t)$", alpha=0.5), plot(z_t[:30], "r", label="$z(t)$", alpha=0.5)
title("Transient"), legend()
subplot(122)
plot(x_t[30:], "k", label="$x(t)$", alpha=0.5), plot(z_t[30:], "r", label="$z(t)$", alpha=0.5)
title("All time")
tight_layout()

def lin_sde(x, lam):
    return lam * x, σ2
with pm.Model() as model:

    # uniform prior, but we know it must be negative
    lam = pm.Flat("lam")

    # "hidden states" following a linear SDE distribution
    # parametrized by time step (det. variable) and lam (random variable)
    xh = EulerMaruyama("xh", dt, lin_sde, (lam,), shape=N, testval=x_t)

    # predicted observation
    zh = pm.Normal("zh", mu=xh, sigma=5e-3, observed=z_t)

with model:
    trace = pm.sample(2000, tune=1000)

figure(figsize=(10, 3))
subplot(121)
plot(percentile(trace[xh], [2.5, 97.5], axis=0).T, "k", label=r"$\hat{x}_{95\%}(t)$")
plot(x_t, "r", label="$x(t)$")
legend()

subplot(122)
hist(trace[lam], 30, label=r"$\hat{\lambda}$", alpha=0.5)
axvline(λ, color="r", label=r"$\lambda$", alpha=0.5)
legend();

# generate trace from posterior
ppc_trace = pm.sample_posterior_predictive(trace, model=model)

# plot with data
figure(figsize=(10, 3))
plot(percentile(ppc_trace["zh"], [2.5, 97.5], axis=0).T, "k", label=r"$z_{95\% PP}(t)$")
plot(z_t, "r", label="$z(t)$")
legend()
版权归原作者 一个处女座的程序猿 所有, 如有侵权,请联系我们删除。