首先以支持向量机模型为例
先导入需要使用的包,我们将使用roc_curve这个函数绘制ROC曲线!
from sklearn.svm import SVC
from sklearn.metrics import roc_curve
from sklearn.datasets import make_blobs
from sklearn. model_selection import train_test_split
import matplotlib.pyplot as plt
%matplotlib inline
然后使用下面make_blobs函数,生成一个二分类的数据不平衡数据集;
使用train_test_split函数划分训练集和测试集数据;
训练SVC模型。
X,y = make_blobs(n_samples=(4000,500), cluster_std=[7,2], random_state=0)

X_train,X_test,y_train, y_test = train_test_split(X,y,random_state=0)

clf = SVC(gamma=0.05).fit(X_train, y_train)

fpr,tpr, thresholds = roc_curve(y_test,clf.decision_function(X_test))

plt.plot(fpr,tpr,label='ROC')

plt.xlabel('FPR')
plt.ylabel('TPR')
从上面的代码可以看到,我们使用roc_curve函数生成三个变量,分别是fpr,tpr, thresholds,也就是假正例率(FPR)、真正例率(TPR)和阈值。
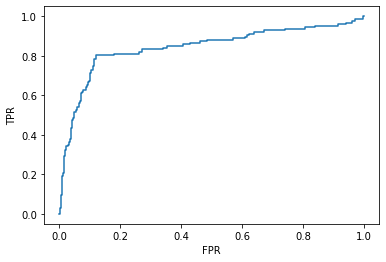
而其中的fpr,tpr正是我们绘制ROC曲线的横纵坐标,于是我们以变量fpr为横坐标,tpr为纵坐标,绘制相应的ROC图像如下:


值得注意的是上面的支持向量机模型使用的decision_function函数,是自己所特有的,而其他模型不能直接使用。

比如说我们想要使用其他模型(例如决策树模型)的结果绘制ROC,直接套用上面的代码,会报错,会显示没有这个函数。

以决策树模型为例,解决上述问题(适用于除向量机外的模型)
导入决策树模型包以及训练模型的代码省略了,只需要手动改一改就行了,我们直接看绘图的代码!
fpr,tpr, thresholds = roc_curve(y_test,clf.predict_proba(X_test)[:,1])

plt.plot(fpr,tpr,label='ROC')

plt.xlabel('FPR')
plt.ylabel('TPR')
可以看到我们直接把只适用于支持向量机模型的函数decision_function更改成predict_proba(X_test)[:,1]就行了,让我们看看结果:

可以看到哈,决策树模型在这个数据集上的泛化能力不如支持向量机哈!!!学废了吗。
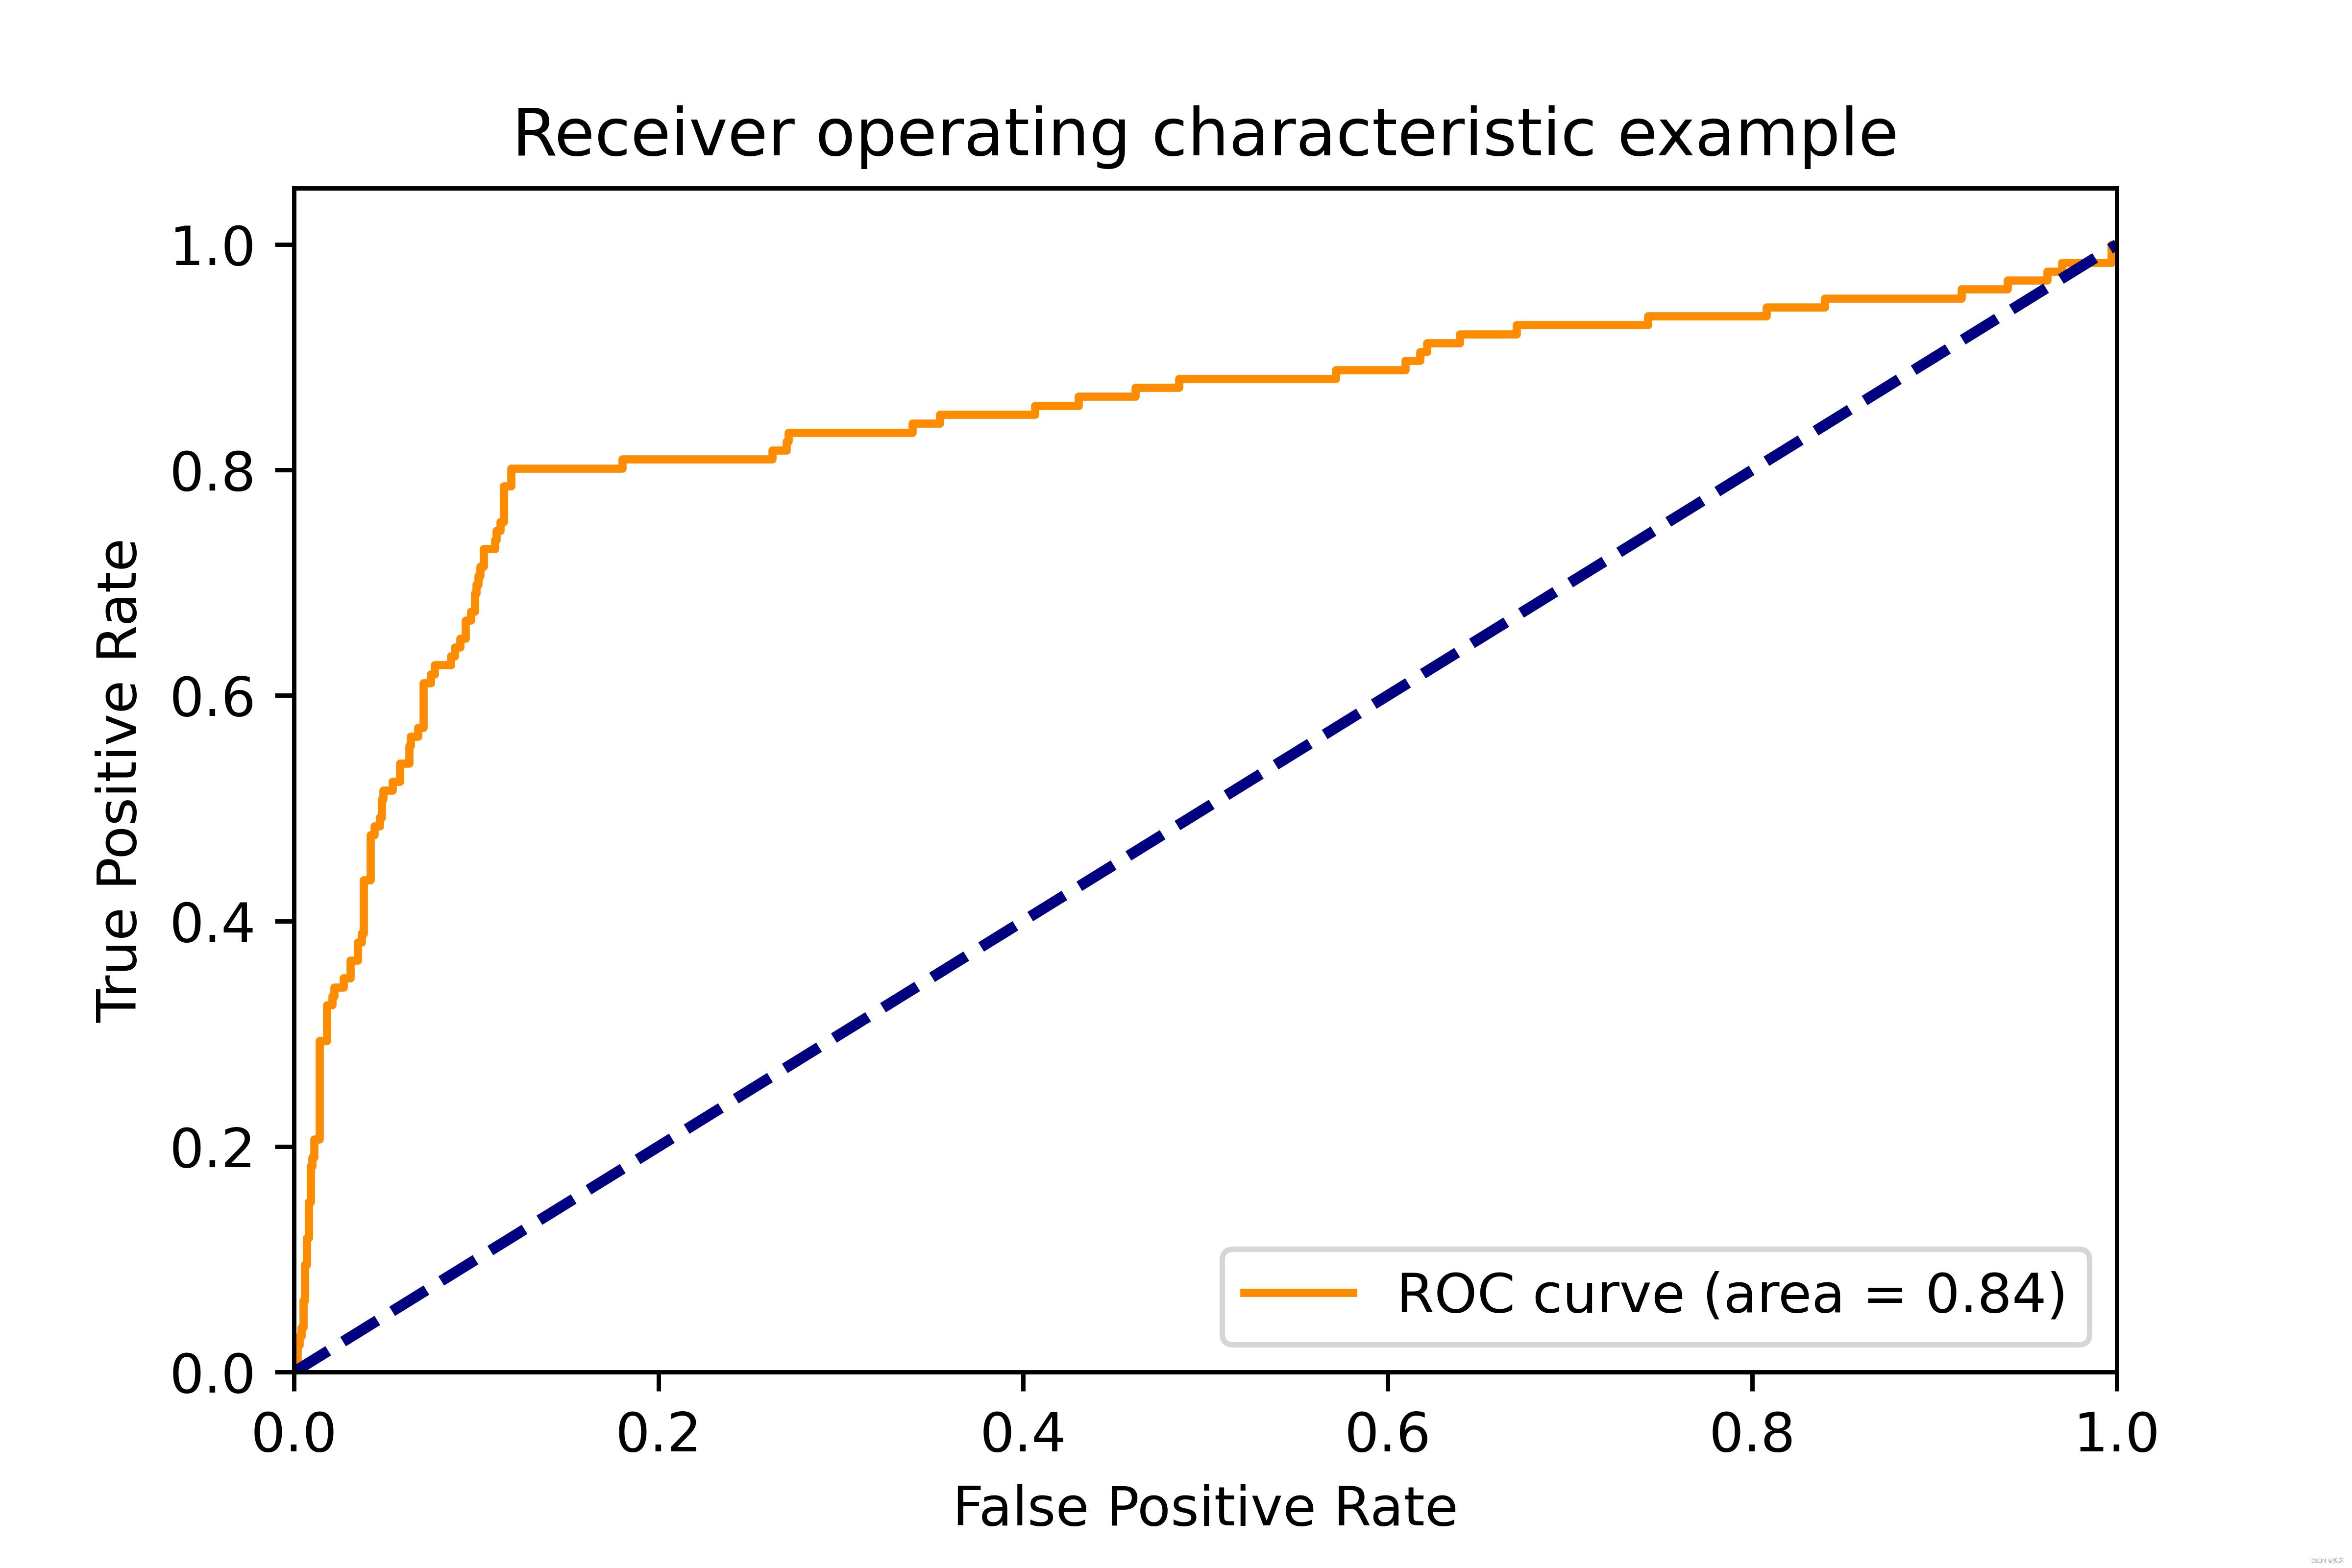
更好看的画法
auc = roc_auc_score(y_test,clf.predict_proba(X_test)[:,1])
# auc = roc_auc_score(y_test,clf.decision_function(X_test))
fpr,tpr, thresholds = roc_curve(y_test,clf.decision_function(X_test))
plt.plot(fpr,tpr,color='darkorange',label='ROC curve (area = %0.2f)' % auc)
plt.plot([0, 1], [0, 1], color='navy', lw=2, linestyle='--')
plt.xlim([0.0, 1.0])
plt.ylim([0.0, 1.05])
plt.xlabel('False Positive Rate')
plt.ylabel('True Positive Rate')
plt.title('Receiver operating characteristic example')
plt.legend(loc="lower right")
plt.savefig('suhan.jpg',dpi=800)
plt.show()

版权归原作者 拟禾 所有, 如有侵权,请联系我们删除。