
这些推特是真的还是假的?


他们肯定是假的。在7月15日时,Twitter出现了一个大问题,大账户被黑客入侵,要求比特币捐款,并承诺将捐款金额翻倍。所以即使这些推特是真实的,它们也包含了虚假信息。
这不是第一次,也可能不是最后一次。但是,我们能阻止它吗?我们能阻止这种情况发生吗?
问题
问题不仅仅是黑客进入账户并发送虚假信息。这里更大的问题是我们所说的“假新闻”。假新闻是那些虚假的新闻故事:故事本身是捏造的,没有可证实的事实、来源或引用。
当有人(或机器人之类的东西)冒充某人或可靠来源虚假传播信息时,也可以被认为是假新闻。在大多数情况下,制造虚假信息的人都有一个目的,可以是政治上的、经济上的,或者是为了改变人们对某个话题的行为或想法。
现在有无数的假新闻来源,大部分来自编程的机器人,他们不知道疲倦(他们是机器呵呵),继续24/7传播假信息。
引言中的推文只是这个问题的基本例子,但过去5年里更严肃的研究表明,虚假信息的传播与选举、公众对不同话题的看法或感受之间存在很大的相关性。
这个问题是真实的,很难解决,因为机器人越来越好,在欺骗我们。我们需要更好的系统来帮助我们了解假新闻的模式,以改善我们的社交媒体、交流方式,甚至是防止世界的混乱。
目的
在这篇短文中,我将解释几种通过从不同文章中收集数据来检测假新闻的方法。但同样的技术可以应用于不同的场景。
我将解释用于加载、清理和分析数据的Python代码。然后我们会做一些机器学习模型来执行分类任务(假的或假的)
数据
数据来自Kaggle,你可以在这里下载:
https://www.kaggle.com/clmentbisaillon/fake-and-real-news-dataset
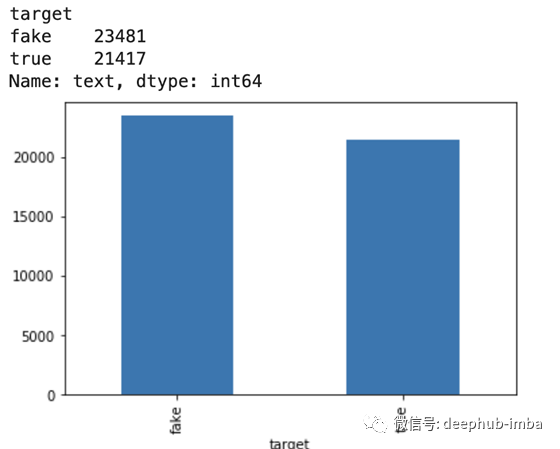
有两个文件,一个是真实新闻,一个是假新闻(都是英文),总共有23481条“假”推文和21417条“真实”文章。
所有的数据和代码可以在这个GitHub中找到:
https://github.com/FavioVazquez/fake-news
用Python解决问题
数据读取和拼接
首先,我们将数据加载到Python中:
 fake = pd.read_csv("data/Fake.csv")
 true = pd.read_csv("data/True.csv")
然后我们添加一个标志来跟踪真假:
 fake['target'] = 'fake'
 true['target'] = 'true'
现在进行数据的合并:
data = pd.concat([fake, true]).reset_index(drop = True)
我们将对数据进行洗牌以防止偏差:
 from sklearn.utils import shuffle
 data = shuffle(data)
 data = data.reset_index(drop=True)
进行数据清理
删除日期(我们不会将其用于分析):
data.drop(["date"],axis=1,inplace=True)
删除标题(我们只使用文本):
data.drop(["title"],axis=1,inplace=True)
转换文本为小写:
data['text'] = data['text'].apply(lambda x: x.lower())
删除标点符号:
 import stringdef punctuation_removal(text):
     all_list = [char for char in text if char not in string.punctuation]
     clean_str = ''.join(all_list)
     return clean_strdata['text'] = data['text'].apply(punctuation_removal)
删除停止词
 import nltk
 nltk.download('stopwords')
 from nltk.corpus import stopwords
 stop = stopwords.words('english')data['text'] = data['text'].apply(lambda x: ' '.join([word for word in x.split() if word not in (stop)]))
数据探索
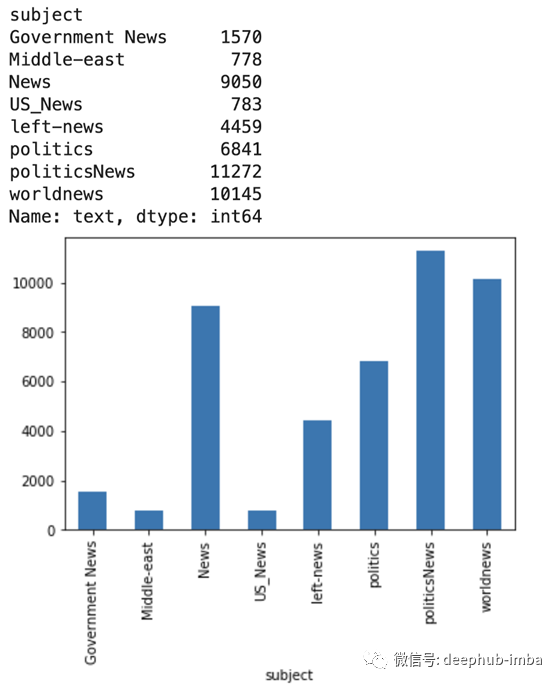
每个主题有多少篇文章?
 print(data.groupby(['subject'])['text'].count())
 data.groupby(['subject'])['text'].count().plot(kind="bar")
 plt.show()
有多少文章?
 print(data.groupby([‘target’])[‘text’].count())
 data.groupby([‘target’])[‘text’].count().plot(kind=”bar”)
 plt.show()
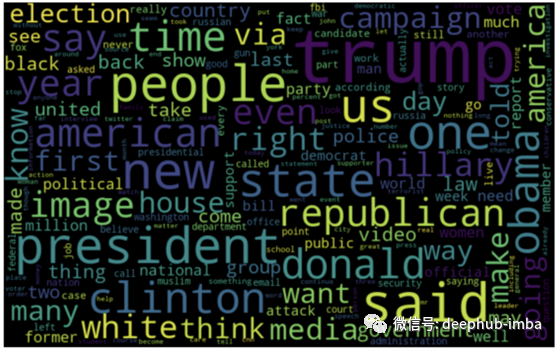
假新闻的词云:
 from wordcloud import WordCloudfake_data = data[data["target"] == "fake"]
 all_words = ' '.join([text for text in fake_data.text])wordcloud = WordCloud(width= 800, height= 500,
                           max_font_size = 110,
                           collocations = False).generate(all_words)plt.figure(figsize=(10,7))
 plt.imshow(wordcloud, interpolation='bilinear')
 plt.axis("off")
 plt.show()
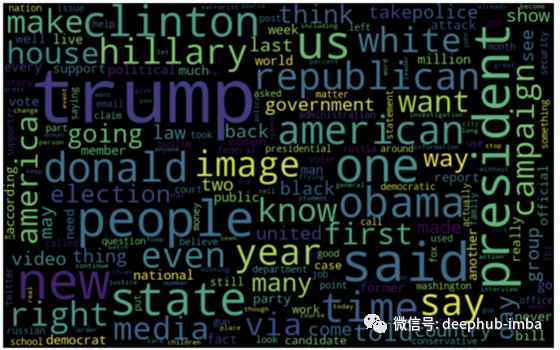
真新闻的词云:
 from wordcloud import WordCloudreal_data = data[data[“target”] == “true”]
 all_words = ‘ ‘.join([text for text in fake_data.text])wordcloud = WordCloud(width= 800, height= 500, max_font_size = 110,
  collocations = False).generate(all_words)plt.figure(figsize=(10,7))
 plt.imshow(wordcloud, interpolation=’bilinear’)
 plt.axis(“off”)
 plt.show()
词频统计:
 # Most frequent words counter (Code adapted from https://www.kaggle.com/rodolfoluna/fake-news-detector)
 from nltk import tokenizetoken_space = tokenize.WhitespaceTokenizer()def counter(text, column_text, quantity):
     all_words = ' '.join([text for text in text[column_text]])
     token_phrase = token_space.tokenize(all_words)
     frequency = nltk.FreqDist(token_phrase)
     df_frequency = pd.DataFrame({"Word": list(frequency.keys()),
                                    "Frequency": list(frequency.values())})
     df_frequency = df_frequency.nlargest(columns = "Frequency", n = quantity)
     plt.figure(figsize=(12,8))
     ax = sns.barplot(data = df_frequency, x = "Word", y = "Frequency", color = 'blue')
     ax.set(ylabel = "Count")
     plt.xticks(rotation='vertical')
     plt.show()
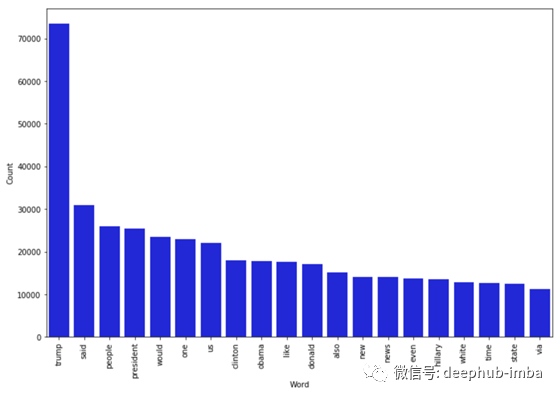
假新闻中出现频率最高的词汇:
counter(data[data[“target”] == “fake”], “text”, 20)
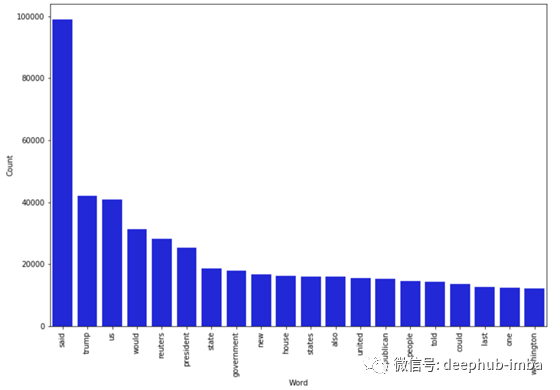
真新闻中出现频率最高的词汇:
counter(data[data[“target”] == “true”], “text”, 20)
建模
建模过程将包括对存储在“text”列中的语料库进行向量化,然后应用TF-IDF,最后使用分类机器学习算法。都是非常标准的文本分析和NLP操作。
对于建模,我们有这个函数来绘制模型的混淆矩阵:
 # Function to plot the confusion matrix (code from https://scikit-learn.org/stable/auto_examples/model_selection/plot_confusion_matrix.html)
 from sklearn import metrics
 import itertoolsdef plot_confusion_matrix(cm, classes,
                           normalize=False,
                           title='Confusion matrix',
                           cmap=plt.cm.Blues):

     plt.imshow(cm, interpolation='nearest', cmap=cmap)
     plt.title(title)
     plt.colorbar()
     tick_marks = np.arange(len(classes))
     plt.xticks(tick_marks, classes, rotation=45)
     plt.yticks(tick_marks, classes)if normalize:
         cm = cm.astype('float') / cm.sum(axis=1)[:, np.newaxis]
         print("Normalized confusion matrix")
     else:
         print('Confusion matrix, without normalization')thresh = cm.max() / 2.
     for i, j in itertools.product(range(cm.shape[0]), range(cm.shape[1])):
         plt.text(j, i, cm[i, j],
                  horizontalalignment="center",
                  color="white" if cm[i, j] > thresh else "black")plt.tight_layout()
     plt.ylabel('True label')
     plt.xlabel('Predicted label')
分割数据
X_train,X_test,y_train,y_test = train_test_split(data['text'], data.target, test_size=0.2, random_state=42)
逻辑回归
# Vectorizing and applying TF-IDF
from sklearn.linear_model import LogisticRegressionpipe = Pipeline([('vect', CountVectorizer()),
                 ('tfidf', TfidfTransformer()),
                 ('model', LogisticRegression())])# Fitting the model
model = pipe.fit(X_train, y_train)# Accuracy
prediction = model.predict(X_test)
print("accuracy: {}%".format(round(accuracy_score(y_test, prediction)*100,2)))
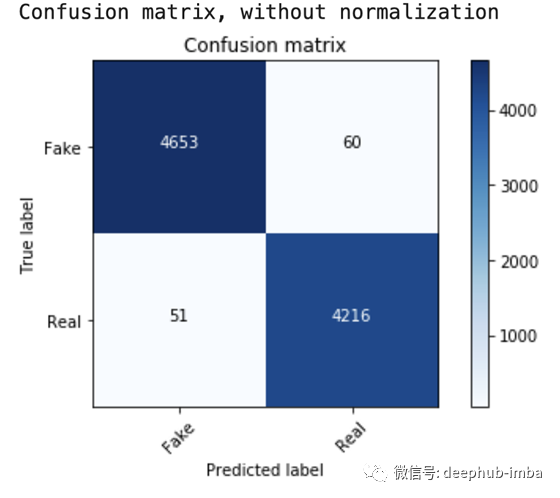
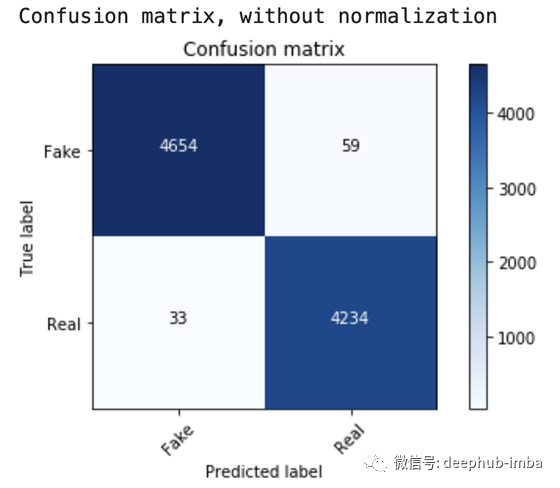
准确率是98.76%,混淆矩阵如下:
cm = metrics.confusion_matrix(y_test, prediction)
plot_confusion_matrix(cm, classes=['Fake', 'Real'])
决策树
 from sklearn.tree import DecisionTreeClassifier# Vectorizing and applying TF-IDF
 pipe = Pipeline([('vect', CountVectorizer()),
                  ('tfidf', TfidfTransformer()),
                  ('model', DecisionTreeClassifier(criterion= 'entropy',
                                            max_depth = 20,
                                            splitter='best',
                                            random_state=42))])
 # Fitting the model
 model = pipe.fit(X_train, y_train)# Accuracy
 prediction = model.predict(X_test)
 print("accuracy: {}%".format(round(accuracy_score(y_test, prediction)*100,2)))
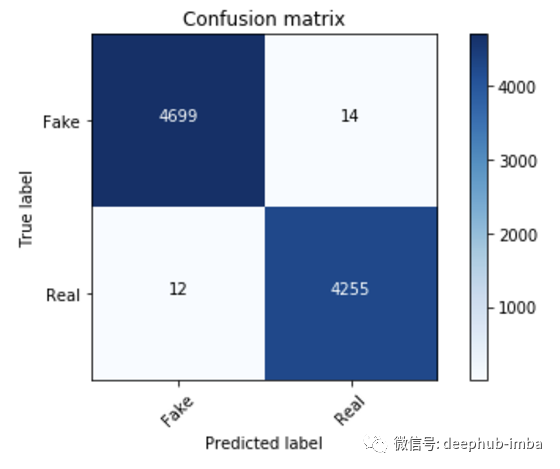
准确率是99.71 ,混淆矩阵如下:
 cm = metrics.confusion_matrix(y_test, prediction)
 plot_confusion_matrix(cm, classes=['Fake', 'Real'])
随机森林
 from sklearn.ensemble import RandomForestClassifierpipe = Pipeline([('vect', CountVectorizer()),
                  ('tfidf', TfidfTransformer()),
                  ('model', RandomForestClassifier(n_estimators=50, criterion="entropy"))])model = pipe.fit(X_train, y_train)
 prediction = model.predict(X_test)
 print("accuracy: {}%".format(round(accuracy_score(y_test, prediction)*100,2)))
准确率是98.98 % ,混淆矩阵如下:
 cm = metrics.confusion_matrix(y_test, prediction)
 plot_confusion_matrix(cm, classes=['Fake', 'Real'])
结论
文本分析和自然语言处理可以用来解决假新闻这一非常重要的问题。我们已经看到了它们对人们的观点、世界对一个话题的思考方式所产生的巨大影响。
我们已经建立了一个机器学习模型,使用样本数据来检测虚假文章,使用Python构建模型,并且比较不同分类模型的准确率。
感谢阅读这篇文章,希望它能对您当前的工作或对数据科学的调查和理解有所帮助。
作者:Favio Vázquez
deephub翻译组
DeepHub
微信号 : deephub-imba
每日大数据和人工智能的重磅干货
大厂职位内推信息
长按识别二维码关注 ->
喜欢就请三连暴击!********** **********