
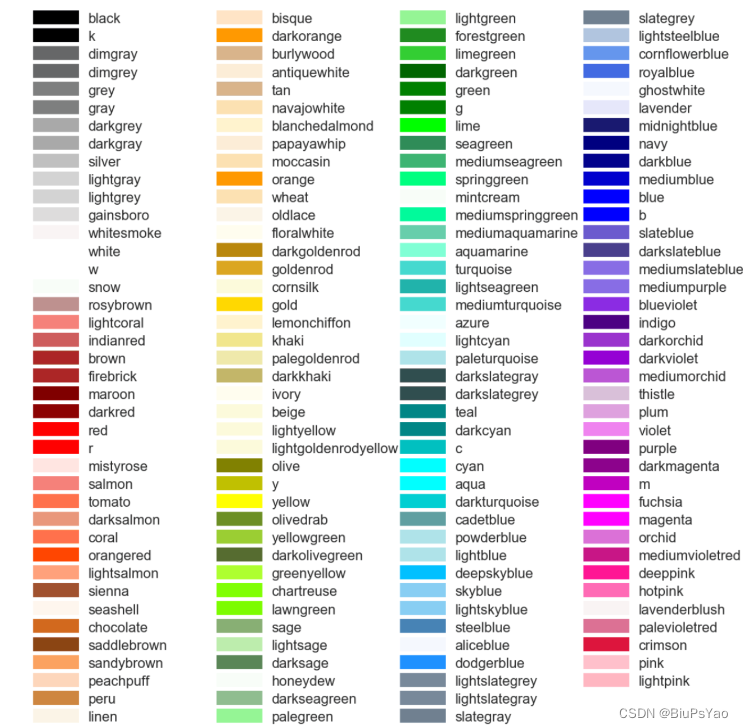
plt颜色大全
plt.plot()的使用,简单例子
X = np.linspace(1,20,10)#[1 3 5 7 9 11 13 15 17 19] [2 4 6 8 10 12 14 16 18 20]
Y = np.sin(X)
plt.plot(X, Y, color ="blue", linewidth=2, linestyle="-", label="LINE")
plt.legend(loc="upper right")
plt.show()
**
X: x轴的长度,
1-20取
10个点**
**Y: 对应
X中
10个点的数据**
**color: 颜色、
linewidth:线的粗细、
linestyle:样式、
label:这条线命名**
本文转载自: https://blog.csdn.net/qq_41138191/article/details/124805133
版权归原作者 BiuPsYao 所有, 如有侵权,请联系我们删除。
版权归原作者 BiuPsYao 所有, 如有侵权,请联系我们删除。