
目录
1. sns.set() 函数
seaborn.set(context=‘notebook’,
            style=‘darkgrid’,
            palette=‘deep’,
            font=‘sans-serif’,
            font_scale=1,
            color_codes=True,
            rc=None)
从这个set()函数,可以看出,通过它我们可以设置背景色、风格、字型、字体等。
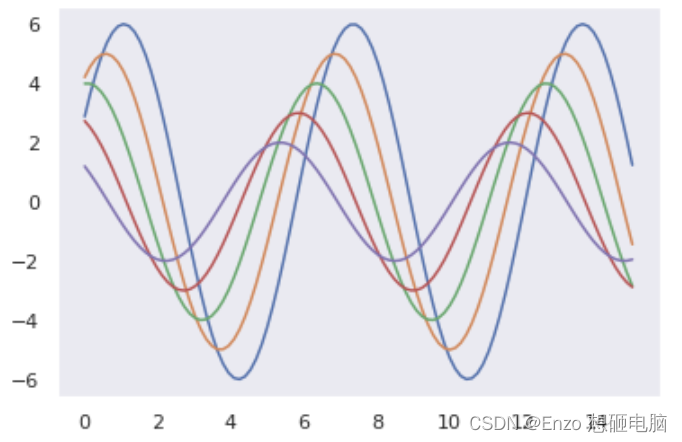
我们定义一个函数,这个函数主要是生成100个0到15的变量,然后用这个变量画出6条曲线。
defsinplot():
    x = np.linspace(0,15,100)for i inrange(1,6):
        plt.plot(x, np.sin(x + i *.5)*(7- i))
sns.set()
sinplot()
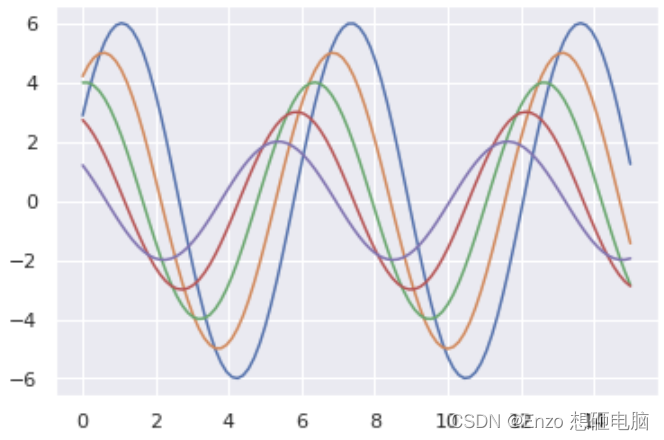
那么,问题来了,有人会说,这个set()函数这么多参数,只要改变其中任意一个参数的值,绘图效果就会发生变化,那我们怎么知道哪种搭配是最佳效果呢,难道我们要一个个去测试吗?
当然不是,seaborn提供了5种默认的风格,我们在实际绘图中只要选择一种喜欢的风格就可以了,下面我们就看看这5种风格的用法及效果。
2. 参数 style 指定的5种默认风格
函数参数:seaborn.set_style(style=None, rc=None),这里style可选参数值有:darkgrid,whitegrid,dark,white,ticks,下面我们就通过设置不同的风格,看看每种风格的效果。
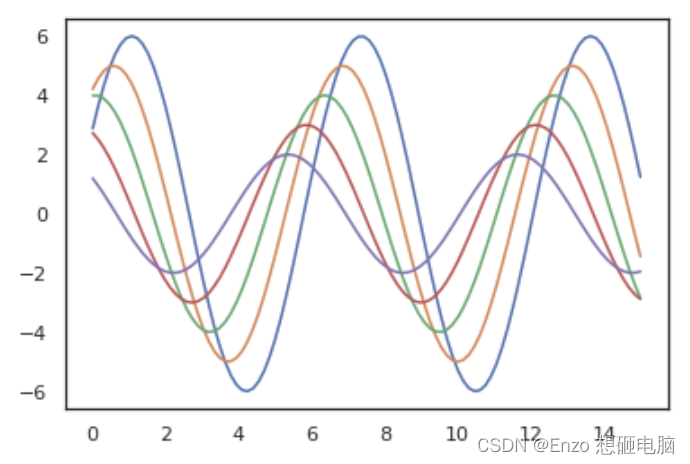
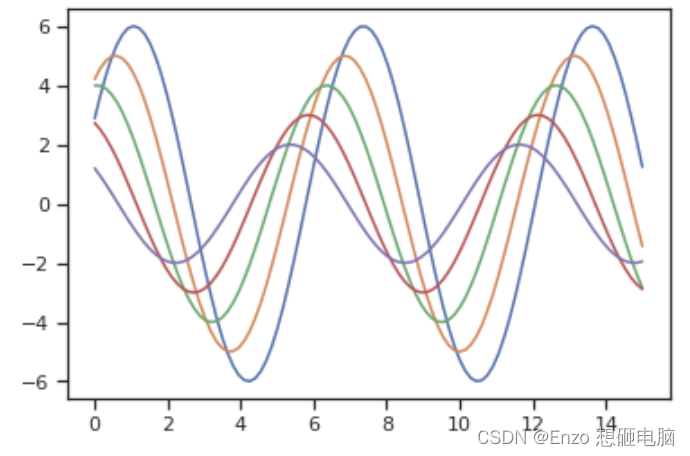
1) sns.set(style=‘white’)
sns.set(style='white')
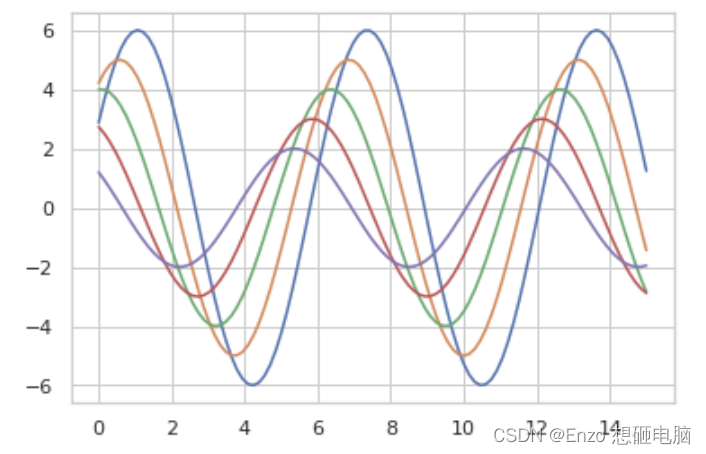
2) sns.set(style=‘whitegrid’)
sns.set(style='whitegrid')
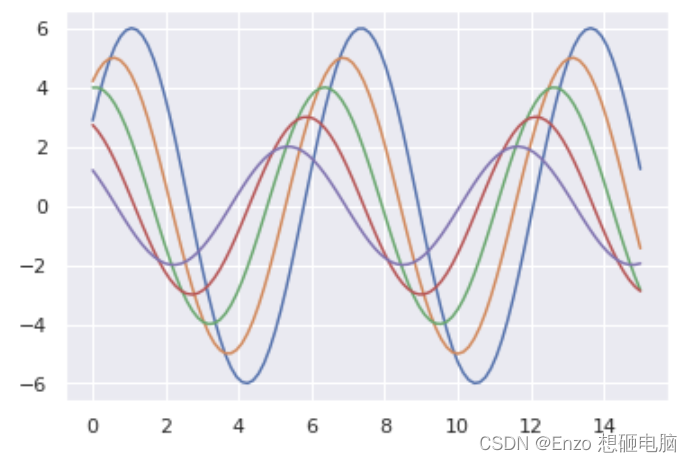
3) sns.set(style=‘darkgrid’)
sns.set(style='darkgrid')
4) sns.set(style=‘dark’)
sns.set(style='dark')
5) sns.set(style=‘ticks’)
sns.set(style='ticks')
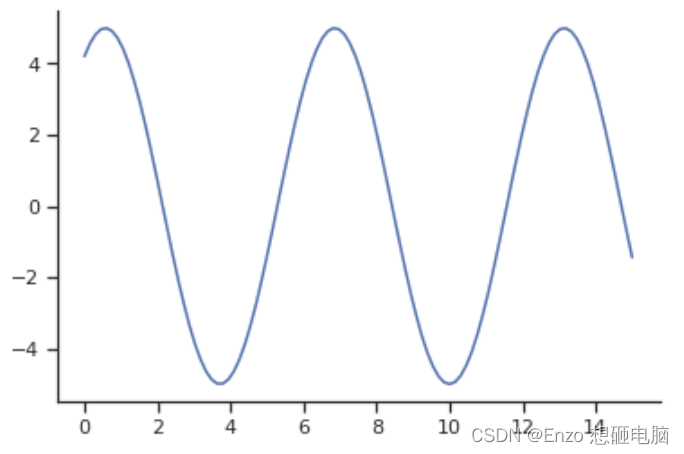
3. sns.despine() 函数,移除图像的上部和右侧的坐标轴
这个函数可以移除图像的上部和右侧的坐标轴,我们看看效果。
x = np.linspace(0,15,100)
y = np.sin(x +1)*5

sns.set(style='ticks')
plt.plot(x, y)
sns.despine()
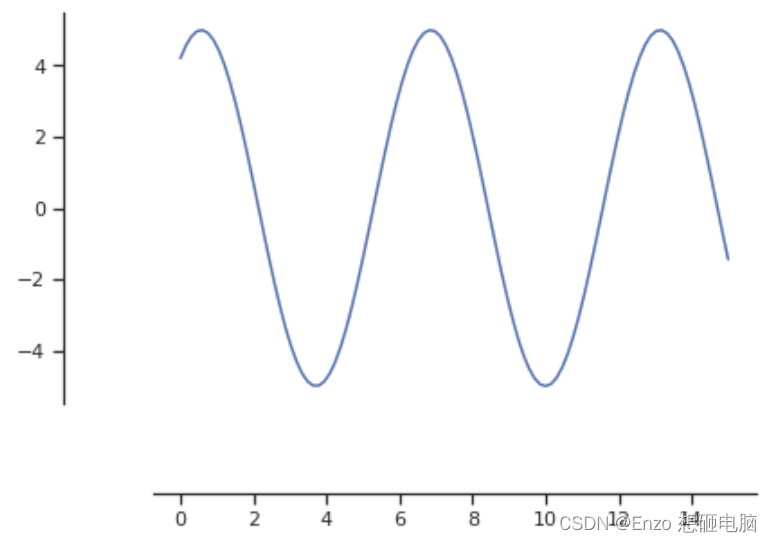
这里默认移除了上部和右侧的轴,当然我们也可以移除其他轴,只要将表示四个边的参数值改为true即可,下面是个这个函数的参数
seaborn.despine(fig=None, ax=None, top=True, right=True, left=False, bottom=False, offset=None, trim=False)
其中offset表示偏离左侧轴的距离。
x = np.linspace(0,15,100)
y = np.sin(x +1)*5

sns.set(style='ticks')
plt.plot(x, y)
sns.despine(top=True, right=True, left=False, bottom=False,offset=50)
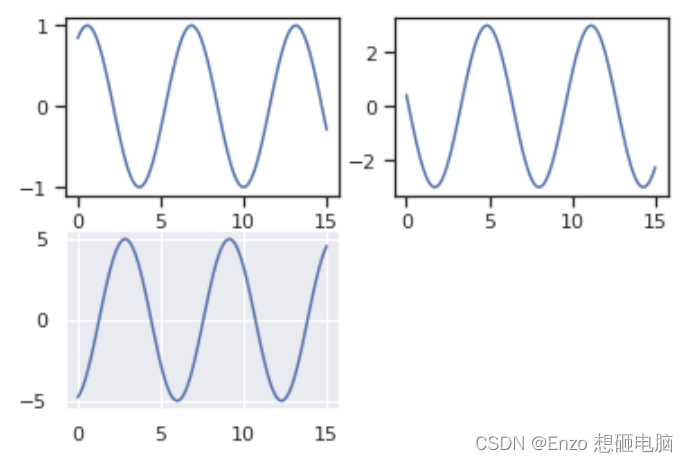
4. 使用with打开某种风格
在matplotlib中我们已经学过了,在一个figure对象中,我们可以添加多个子图,那么如果不同的子图使用不同的风格,我们该如何做呢?
很简单,使用with 打开某种风格,然后在with下画的图都使用with打开的分格,我们来看看代码。
x = np.linspace(0,15,100)
y1 = np.sin(x +1)*1
y2 = np.sin(x +3)*3
y3 = np.sin(x +5)*5

fig = plt.figure()with sns.axes_style("ticks"):
    ax1 = fig.add_subplot(221)
    plt.plot(x, y1)
    ax1 = fig.add_subplot(222)
    plt.plot(x, y2)

fig.add_subplot(223)
plt.plot(x, y3)
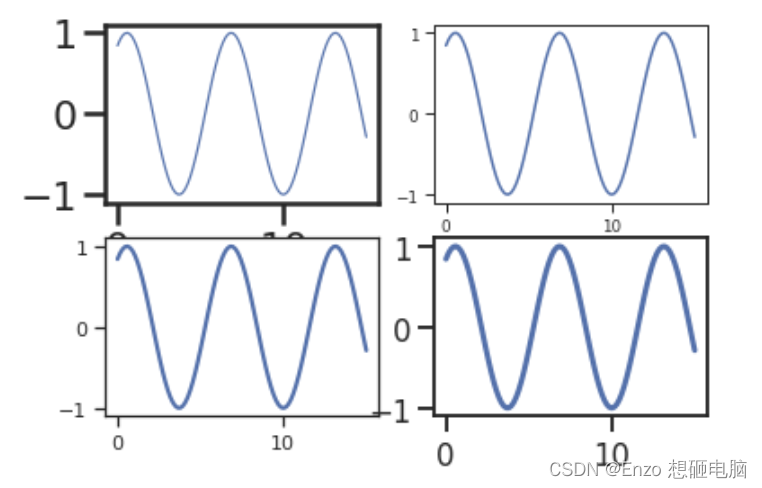
5. 参数 context 指定的4种默认风格
seaborn.set() 的 context 这个参数是用来设置 绘图背景参数的,它主要来影响标签、线条和其他元素的效果,但不会影响整体的风格,跟style有点区别。
当然,也可以使用函数
seaborn.set_context(context=None, font_scale=1, rc=None)
指定,效果一样
context 的可选值有: notebook(默认),paper, talk, poster
x = np.linspace(0,15,100)
y = np.sin(x +1)*1

fig = plt.figure()

fig.add_subplot(221)
sns.set(context='paper', style='ticks')
plt.plot(x, y)

fig.add_subplot(222)
sns.set(context='notebook', style='ticks')
plt.plot(x, y)

fig.add_subplot(223)
sns.set(context='talk', style='ticks')
plt.plot(x, y)

fig.add_subplot(224)
sns.set(context='poster', style='ticks')
plt.plot(x, y)
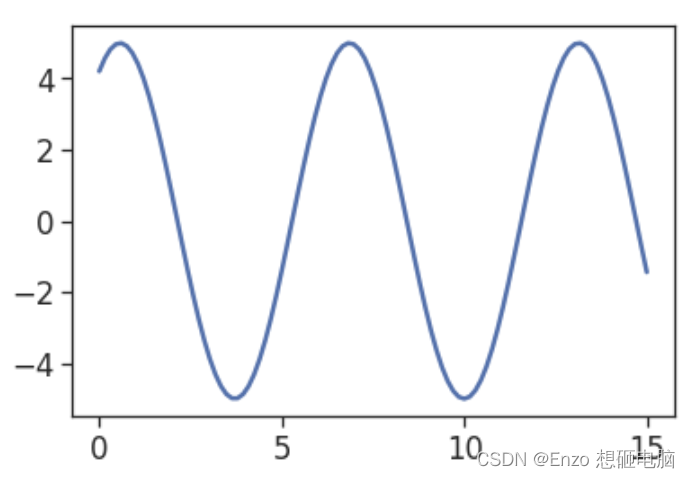
使用函数
seaborn.set_context(context=None, font_scale=1, rc=None)
x = np.linspace(0,15,100)
y = np.sin(x +1)*5

sns.set_context("notebook", font_scale=1.5, rc={"lines.linewidth":2.5})
plt.figure(figsize=(6,4))
plt.plot(x, y)
reference:
- 参考文章
本文转载自: https://blog.csdn.net/weixin_37804469/article/details/125704480
版权归原作者 Enzo 想砸电脑 所有, 如有侵权,请联系我们删除。
版权归原作者 Enzo 想砸电脑 所有, 如有侵权,请联系我们删除。