
在本文中,我们将讨论无监督机器学习中的层次聚类算法。该算法基于嵌套簇的拆分和合并。根据距离度量合并集群的链接标准如下所示,使用自底向上的方法。
ward linkage :它是用来最小化数据的差异与层次的方法(离差平方和法)。
Maximum linkage:用于最小化集群数据点的最大距离。
Average linkage:用于平均集群数据点的距离。
Single linkage:用于最小化集群中数据点的最近距离。
通过树状图可以看到分层聚类的可视化
关联标准以不同的时间速度提供不同的集群。Single linkage在有噪声的数据中表现不好,ward linkage由于距离不变而不能给出合适的聚类,但在适当平衡的聚类中很好,如果我们不考虑欧氏距离,则可以使用Average linkage进行聚类。
下一个参数是亲和性,它基于连接矩阵连接或合并集群。
亲和性参数用于计算集群中的链接。当我们使用ward linkage 时,我们只能使用欧几里得距离度量。
用python建模分层聚类
#importing the libraries
import numpy as np
import pandas as pd
import matplotlib.pyplot as plt
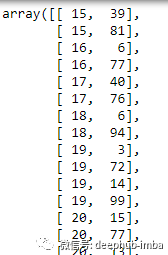
读取数据客户记录的数据集。
#importing the dataset
dataset = pd.read_csv('Mall_Customers.csv')
数据集如下。
第3和4列将用于聚类,即年度收入和支出得分。
x = dataset.iloc[:,[3,4]].values
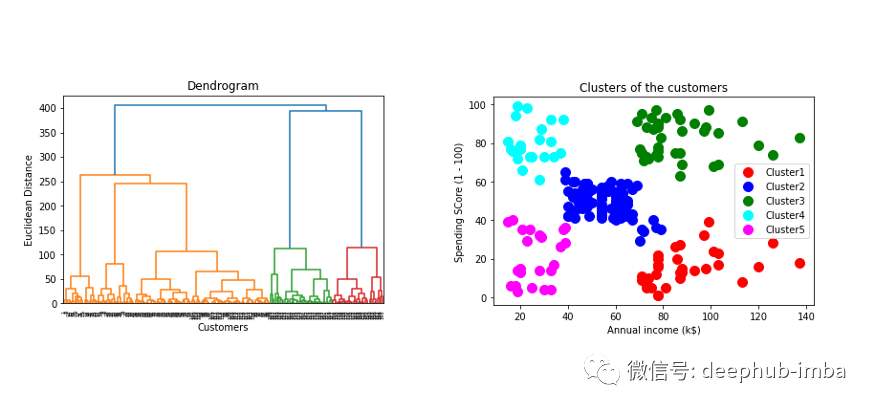
现在,我们将生成数据的树状图。
#using the dendrogram and determine the number of clusters
import scipy.cluster.hierarchy as sch
dendrogram = sch.dendrogram(sch.linkage(x, method = 'ward'))
plt.title('Dendrogram')
plt.xlabel('Customers')
plt.ylabel('Euclidean Distance')
plt.show()
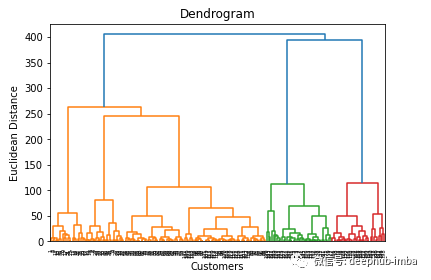
该树状图显示了基于欧氏距离的行数据点的层次聚类。它还能告诉树状图中不同颜色簇的合适数量。但是集群的最优选择可以基于树状图中的水平线,即集群数量为5。
#create the model to fit the hierarchical means clustering

from sklearn.cluster import AgglomerativeClustering
hc = AgglomerativeClustering(n_clusters = 5, affinity = "euclidean",
                             linkage = 'ward')

hc_pred = hc.fit_predict(x)
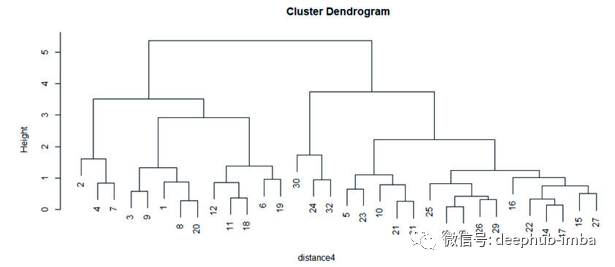
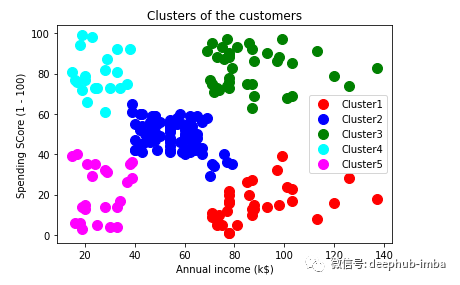
现在绘制数据点以可视化集群。
#visualizing the clusters
plt.scatter(x[hc_pred==0,0], x[hc_pred==0,1], s = 100, c = 'red',
                                              label ='Cluster1')
plt.scatter(x[hc_pred==1,0], x[hc_pred==1,1], s = 100, c = 'blue',
                                              label ='Cluster2')
plt.scatter(x[hc_pred==2,0], x[yhc_pred==2,1], s = 100, c = 'green',
                                            label = 'Cluster3')
plt.scatter(x[hc_pred==3,0], x[hc_pred==3,1], s = 100, c = 'cyan',
                                             label ='Cluster4')
plt.scatter(x[hc_pred==4,0], x[hc_pred==4,1], s = 100, c =
                                    'magenta',label = 'Cluster5')

plt.title('Clusters of the customers')
plt.xlabel('Annual income (k$)')
plt.ylabel('Spending SCore (1 - 100)')
plt.legend()

plt.show()
总结
该算法用于数据挖掘和统计,以形成相似的对象簇。有时由于时间复杂度O(n³)和需要更多内存,这种算法变得很慢。
作者:Amit Chauhan
原文地址:https://pub.towardsai.net/fully-explained-hierarchical-clustering-with-python-ebb256317b50
deephub翻译组