
介绍
每年,美国有超过 230,000 名乳腺癌患者的确诊取决于癌症是否已经转移。转移检测由病理学家检查大片生物组织进行。这个过程是劳动密集型的并且容易出错。
在今天这个项目中,我们的目标是实现论文《在Gigapixel病理图像上检测癌症转移》arxiv:1703.02442 中提出的多尺度转移分类模型。
数据集
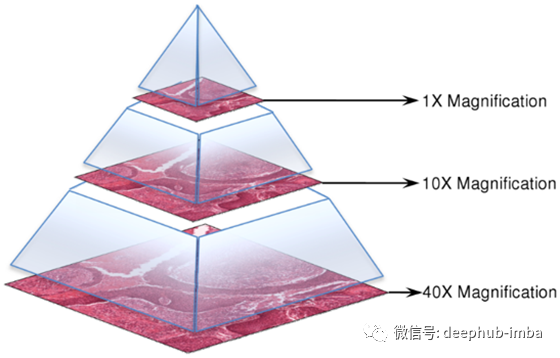
我们使用CAMELYON-16 Multi Giga Pixel数据。从主要数据集中取样了22张有显著肿瘤的胶片。每张胶片都有一个对应的掩码来标注肿瘤区域。我们可以达到9级放大倍数。
每一幅多尺度图像以一致的坐标系统叠放在另一幅图像上,以允许用户访问任意放大倍数的任意图像片段。
我们利用OpenSlide C库及其Python绑定来有效地访问十亿像素大小的压缩文件。
数据准备
作为生成标记训练数据的第一步,我们使用滑动窗口方法在更高的缩放级别上滑动,并创建片段的标记图像,稍后我们将使用这些图像进行训练和测试。
我们使用论文中遵循的方法,定义一个中心窗口,如果中心包含至少1个标记为肿瘤的像素,我们将图像标记为包含肿瘤细胞。
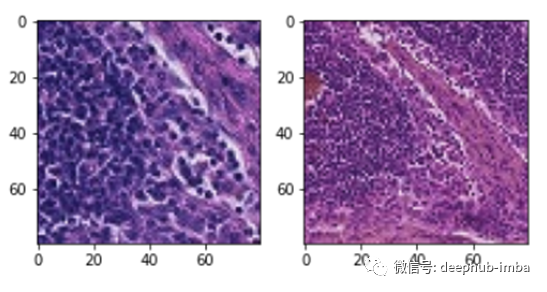
窗口大小和中心大小分别被选择为80和50。最后,为了使我们的训练数据具有多尺度,我们创建了原始图像片段的类似大小的缩小版本。缩小后的版本用于为分类模型提供宏观层次的上下文。我们使用多尺度方法生成数据,并使用两种不同的放大倍数来准备数据集。
def generate_images(slide, slide_mask, level_1, level_2, window_size, center_size, stride):
  """
  The function generates training data at two different magifications.
  """

  tumor_image = read_slide(slide,
                         x=0,
                         y=0,
                         level=level_1,
                         width=tumor.level_dimensions[level_1][0],
                         height=tumor.level_dimensions[level_1][1])

  tumor_mask_image = read_slide(slide_mask,
                         x=0,
                         y=0,
                         level=level_1,
                         width=tumor.level_dimensions[level_1][0],
                         height=tumor.level_dimensions[level_1][1])

  tumor_mask_image = tumor_mask_image[:,:,0]
  patch_images = []
  patch_labels = []
  patch_center = []
  patch_coord  = []

  count = 0
  tumor_count = 0
  health_count = 1

  for i in range(window_size//2, slide.level_dimensions[level_1][1] - window_size - stride, stride):
    for j in range(window_size//2, slide.level_dimensions[level_1][0] - window_size - stride, stride):

      patch = tumor_image[i:i+window_size, j:j+window_size]
      tumor_mask_patch = tumor_mask_image[i:i+window_size, j:j+window_size]

      tissue_pixels = find_tissue_pixels(patch)
      tissue_pixels = list(tissue_pixels)
      percent_tissue = len(tissue_pixels) / float(patch.shape[0] * patch.shape[0]) * 100

      # If contains a tumor in the center
      if check_centre(tumor_mask_patch, center_size):
        patch_images.append(patch)
        patch_labels.append(1)
        patch_coord.append((j, i))
        patch_center.append((j+window_size//2, i+window_size//2))
        tumor_count += 1
        continue

      # If healthy keep only if the image patch contains more than 50% tissue
      # and sample to keep the memory size small

      if percent_tissue > 75:
        if (health_count < tumor_count) or (np.random.uniform() > (1 - tumor_count/(health_count+tumor_count))):
          patch_images.append(patch)
          patch_labels.append(0)
          patch_coord.append((j, i))
          patch_center.append((j+window_size//2, i+window_size//2))
          health_count += 1

      count += 1

  tumor_ids = [id for id in range(len(patch_labels)) if int(patch_labels[id]) == 1]
  normal_ids = [id for id in range(len(patch_labels)) if int(patch_labels[id]) == 0]

  # Randomly Shuffle the images
  np.random.shuffle(tumor_ids)
  np.random.shuffle(normal_ids)
  total_ids = tumor_ids + normal_ids
  np.random.shuffle(total_ids)

  patch_images = [patch_images[idx] for idx in total_ids]
  patch_labels = [patch_labels[idx] for idx in total_ids]
  patch_center = [patch_center[idx] for idx in total_ids]
  patch_coord = [patch_coord[idx] for idx in total_ids]
  tumor_image = read_slide(slide,
                         x=0,
                         y=0,
                         level=level_2,
                         width=tumor.level_dimensions[level_2][0],
                         height=tumor.level_dimensions[level_2][1])
  patch_images_2 = []
  for center in patch_center:
      patch = tumor_image[center[1]//2-window_size//2:center[1]//2+window_size//2, center[0]//2-window_size//2:center[0]//2+window_size//2]
      assert patch.shape == (window_size, window_size, 3)
      patch_images_2.append(patch)
  return patch_images, patch_images_2, patch_labels, patch_coord
数据增广
我们使用了各种数据增强技术来补充我们的训练数据,使我们的模型更健壮。
正交旋转和翻转
我们引入正交增广来引入旋转不变性,因为幻灯片可以在这些方向上检查
- 随机正交旋转
- 随机水平和垂直翻转
色微扰
为了使我们的模型对光照和颜色强度具有鲁棒性,我们对颜色进行如下扰动。
- 亮度最大为64/255
- 饱和度,最大值为0。25
- 色相的最大增量为0.04
- 而最大值是0。75
#This function applies random brightness, saturation, hue, and constrast to the training images
# The Max Delta Values have been taken directly from the paper
def data_augmentation(img):
    img = tf.image.random_brightness(img, 64.0/255)
    img = tf.image.random_saturation(img, 0.75, 1)
    img = tf.image.random_hue(img, 0.04)
    img = tf.image.random_contrast(img, 0.50, 1)
    return img

#This function applies orthogonal rotation transformations to the training data
def orthogonal_rotations(img):
    return np.rot90(img, np.random.choice([-1, 0, 1, 2]))

# The function maps the pixel values between (-1, 1)
def rescale(image):
    image = image / 255.0
    image = (image - 0.5) * 2
    return image

def preprocess(image):
    image = orthogonal_rotations(image)
    image = data_augmentation(image)
    image = rescale(image)
    return image
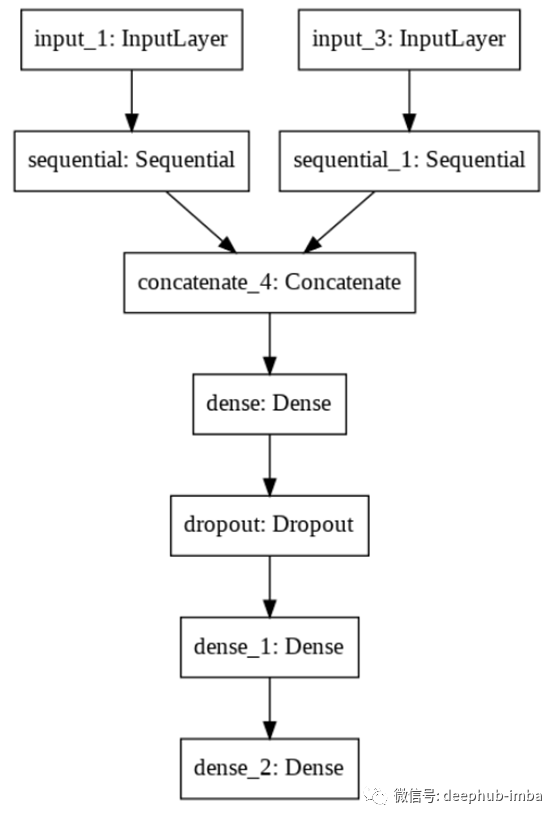
实现方法
我们利用多塔Inception V3模型来利用多尺度图像进行分类。我们只对顶层进行了微调,因为这些层学习更高层次的特性,通过基于我们的数据集对这些层进行微调,结果可以得到很大的改善。
使用的架构:针对> 150层进行微调的Inceptionv3(多尺度)
初始权值:Image Net
损失函数:二元交叉熵损失
放大倍数:2级和3级
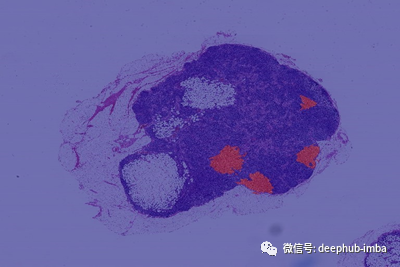
结果
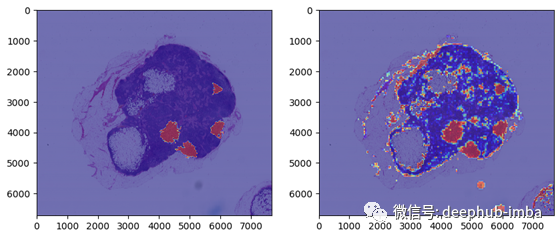
我们最终在一个新的肿瘤切片上测试了我们的模型。在对肿瘤切片进行预处理并做出预测之后,我们使用模型输出创建了一个热图。
- AUC: 0.97659
- Threshold: 0.48429
- Sensitivity: 0.97478
- Specificity: 0.95004
- Recall: 0.97277
- Precision: 0.22275
我们看到所有的肿瘤区域都被正确地识别出来了。
我们可以产生很高的召回率(这在医疗预后中很重要)
带有微调的迁移学习在计算强度较低的情况下能够有效地产生良好的结果
这个模型对边界的预测似乎不太准确。
未来的改进
使用更高的放大图像,获得更好的GPU和更大的RAM。通过计算每个可能的滑动方向的预测,使用预测平均来提高精度和引入旋转不变性。使用更好的前景和背景分离技术来改善边界的性能。
作者:Smarth Gupta
原文地址:https://towardsdatascience.com/using-transfer-learning-for-breast-cancer-detection-2fb3785e2aa
deephub翻译组