
day02
day02配置告警用户数超过50,发送告警邮件实施验证告警配置配置钉钉机器人告警创建钉钉机器人编写脚本并测试添加报警媒介类型为用户添加报警媒介创建触发器创建动作验证自动发现配置自动发现主动监控配置web2使用主动监控修改配置文件,只使用主动监控创建用于主动监控的主机拓扑图完善拓扑图监控Nginxstub_status模块
配置告警
- 默认情况下,监控项不会自动发送告警消息
- 需要配置触发器与告警,并且通过通知方式发送信息给联系人
- 触发器:设置条件,当条件达到时,将会执行某个动作
- 动作:触发器条件达到之后要采取的行为,比如发邮件或执行命令
用户数超过50,发送告警邮件
- 当web1的用户数超过50时,认为这是一个问题(Problem)
- 当出现问题时,将会执行动作。
- 执行的动作是给管理员发邮件。
- 给管理员发邮件,还要配置邮件服务器的地址,以及管理员的email地址
实施
- 创建触发器规则

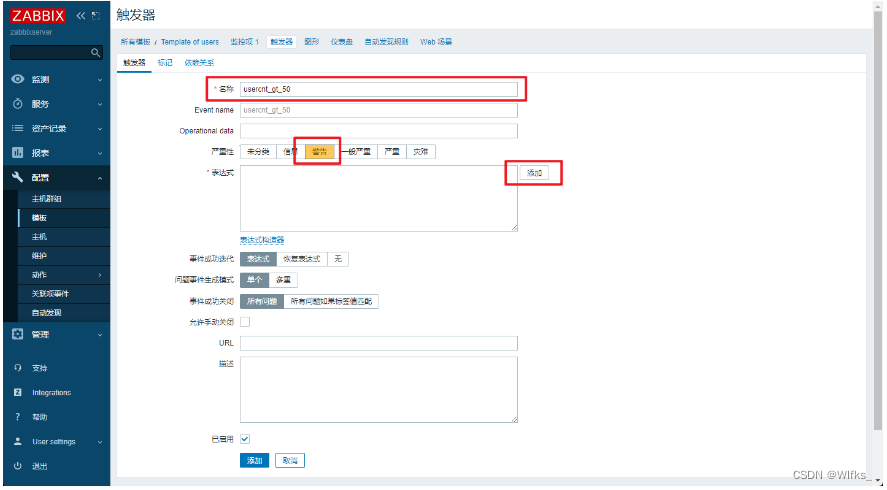


上图中,点击“添加”后,出现下图:


上图中,点击“插入”后的结果如下:


- 创建邮件类型的报警媒介


- 为用户关联邮箱


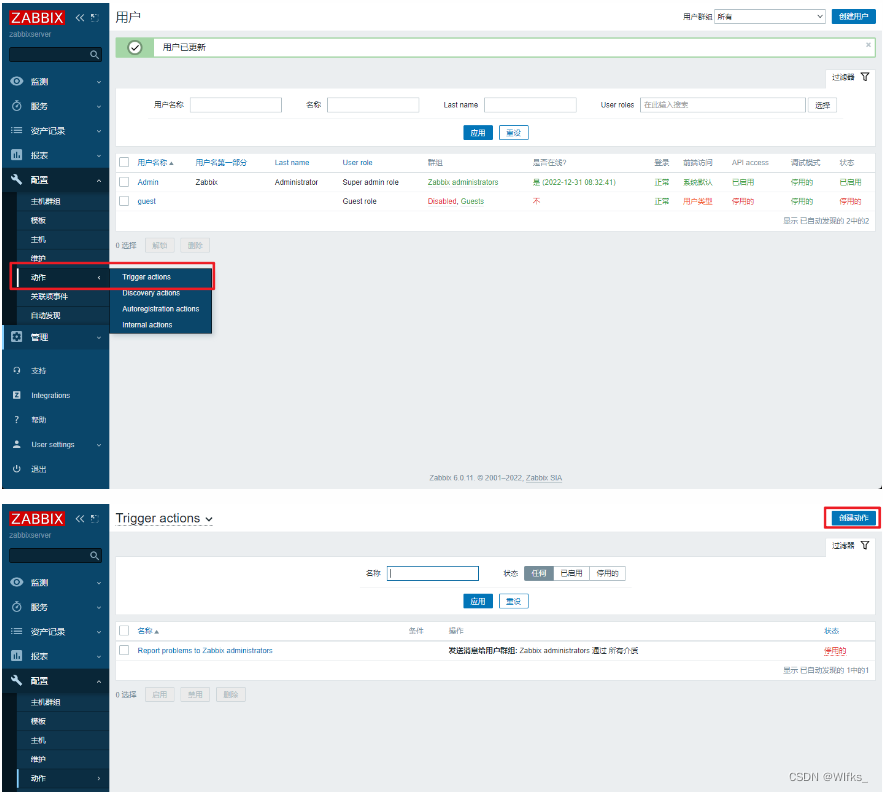
- 创建动作:当出现Problem状态时,给admin发邮件


回到“创建动作”页面后,点击“操作”:


验证告警配置
- 在zabbixserver上配置邮件服务
# 配置postfix邮件服务和mailx邮件客户端
[root@pubserver zabbix]# vim 07-config-mail.yml
---
- name: config mail
hosts: zabbix
tasks:
- name: install mail # 安装postfix和mailx
yum:
name: postfix,mailx
state: present
- name: start postfix # 启动邮件服务postfix
service:
name: postfix
state: started
enabled: yes
[root@pubserver zabbix]# ansible-playbook 07-config-mail.yml
- 在web1创建用户,使总用户数超过50
[root@web1 ~]# for user in user{1..5}
> do
> useradd $user
> done
- 在zabbix web页面中查看
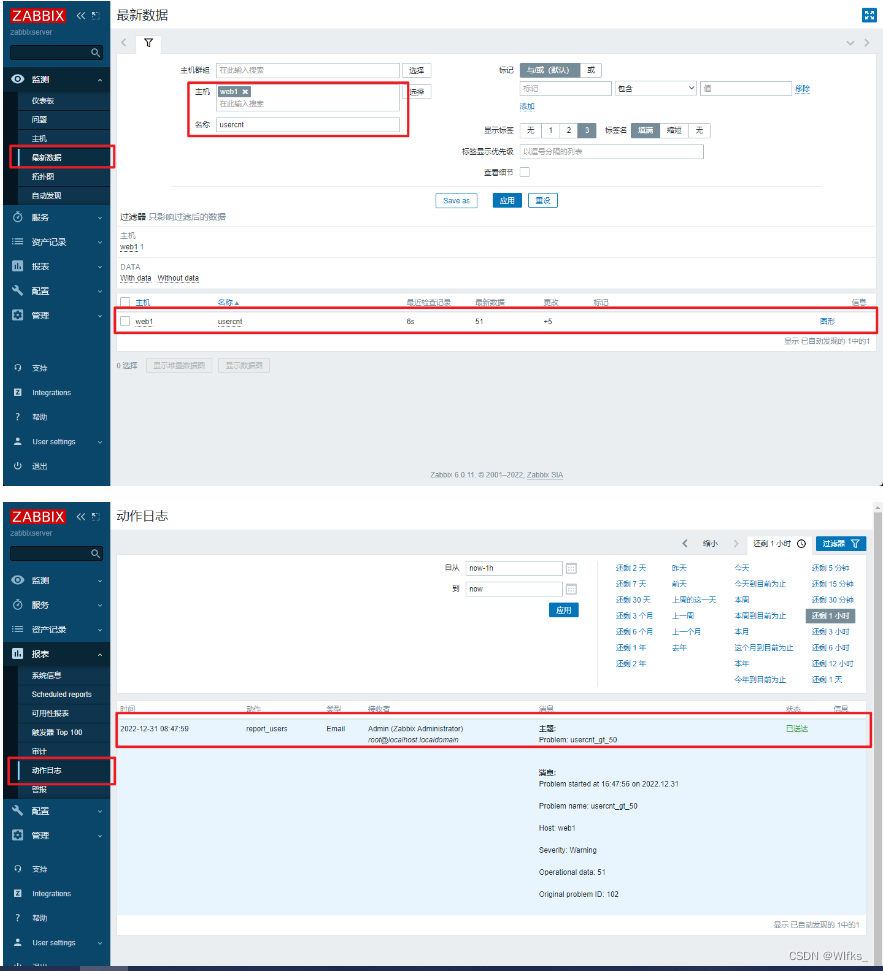


- 在zabbixserver上查看邮件
[root@zabbixserver ~]# mail # 查看邮件
Heirloom Mail version 12.5 7/5/10. Type ? for help.
"/var/spool/mail/root": 2 messages 2 new
>N 1 [email protected] Sat Dec 31 16:47 21/932 "Problem: usercnt_gt_50"
N 2 [email protected] Sat Dec 31 16:48 21/932 "Problem: usercnt_gt_50"
& 1 # 查看1号邮件
Message 1:
From [email protected] Sat Dec 31 16:47:59 2022
Return-Path: <[email protected]>
X-Original-To: [email protected]
Delivered-To: [email protected]
From: <[email protected]>
To: <[email protected]>
Date: Sat, 31 Dec 2022 16:47:59 +0800
Subject: Problem: usercnt_gt_50
Content-Type: text/plain; charset="UTF-8"
Status: R
Problem started at 16:47:56 on 2022.12.31
Problem name: usercnt_gt_50
Host: web1
Severity: Warning
Operational data: 51
Original problem ID: 102
& q # 输入q退出
配置钉钉机器人告警
创建钉钉机器人
- 登陆钉钉网页版:https://im.dingtalk.com/ (或者在windows系统上下载电脑版钉钉)
- 下面以钉钉电脑版为例,配置钉钉群聊机器人
- 在群聊中点击设置,以新建机器人


注意上面的Webhook地址,不要泄露,谁拥有此地址,谁就可以控制机器人说话。
编写脚本并测试
# 安装钉钉机器人脚本需要用到的模块
[root@zabbixserver ~]# yum install -y python3-requests
# 编写钉钉机器人脚本
[root@zabbixserver ~]# vim /usr/lib/zabbix/alertscripts/dingalert.py
#!/usr/bin/env python3
import json
import requests
import sys
def send_msg(url, remiders, msg):
headers = {'Content-Type': 'application/json; charset=utf-8'}
data = {
"msgtype": "text",
"at": {
"atMobiles": remiders,
"isAtAll": False,
},
"text": {
"content": msg,
}
}
r = requests.post(url, data=json.dumps(data), headers=headers)
return r.text
if __name__ == '__main__':
msg = sys.argv[1]
remiders = []
url = '钉钉机器人Webhook地址' # 注意此处需输入机器人的webhook地址
print(send_msg(url, remiders, msg))
[root@zabbixserver ~]# chmod +x /usr/lib/zabbix/alertscripts/dingalert.py
[root@zabbixserver ~]# /usr/lib/zabbix/alertscripts/dingalert.py 'warn: 测试消息' # 注意消息中要包含关键字warn
{"errcode":0,"errmsg":"ok"}


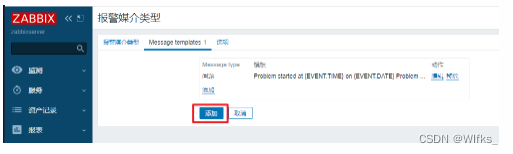
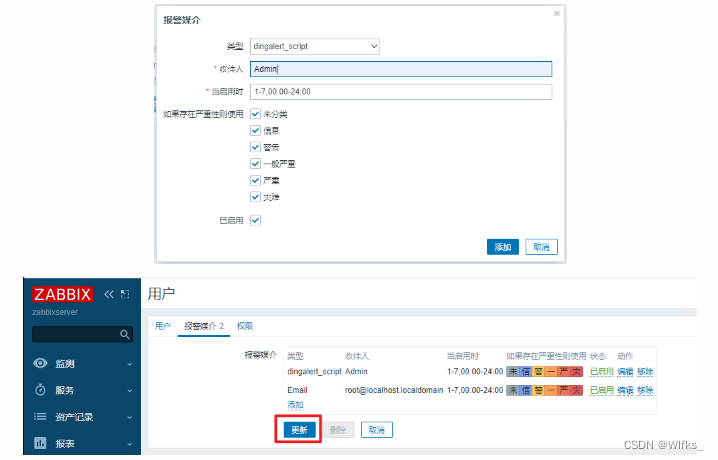
添加报警媒介类型


为用户添加报警媒介


创建触发器
- 创建触发器,用户数超过55则触发问题


创建动作
- 创建动作,用户数超过55则发送钉钉告警消息


验证
- 创建用户,使用户数超过55
[root@web1 ~]# for user in user{6..10}; do useradd $user; done
[root@web1 ~]# zabbix_get -s 127.0.0.1 -k usercnt
56
- 查看结果


自动发现
- 当被监控的设备非常多的时候,手工添加将会变得非常不方便
- 可以使用自动发现功能,实现添加主机、添加到主机组、 链接模板
- 自动发现流程:- 创建自动发现规则- 创建动作,当主机被发现之后,执行什么操作- 通过动作,添加主机,将模板应用到发现的主机
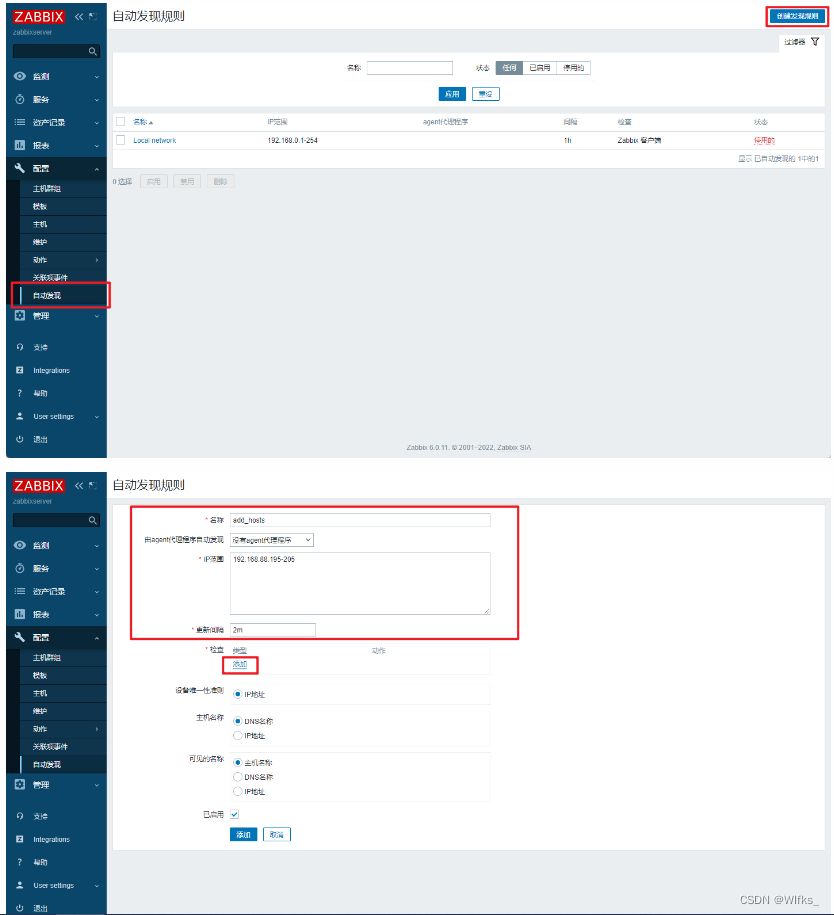
配置自动发现
- 创建自动发现规则
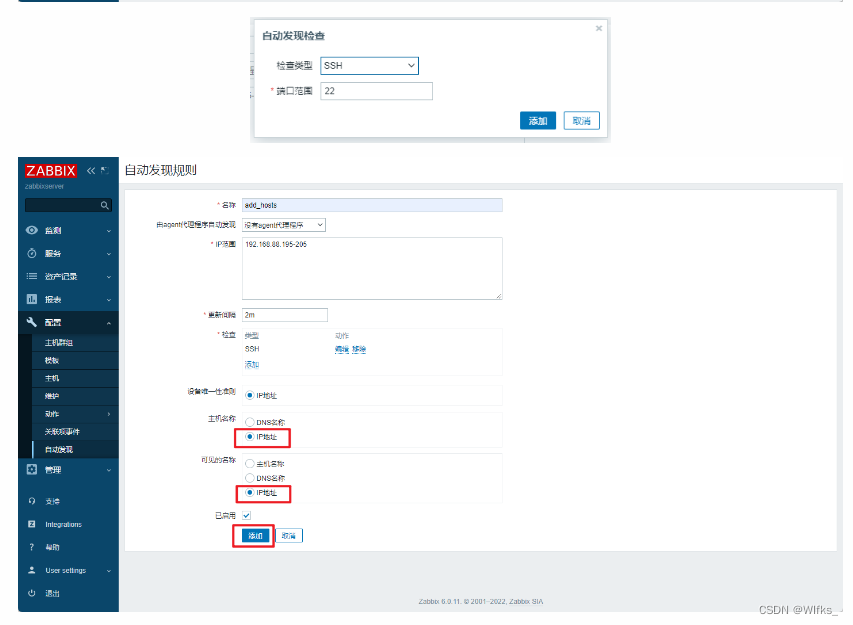


- 创建发现动作


- 添加结果如下:


- 验证


- 在web2上配置agent
[root@web2 ~]# vim /etc/zabbix/zabbix_agentd.conf
117 Server=127.0.0.1,192.168.88.5
182 Hostname=web2
[root@web2 ~]# systemctl enable zabbix-agent.service --now


主动监控
- 默认zabbix使用的是被动监控,主被动监控都是针对被监控主机而言的。
- 被动监控:Server向Agent发起请求,索取监控数据。此种模式常用
- 主动监控:Agent向Server发起连接,向Server汇报
配置web2使用主动监控
修改配置文件,只使用主动监控
[root@web2 ~]# vim /etc/zabbix/zabbix_agentd.conf
117 # Server=127.0.0.1,192.168.88.5
142 StartAgents=0
171 ServerActive=192.168.88.5
242 RefreshActiveChecks=120
# 重启服务
[root@web2 ~]# systemctl restart zabbix-agent.service
[root@web2 ~]# ss -tlnp | grep :10050 # 端口号消失
创建用于主动监控的主机


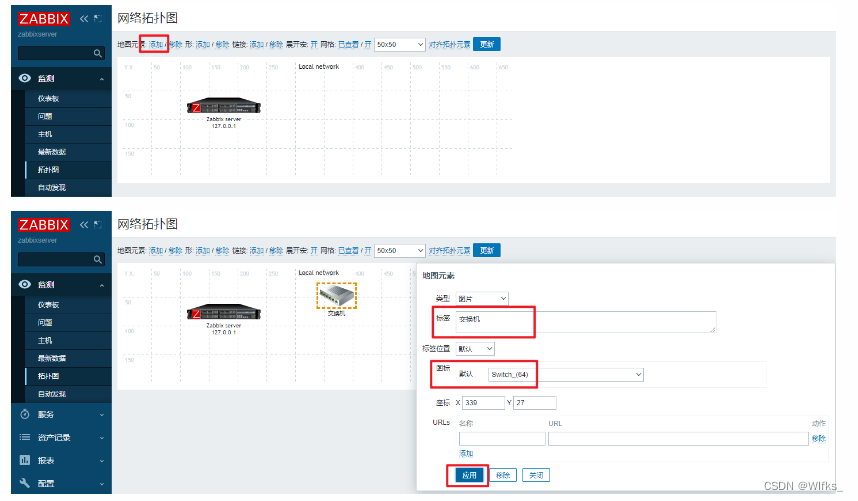
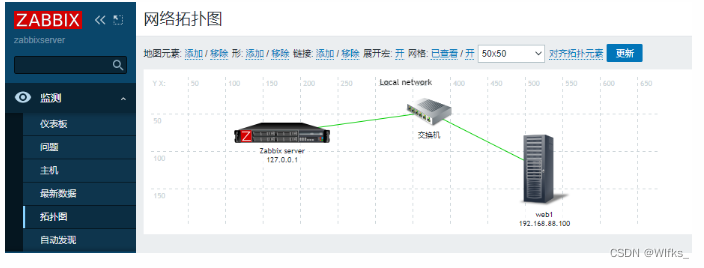
拓扑图
- 在zabbix中可以创建拓扑图,反映拓扑结构


- 添加元素:- 地图元素:可以是一个装饰图形,也可以对应具体的设备- 形状:长方形、圆形- 链接:连线,多个设备之间才能使用链接
完善拓扑图
- 添加交换机图标


- 添加链接:按住ctrl键,点选两台设备,点链接边上的添加


- 添加web服务器


- 添加链接

监控Nginx
stub_status模块
- 用于实时监控nginx的网络连接,这个模块是nginx官方提供的一个模块。
- 配置nginx
[root@pubserver zabbix]# vim 08-config-nginx.yml
---
- name: config nginx
hosts: webservers
tasks:
- name: install nginx # 安装nginx
yum:
name: nginx
state: present
- name: start nginx # 启动nginx
service:
name: nginx
state: started
enabled: yes
[root@pubserver zabbix]# ansible-playbook 08-config-nginx.yml
# 修改配置文件,启用stub_status功能
[root@web1 ~]# vim /etc/nginx/nginx.conf
...略...
47 location / {
48 }
49
50 location /status { # 在此处添加3行
51 stub_status on;
52 }
53
54 error_page 404 /404.html;
55 location = /40x.html {
56 }
...略...
[root@web1 ~]# systemctl restart nginx
# 访问监控页面
[root@zabbixserver ~]# curl http://192.168.88.100/status
Active connections: 1
server accepts handled requests
2 2 2
Reading: 0 Writing: 1 Waiting: 0
# Active connections:当前客户端与nginx之间的连接数。它等于下面Reading / Writing / Waiting之和
# accepts:自nginx启动之后,客户端访问的总量
# handled:自nginx启动之后,处理过的客户端连接总数,通常等于accepts的值。
# requests:自nginx启动之后,处理过的客户端请求总数。
# Reading:正在读取客户端的连接总数。
# Writing:正在向客户端发送响应的连接总数。
# Waiting:空闲连接。
# 使用工具向服务器发起多个请求
[root@zabbixserver ~]# yum install -y httpd-tools
# 一共发1000个请求,每次并发数200
[root@zabbixserver ~]# ab -n1000 -c200 http://192.168.88.100/
[root@zabbixserver ~]# curl http://192.168.88.100/status
Active connections: 1
server accepts handled requests
1097 1097 1003
Reading: 0 Writing: 1 Waiting: 0
- 编写脚本,用于获取各项数据
[root@web1 ~]# vim /usr/local/bin/nginx_status.sh
#!/bin/bash
case $1 in
active)
curl -s http://192.168.88.100/status | awk '/Active/{print $NF}';;
waiting)
curl -s http://192.168.88.100/status | awk '/Waiting/{print $NF}';;
accepts)
curl -s http://192.168.88.100/status | awk 'NR==3{print $1}';;
esac
[root@web1 ~]# chmod +x /usr/local/bin/nginx_status.sh
[root@web1 ~]# nginx_status.sh active
1
[root@web1 ~]# nginx_status.sh accepts
1099
[root@web1 ~]# nginx_status.sh waiting
0
- 创建zabbix用到的key,获取各项数据
# key的语法格式
UserParameter=key[*],<command> $1
# key[*]中的*是参数,将会传给后面的位置变量$1
# 创建声明key的文件
[root@web1 ~]# vim /etc/zabbix/zabbix_agentd.d/nginx_status.conf
UserParameter=nginx_status[*],/usr/local/bin/nginx_status.sh $1
# 测试
[root@web1 ~]# systemctl restart zabbix-agent.service
[root@web1 ~]# zabbix_get -s 127.0.0.1 -k nginx_status[active]
1
[root@web1 ~]# zabbix_get -s 127.0.0.1 -k nginx_status[waiting]
0
[root@web1 ~]# zabbix_get -s 127.0.0.1 -k nginx_status[accepts]
1103
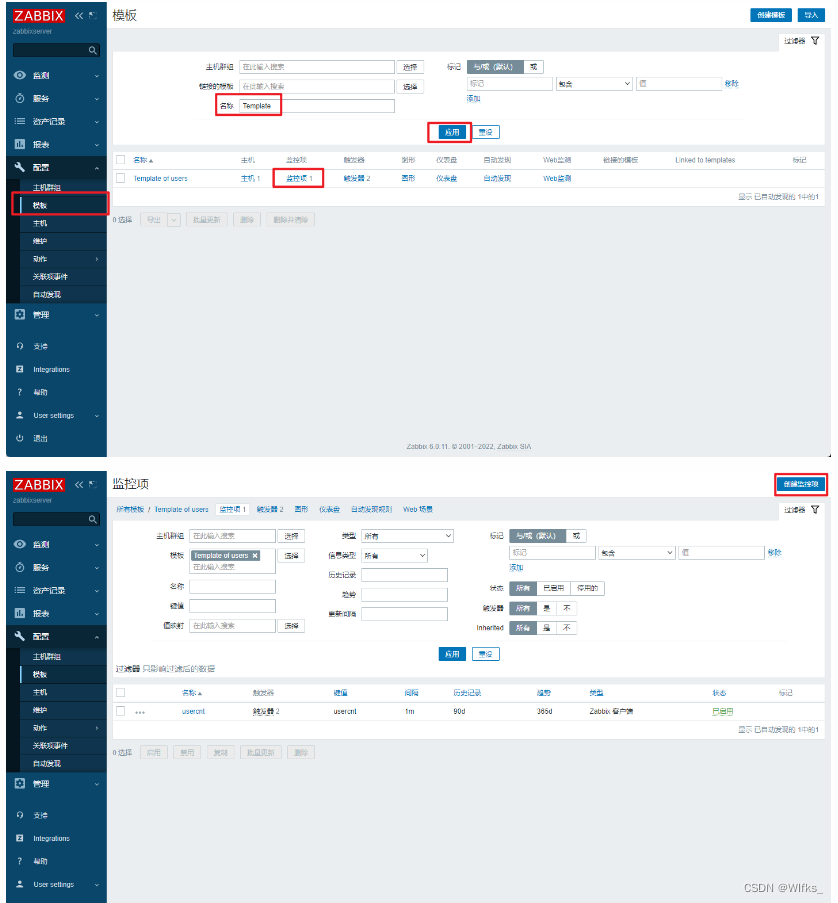
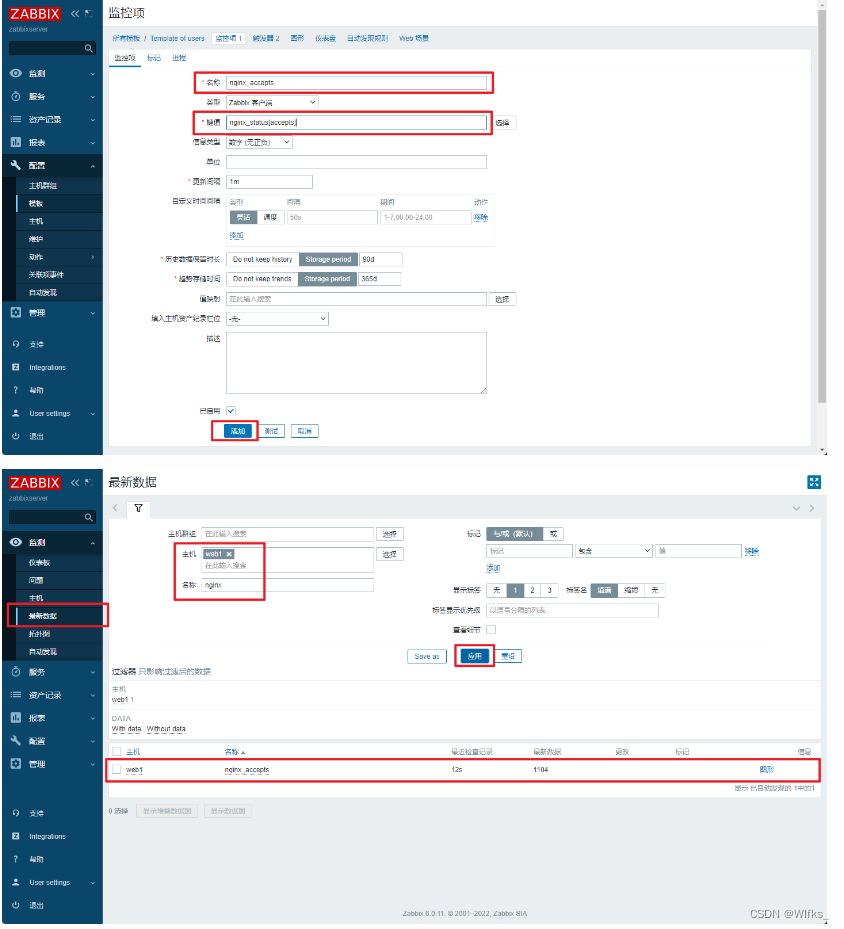
- 在zabbix上创建监控项


知识点思维导图:https://flowus.cn/share/7875c0e1-ebbd-4dad-aa7e-f40e6ed6c6d3
本文转载自: https://blog.csdn.net/m0_52686092/article/details/132069806
版权归原作者 WIfks_ 所有, 如有侵权,请联系我们删除。
版权归原作者 WIfks_ 所有, 如有侵权,请联系我们删除。