

本文总计 1000字,预计阅读需要 3-4分钟
背景
Prometheus 是一套开源的系统监控报警框架。它启发于 Google 的 borgmon 监控系统,由工作在 SoundCloud 的 google 前员工在 2012 年创建,作为社区开源项目进行开发,并于 2015 年正式发布。因为Kubernetes的火爆,所以Prometheus 在快速的发展。Prometheus 的架构我就不在这里细说了,因为别的文章介绍的很详细。这里主要介绍的是为什么要在树莓派上做。
其实我的需求很简单,有几台服务器,一直想做一些简单的运行状态的监控,但是像Zabbix这样的老牌监控安装又比较麻烦,之所以选择Prometheus是因为他安装和配置比较简单,又不是特别占内存,正常使用的话一个node_exporter大概只需要60M左右的内存,prometheus大概200M,grafana大概60M,这对于现在的内存来说简直是微量了,所以就想在树莓派上搭建一个小型的监控系统是完全没有问题。所以我就选择了我13年购买的Pi1进行了一下测试。
安装
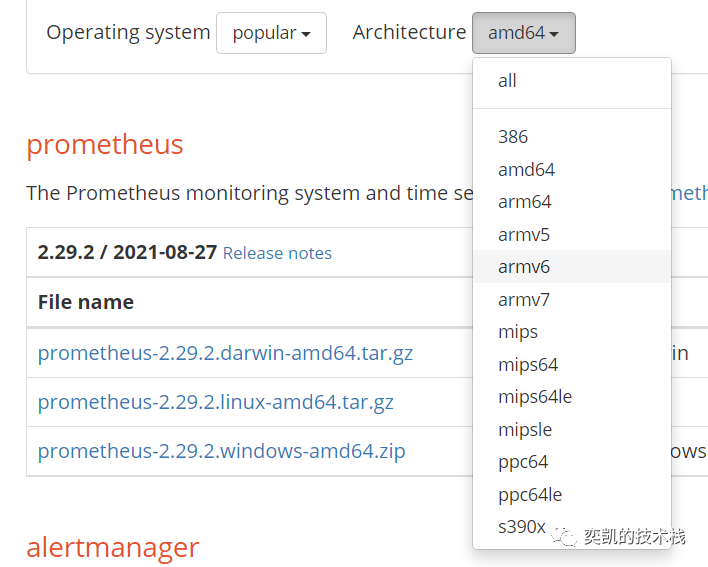
Prometheus的安装和配置非常简单,我们只要按照官网的步骤安装就可以了,这里要说明的是因为Prometheus发布的都是二进制的版本,所以安装的时候要注意一下,Raspberry Pi 1和Zero是ArmV6的架构,Pi3和Pi4是ArmV7,所以不要弄错了,否则运行不了。
直接下载后解压即可使用,然后可以顺带下载一个node_exporter,监控一下树莓派的运行情况。
安装完后需要安装grafana,我们也需要从官网下载,直接安装就好
wget https://dl.grafana.com/oss/release/grafana-rpi_8.1.2_armhf.debsudo dpkg -i grafana-rpi_8.1.2_armhf.deb
安装完成后可以直接启动
sudo systemctl start grafana-server
这样就直接可以用了,但是如果我们通过外网通讯的话把node_exporter暴露出来,还是有一些安全的隐患,虽然信息并不很敏感,但是我们还是要一层简单的验证,至少能保证部分的安全。
安全加固
在这里我们通过Nginx进行反代,然后设置web验证为node_exporter设置访问的密码,这样至少不是完全的暴露了,如果需要更加安全的方式,可以使用https,我个人来说就不需要了。
首先安装nginx,我服务器是Centos,所以直接根据官网教程使用yum源安装。
http://nginx.org/en/linux_packages.html#RHEL-CentOS
安装完成后还需要安装apache-htpasswd工具,生成密码文件
yum -y install httpd-tools
生成密钥文件
htpasswd -cs /home/wwwroot/htpasswd prome
注:prome是用户名,密码会在执行时要求输入两次
生成完成后,修改nginx配置
location /metrics {auth_basic"metrics";auth_basic_user_file /home/wwwroot/htpasswd;proxy_pass http://localhost:9100; }
设置 /metrics与Prometheus 的默认配置相同。
最后配置Prometheus ,这样就可以配置监控了,以下是我的Prometheus配置文件:
# my global configglobal:  scrape_interval: 60s # Set the scrape interval to every 15 seconds. Default is every 1 minute.  evaluation_interval: 60s # Evaluate rules every 15 seconds. The default is every 1 minute.# scrape_timeout is set to the global default (10s).
# Alertmanager configurationalerting:  alertmanagers:    - static_configs:        - targets:# - alertmanager:9093
# Load rules once and periodically evaluate them according to the global 'evaluation_interval'.rule_files:# - "first_rules.yml"# - "second_rules.yml"
# A scrape configuration containing exactly one endpoint to scrape:# Here it's Prometheus itself.scrape_configs:# The job name is added as a label `job=<job_name>` to any timeseries scraped from this config.  - job_name: "rasp pi nashao"    static_configs:      - targets: ["localhost:9100"]  - job_name: "vm"    static_configs:      - targets: ["aaa","bbb"]    basic_auth:      username: prome      password: passwd
因为树莓派性能不高,存储也不大,所以抓取的间隔我设置成了60秒,这样占用资源很低,是可以接受的。另外就是因为刚才通过nginx的反代设置了验证,所以在配置里面要通过basic_auth进行设置,这样就ok了。
Prometheus 本地部署,所以启动的时候可以加上参数
--web.enable-lifecycle
这样配置文件就可以热更了
curl -X POST http://192.168.0.100:9090/-/reload
下面看看效果吧。
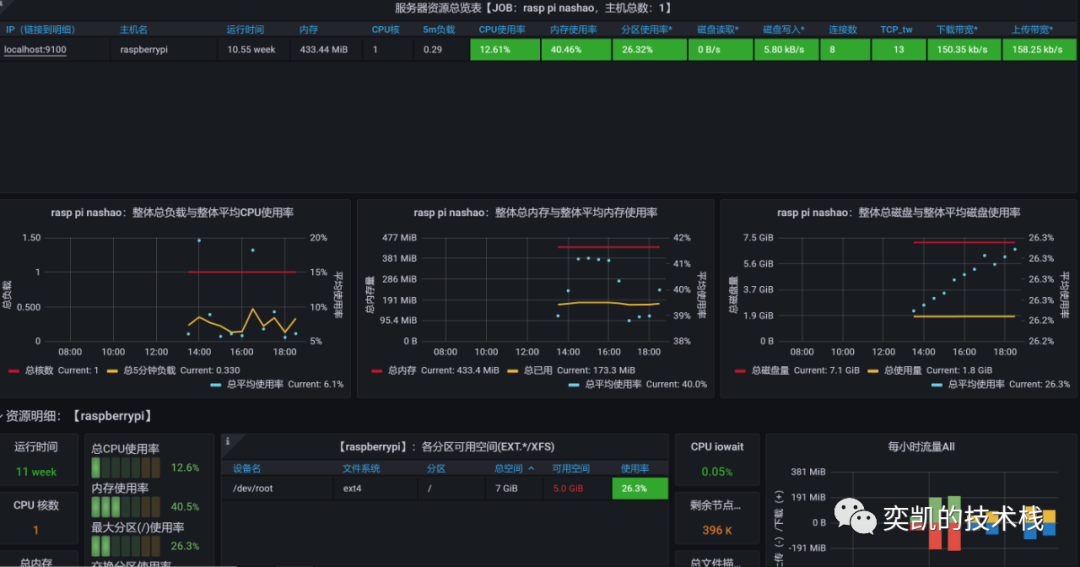
非常的完美。