
Streamlit简介
✨Streamlit是一个基于tornado框架的快速搭建Web应用的Python库,封装了大量常用组件方法,支持大量数据表、图表等对象的渲染,支持网格化、响应式布局。简单来说,可以让不了解前端的人搭建网页。
相比于同类产品PyWebIO,Streamlit的功能更加全面一些。
官方文档:https://docs.streamlit.io/
安装
安装前注意,python版本需满足:Python 3.7 - Python 3.11
pip install streamlit
安装完之后,终端输入:
streamlit hello
然后访问
http://localhost:8501
,可以看到一些示例demo。
下面将通过官方文档中API的顺序来进行学习。
渲染元素:Write and magic
st.write
st.write是常规的渲染数据的手段。
下面来渲染一个
hello world
:
import streamlit as st

st.write('Hello, *World!* :sunglasses:')
输入完成之后,终端启动py文件:
streamlit run main.py

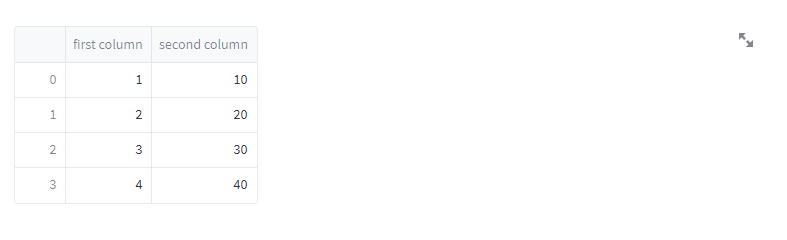
下面是个渲染pandas表格数据的实例:
import streamlit as st
import pandas as pd

st.write(pd.DataFrame({'first column':[1,2,3,4],'second column':[10,20,30,40],}))
之前终端若无终止,这里可以直接刷新界面查看最新的渲染情况。
Streamlit对于表格型的pandas数据,自动提供了排序和缩放显示的功能。
Magic
Streamlit提供了一种魔法(Magic),无需借助
st.write
就可以显示元素。
该方法默认是开启的,如果需要关闭该方法,可以修改
~/.streamlit/config.toml
的这个文件内容:
[runner]
magicEnabled = false
值得注意的是,Magic方法只能成功作用于启动的py文件,对于import之类的py文件,魔法会失效。
下面就用魔法来显示和上面一样的表格:
import pandas as pd
df = pd.DataFrame({'first column':[1,2,3,4],'second column':[10,20,30,40],})
df  # 👈 Draw the dataframe
这里相当于输入变量名,直接自动调用st.write()方法,这一点有点类似于jupyter。
文本元素:Text elements
这一部分就是讲不同类型的文本元素,直接看示例即可。
markdown
import streamlit as st

st.markdown('Streamlit is **_really_ cool**.')
st.markdown("This text is :red[colored red], and this is **:blue[colored]** and bold.")
st.markdown(":green[$\sqrt{x^2+y^2}=1$] is a Pythagorean identity. :pencil:")
title
import streamlit as st

st.title('This is a title')
st.title('A title with _italics_ :blue[colors] and emojis :sunglasses:')
这里的title不是指H5里面的title来改选项卡名称,仅仅等同于一个h1标签。
header
import streamlit as st

st.header('This is a header')
st.header('A header with _italics_ :blue[colors] and emojis :sunglasses:')
header:比title小一号的字体。
subheader
import streamlit as st

st.subheader('This is a subheader')
st.subheader('A subheader with _italics_ :blue[colors] and emojis :sunglasses:')
caption
import streamlit as st

st.caption('This is a string that explains something above.')
st.caption('A caption with _italics_ :blue[colors] and emojis :sunglasses:')
caption:小号字体
code
import streamlit as st

code ='''def hello():
    print("Hello, Streamlit!")'''
st.code(code, language='python')
text
import streamlit as st

st.text('This is some text.')
text:普通字体
latex
import streamlit as st

st.latex(r'''
    a + ar + a r^2 + a r^3 + \cdots + a r^{n-1} =
    \sum_{k=0}^{n-1} ar^k =
    a \left(\frac{1-r^{n}}{1-r}\right)
    ''')
展示数据:Data display elements
dataframe
import streamlit as st
import pandas as pd
import numpy as np

df = pd.DataFrame(
   np.random.randn(10,20),
   columns=('col %d'% i for i inrange(20)))

st.dataframe(df.style.highlight_max(axis=0))
dataframe就是像excel中那种活动表,包含排序、搜索等功能。
table
import streamlit as st
import pandas as pd
import numpy as np

df = pd.DataFrame(
   np.random.randn(10,5),
   columns=('col %d'% i for i inrange(5)))

st.table(df)
table是不包含特殊功能的普通表。
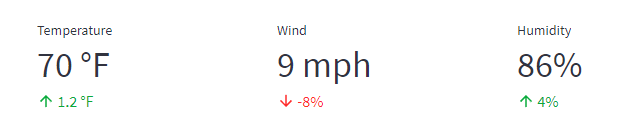
metric
metric指代的是网格(grid)布局。
import streamlit as st

col1, col2, col3 = st.columns(3)
col1.metric("Temperature","70 °F","1.2 °F")
col2.metric("Wind","9 mph","-8%")
col3.metric("Humidity","86%","4%")
json
import streamlit as st

st.json({'foo':'bar','baz':'boz','stuff':['stuff 1','stuff 2','stuff 3','stuff 5',],})
图表元素:Chart elements
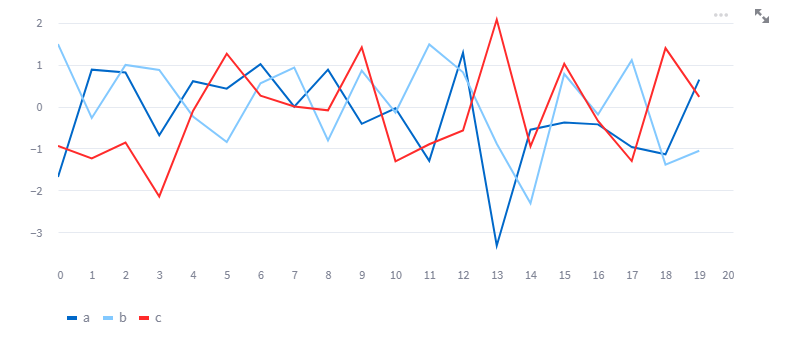
折线图:line_chart
import streamlit as st
import pandas as pd
import numpy as np

chart_data = pd.DataFrame(
    np.random.randn(20,3),
    columns=['a','b','c'])

st.line_chart(chart_data)
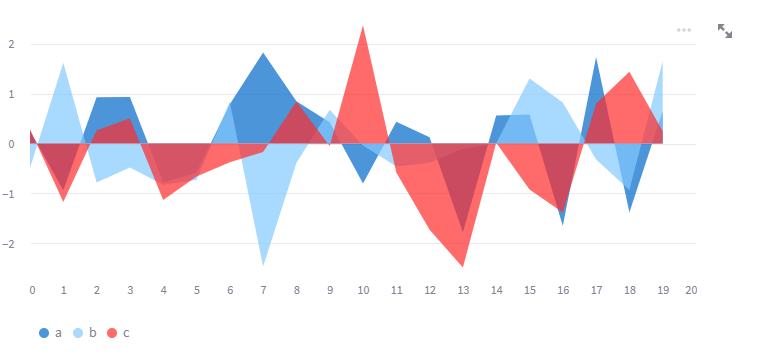
折线面积图:area_chart
import streamlit as st
import pandas as pd
import numpy as np

chart_data = pd.DataFrame(
    np.random.randn(20,3),
    columns=['a','b','c'])

st.area_chart(chart_data)
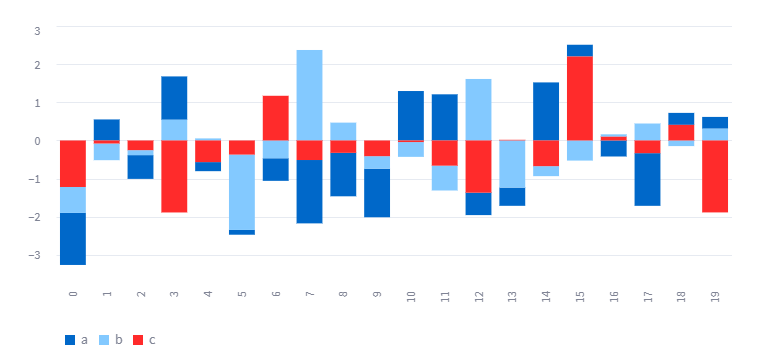
柱状图:bar_chart
import streamlit as st
import pandas as pd
import numpy as np

chart_data = pd.DataFrame(
    np.random.randn(20,3),
    columns=["a","b","c"])

st.bar_chart(chart_data)
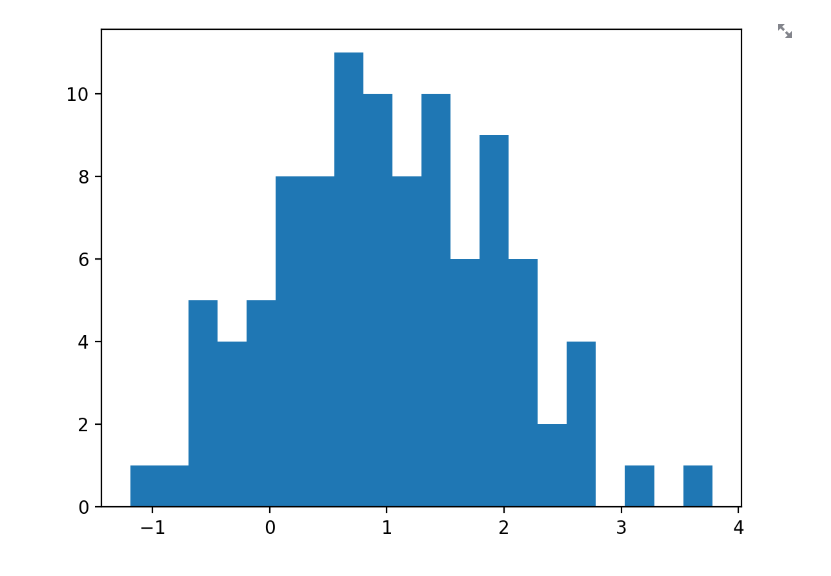
柱形面积图:pyplot
import streamlit as st
import matplotlib.pyplot as plt
import numpy as np

arr = np.random.normal(1,1, size=100)
fig, ax = plt.subplots()
ax.hist(arr, bins=20)

st.pyplot(fig)
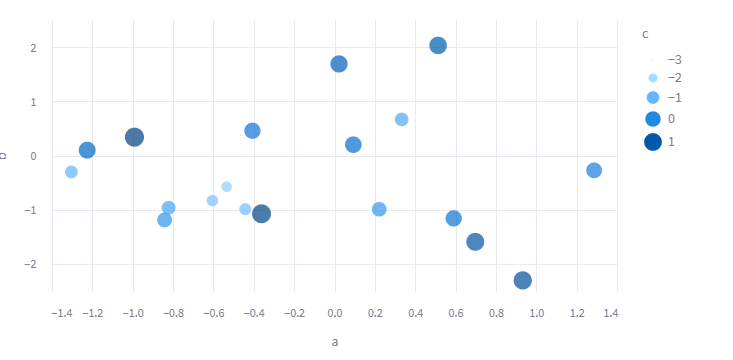
散点图:altair_chart
import streamlit as st
import pandas as pd
import numpy as np
import altair as alt

chart_data = pd.DataFrame(
    np.random.randn(20,3),
    columns=['a','b','c'])

c = alt.Chart(chart_data).mark_circle().encode(
    x='a', y='b', size='c', color='c', tooltip=['a','b','c'])

st.altair_chart(c, use_container_width=True)
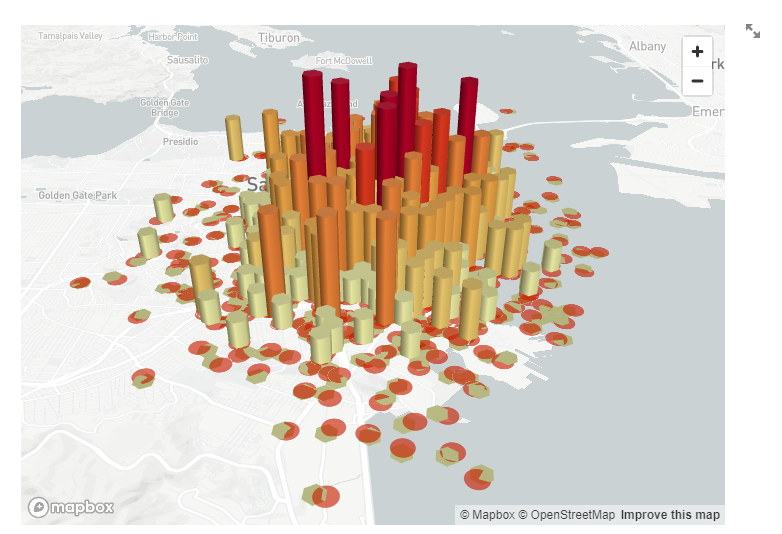
三维柱状图:pydeck_chart
import streamlit as st
import pandas as pd
import numpy as np
import pydeck as pdk

chart_data = pd.DataFrame(
   np.random.randn(1000,2)/[50,50]+[37.76,-122.4],
   columns=['lat','lon'])

st.pydeck_chart(pdk.Deck(
    map_style=None,
    initial_view_state=pdk.ViewState(
        latitude=37.76,
        longitude=-122.4,
        zoom=11,
        pitch=50,),
    layers=[
        pdk.Layer('HexagonLayer',
           data=chart_data,
           get_position='[lon, lat]',
           radius=200,
           elevation_scale=4,
           elevation_range=[0,1000],
           pickable=True,
           extruded=True,),
        pdk.Layer('ScatterplotLayer',
            data=chart_data,
            get_position='[lon, lat]',
            get_color='[200, 30, 0, 160]',
            get_radius=200,),],))
二维散点地图:map
import streamlit as st
import pandas as pd
import numpy as np

df = pd.DataFrame(
    np.random.randn(1000,2)/[50,50]+[37.76,-122.4],
    columns=['lat','lon'])

st.map(df)
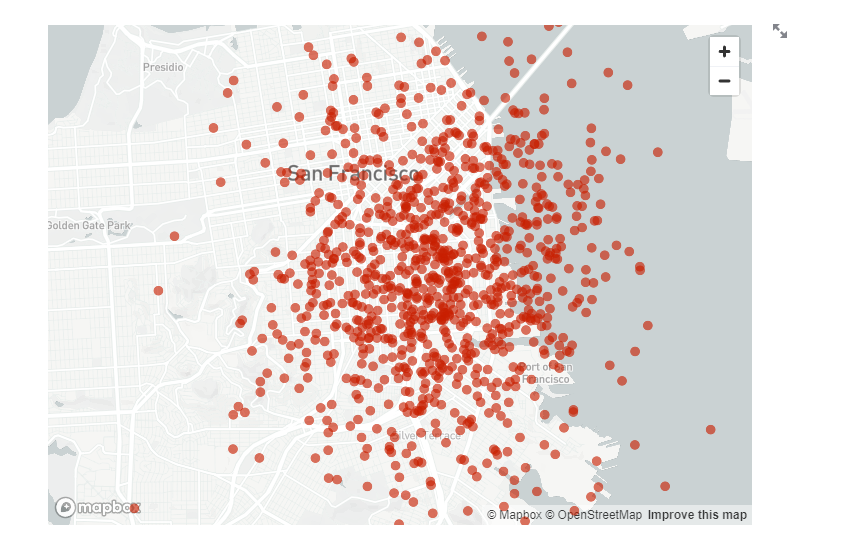
这两个图和excel中的三维地图效果很相似。
此外,还有一些组合图、树状图,以及一些绘图参数说明,这里略过。
交互组件:Input widgets
按钮:button
import streamlit as st

if st.button('Say hello'):
    st.write('Why hello there')else:
    st.write('Goodbye')
表格编辑器:experimental_data_editor
import streamlit as st
import pandas as pd

df = pd.DataFrame([{"command":"st.selectbox","rating":4,"is_widget":True},{"command":"st.balloons","rating":5,"is_widget":False},{"command":"st.time_input","rating":3,"is_widget":True},])
edited_df = st.experimental_data_editor(df)

favorite_command = edited_df.loc[edited_df["rating"].idxmax()]["command"]
st.markdown(f"Your favorite command is **{favorite_command}** 🎈")
可以由用户来编辑表格内容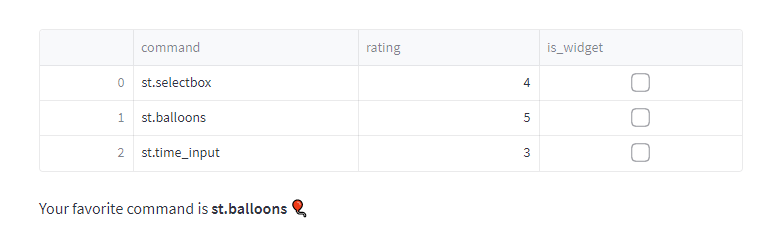
下载按钮:download_button
这个是一个特殊按钮,用户点击之后可以下载文件。
下载DataFrame为CSV文件:
import streamlit as st

@st.cachedefconvert_df(df):# IMPORTANT: Cache the conversion to prevent computation on every rerunreturn df.to_csv().encode('utf-8')

csv = convert_df(my_large_df)

st.download_button(
    label="Download data as CSV",
    data=csv,
    file_name='large_df.csv',
    mime='text/csv',)
下载文本为txt文件:
import streamlit as st

text_contents ='''This is some text'''
st.download_button('Download some text', text_contents)
下载二进制文件:
import streamlit as st

binary_contents =b'example content'# Defaults to 'application/octet-stream'
st.download_button('Download binary file', binary_contents)
下载图片:
import streamlit as st

withopen("flower.png","rb")asfile:
    btn = st.download_button(
            label="Download image",
            data=file,
            file_name="flower.png",
            mime="image/png")
勾选框:checkbox
import streamlit as st

agree = st.checkbox('I agree')if agree:
    st.write('Great!')
单选按钮:radio
import streamlit as st

genre = st.radio("What\'s your favorite movie genre",('Comedy','Drama','Documentary'))if genre =='Comedy':
    st.write('You selected comedy.')else:
    st.write("You didn\'t select comedy.")
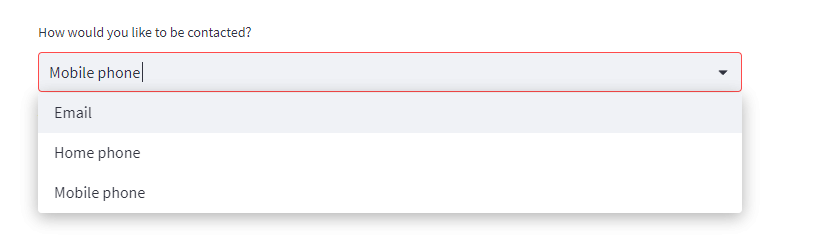
单选框:selectbox
import streamlit as st

option = st.selectbox('How would you like to be contacted?',('Email','Home phone','Mobile phone'))

st.write('You selected:', option)
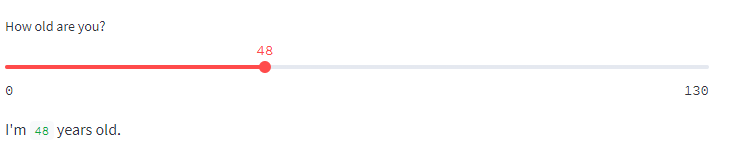
滑动块:slider
import streamlit as st

age = st.slider('How old are you?',0,130,25)
st.write("I'm ", age,'years old')
输入文本框:text_input
import streamlit as st

title = st.text_input('Movie title','Life of Brian')
st.write('The current movie title is', title)
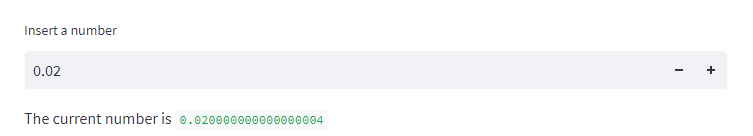
输入数字框:number_input
import streamlit as st

number = st.number_input('Insert a number')
st.write('The current number is ', number)
输入日期框:date_input
import datetime
import streamlit as st

d = st.date_input("When\'s your birthday",
    datetime.date(2019,7,6))
st.write('Your birthday is:', d)
点击可以唤起日历
文件上传按钮:file_uploader
上传单个文件:
import streamlit as st
import pandas as pd
from io import StringIO

uploaded_file = st.file_uploader("Choose a file")if uploaded_file isnotNone:# To read file as bytes:
    bytes_data = uploaded_file.getvalue()
    st.write(bytes_data)# To convert to a string based IO:
    stringio = StringIO(uploaded_file.getvalue().decode("utf-8"))
    st.write(stringio)# To read file as string:
    string_data = stringio.read()
    st.write(string_data)# Can be used wherever a "file-like" object is accepted:
    dataframe = pd.read_csv(uploaded_file)
    st.write(dataframe)
上传多个文件:
import streamlit as st

uploaded_files = st.file_uploader("Choose a CSV file", accept_multiple_files=True)for uploaded_file in uploaded_files:
    bytes_data = uploaded_file.read()
    st.write("filename:", uploaded_file.name)
    st.write(bytes_data)
此外,还有调用摄像头实时显示的camera_input,选择颜色color_picker,适用场景比较小,这里略过。
媒体元素:Media elements
图片:image
import streamlit as st
from PIL import Image

image = Image.open('sunrise.jpg')

st.image(image, caption='Sunrise by the mountains')
音频:audio
import streamlit as st
import numpy as np

audio_file =open('myaudio.ogg','rb')
audio_bytes = audio_file.read()

st.audio(audio_bytes,format='audio/ogg')

sample_rate =44100# 44100 samples per second
seconds =2# Note duration of 2 seconds
frequency_la =440# Our played note will be 440 Hz# Generate array with seconds*sample_rate steps, ranging between 0 and seconds
t = np.linspace(0, seconds, seconds * sample_rate,False)# Generate a 440 Hz sine wave
note_la = np.sin(frequency_la * t *2* np.pi)

st.audio(note_la, sample_rate=sample_rate)
视频:video
import streamlit as st

video_file =open('myvideo.mp4','rb')
video_bytes = video_file.read()

st.video(video_bytes)
布局和容器:Layouts and containers
侧边栏:sidebar
sidebar的以下两种调用方式等效:
# Object notation
st.sidebar.[element_name]# 等效于# "with" notationwith st.sidebar:
    st.[element_name]
使用示例:
import streamlit as st

# Using object notation
add_selectbox = st.sidebar.selectbox("How would you like to be contacted?",("Email","Home phone","Mobile phone"))# Using "with" notationwith st.sidebar:
    add_radio = st.radio("Choose a shipping method",("Standard (5-15 days)","Express (2-5 days)"))

它可以将上述各种元素嵌到侧边栏中,侧边栏支持弹出和收缩。
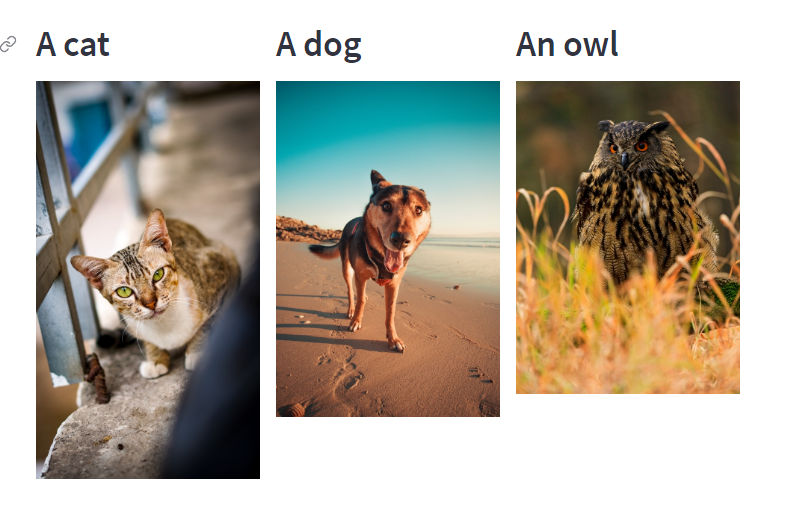
行列布局:columns
示例:
import streamlit as st

col1, col2, col3 = st.columns(3)with col1:
   st.header("A cat")
   st.image("https://static.streamlit.io/examples/cat.jpg")with col2:
   st.header("A dog")
   st.image("https://static.streamlit.io/examples/dog.jpg")with col3:
   st.header("An owl")
   st.image("https://static.streamlit.io/examples/owl.jpg")
标签界面:tabs
标签界面有点类似于Android里面的Fragment,相当于做了一个局部的界面切换。
import streamlit as st

tab1, tab2, tab3 = st.tabs(["Cat","Dog","Owl"])with tab1:
   st.header("A cat")
   st.image("https://static.streamlit.io/examples/cat.jpg", width=200)with tab2:
   st.header("A dog")
   st.image("https://static.streamlit.io/examples/dog.jpg", width=200)with tab3:
   st.header("An owl")
   st.image("https://static.streamlit.io/examples/owl.jpg", width=200)

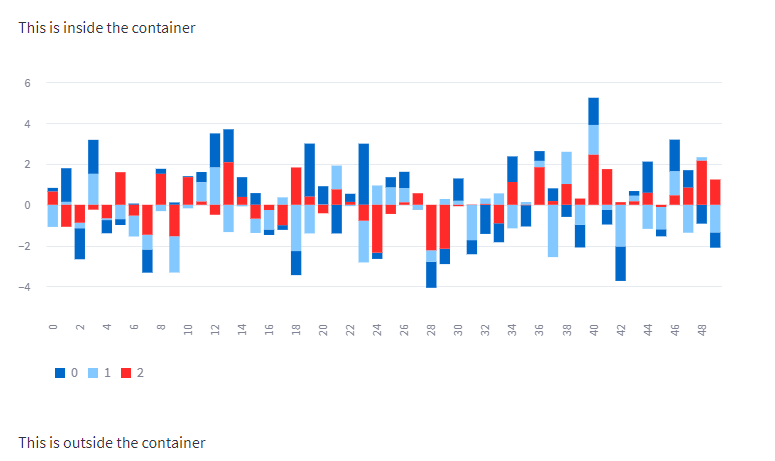
容器:container
容器的作用在于可以将一些元素组合起来,比如让一些元素一起不可见,此时,隐藏容器即可实现。
容器基本使用:
import streamlit as st

with st.container():
   st.write("This is inside the container")# You can call any Streamlit command, including custom components:
   st.bar_chart(np.random.randn(50,3))

st.write("This is outside the container")
状态元素:Status elements
进度条:progress
import streamlit as st
import time

progress_text ="Operation in progress. Please wait."
my_bar = st.progress(0, text=progress_text)for percent_complete inrange(100):
    time.sleep(0.1)
    my_bar.progress(percent_complete +1, text=progress_text)

加载圈:spinner
import time
import streamlit as st

with st.spinner('Wait for it...'):
    time.sleep(5)
st.success('Done!')

气球:balloon
挺有意思的一段过场动画,没有特别的实际意义。
import streamlit as st

st.balloons()

错误:error
import streamlit as st

st.error('This is an error', icon="🚨")

警告:warning
import streamlit as st

st.warning('This is a warning', icon="⚠️")
通知:info
import streamlit as st

st.info('This is a purely informational message', icon="ℹ️")
成功:success
import streamlit as st

st.success('This is a success message!', icon="✅")
异常:exception
import streamlit as st

e = RuntimeError('This is an exception of type RuntimeError')
st.exception(e)
控制流:Control flow
停止运行:stop
代码运行到
st.stop
的时候停止,类似于debug中的断点。
可以适用于判断用户输入的场景:
import streamlit as st

name = st.text_input('Name')ifnot name:
  st.warning('Please input a name.')
  st.stop()
st.success('Thank you for inputting a name.')
这里用户输入不为空时,才执行success。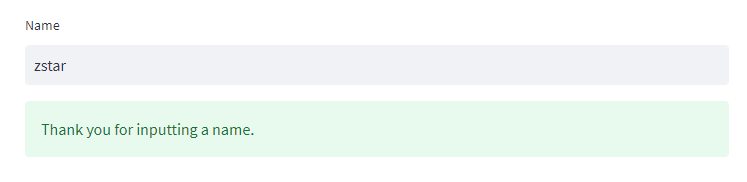
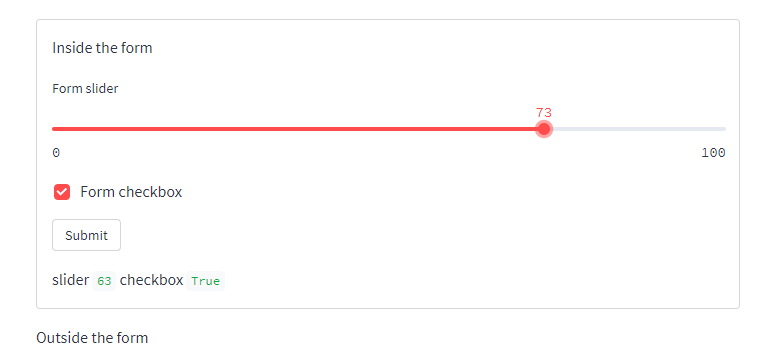
表单:form
这里的表单自带一个提交按钮,其它按钮不能添加到表单内部。
import streamlit as st

with st.form("my_form"):
   st.write("Inside the form")
   slider_val = st.slider("Form slider")
   checkbox_val = st.checkbox("Form checkbox")# Every form must have a submit button.
   submitted = st.form_submit_button("Submit")if submitted:
       st.write("slider", slider_val,"checkbox", checkbox_val)

st.write("Outside the form")
通用组件:Utilities
设置页面基本配置:set_page_config
这里可以设置页面的标题、图标,菜单信息
import streamlit as st

st.set_page_config(
    page_title="Ex-stream-ly Cool App",
    page_icon="🧊",
    layout="wide",
    initial_sidebar_state="expanded",
    menu_items={'Get Help':'https://www.extremelycoolapp.com/help','Report a bug':"https://www.extremelycoolapp.com/bug",'About':"# This is a header. This is an *extremely* cool app!"})
除了这个比较实用之外,这个模块包含了代码执行模块
st.echo
、显示函数帮助模块
st.help
等鸡肋模块,用处不大,暂且不表。
缓存:cache
缓存主要用来解决两个问题:
- 长时间运行的函数重复运行,这会减慢应用程序。
- 对象被重复创建,这使得它们很难在重新运行或会话中持久化。
在老版本的Streamlit中,缓存均通过装饰器
st.cache
来实现。
在新版本中,缓存分成了两个装饰器
st.cache_data
和
st.cache_resource
缓存数据:cache_data
cache_data
适合返回DataFrames、NumPy 数组、str、int、float或者其他可序列化类型的函数。
比如,这里有个函数需要下载数据集:
@st.cache_datadefload_data(url):
    df = pd.read_csv(url)# 👈 Download the datareturn df

df = load_data("https://github.com/plotly/datasets/raw/master/uber-rides-data1.csv")
st.dataframe(df)

st.button("Rerun")
没有加
@st.cache_data
之前,每次运行都需要联网下载数据集,添加之后,只需要第一次运行去下载,之后,会将数据集序列化之后,存到缓存中,后续运行则可以直接读取缓存。
缓存资源:cache_resource
缓存资源通常作用于缓存数据库连接和 ML 模型这类全局可用的资源。
当函数的返回值不需要是可序列化的,比如数据库连接、文件句柄或线程,此时无法用cache_data,只能用cache_resource。
示例,缓存数据库连接:
@st.cache_resourcedefinit_connection():
    host ="hh-pgsql-public.ebi.ac.uk"
    database ="pfmegrnargs"
    user ="reader"
    password ="NWDMCE5xdipIjRrp"return psycopg2.connect(host=host, database=database, user=user, password=password)

conn = init_connection()
接口-内嵌Html
Streamlit预留了
st.components.v1.html
这个接口,可以解析html数据。
比如,可以通过这个接口,来内嵌b站视频iframe。
import streamlit.components.v1 as components

components.html("""
    <iframe src="//player.bilibili.com/player.html?aid=993781570&bvid=BV1fx4y1P7RA&cid=1061322233&page=1" scrolling="no" border="0" frameborder="no" framespacing="0" allowfullscreen="true"> </iframe>
    """,
    height=600,)
总结
Streamlit就像是Markdown,不能指望它完全替代前端,来为生产项目提供服务。但是很大程度上简化了网页编辑操作,让构建一个简单网页的成本大大降低。
版权归原作者 zstar-_ 所有, 如有侵权,请联系我们删除。