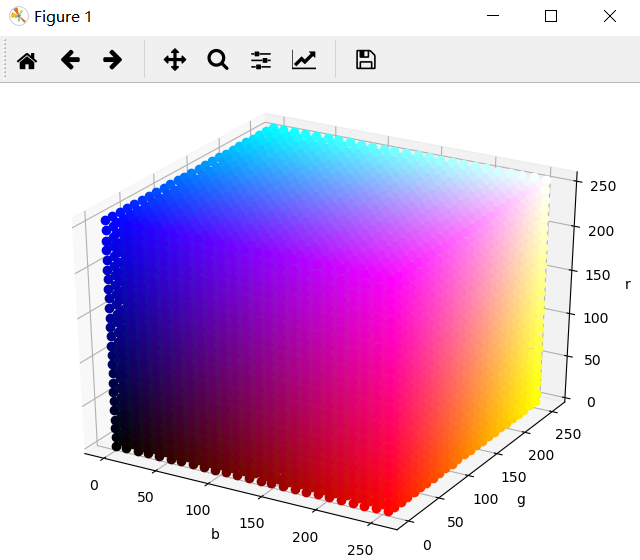
原文链接: python plt 画三维 rgb色谱图
上一篇: js 列表过滤 迭代器 优化
下一篇: urllib 中文处理 url 带中文参数 转码


import matplotlib.pyplot as plt
import numpy as np
from mpl_toolkits.mplot3d import Axes3D

fig = plt.figure()  # 定义新的三维坐标轴
ax = Axes3D(fig)

size = 25
points = np.linspace(0, 255, size).astype(np.int32)

for x in points:
    for y in points:
        for z in points:
            ax.plot([x], [y], [z], "ro", color=(x / 255, y / 255, z / 255, 1))
print('---')
ax.set_zlabel('r')
ax.set_ylabel('g')
ax.set_xlabel('b')
plt.show()
本文转载自: https://blog.csdn.net/qq_35516360/article/details/122065547
版权归原作者 阿豪boy 所有, 如有侵权,请联系我们删除。
版权归原作者 阿豪boy 所有, 如有侵权,请联系我们删除。