
一些离大谱的绘图小技巧,部分内容来自https://undocumentedmatlab.com/
更改3D坐标区轴位置
对于
hAxes=gca
- hAxes.XRuler.FirstCrossoverValue X轴在Y轴上的位置
- hAxes.XRuler.SecondCrossoverValue X轴在Z轴上的位置
- hAxes.YRuler.FirstCrossoverValue Y轴在X轴上的位置
- hAxes.YRuler.SecondCrossoverValue Y轴在Z轴上的位置
- hAxes.ZRuler.FirstCrossoverValue Z轴在X轴上的位置
- hAxes.ZRuler.SecondCrossoverValue Z轴在Y轴上的位置
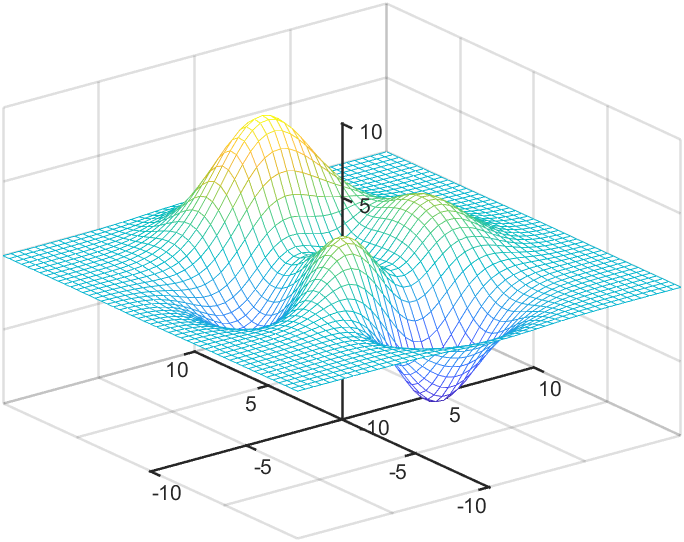
一个实例:
N=49;X=linspace(-10,10,N);Z=peaks(N);mesh(X,X,Z);

hAxes=gca;hAxes.LineWidth=1.5;hAxes.XRuler.FirstCrossoverValue=0;%X轴在Y轴上的位置
hAxes.YRuler.FirstCrossoverValue=0;%Y轴在X轴上的位置
hAxes.ZRuler.FirstCrossoverValue=0;%Z轴在X轴上的位置
hAxes.ZRuler.SecondCrossoverValue=0;%Z轴在Y轴上的位置
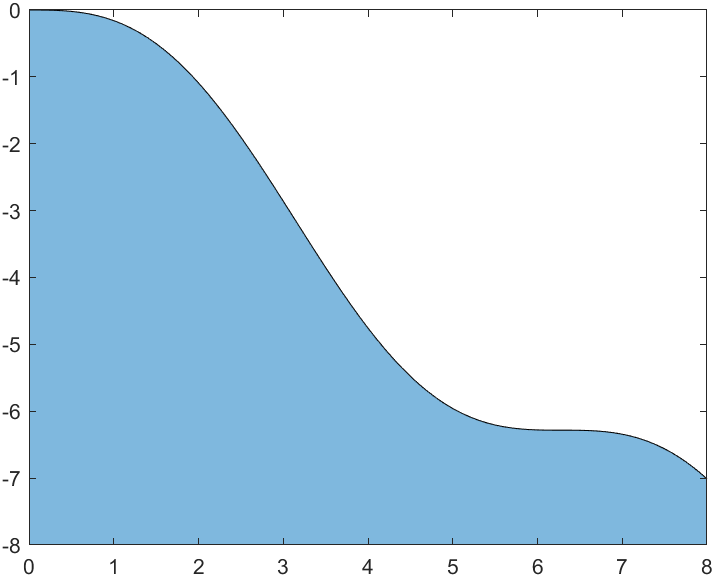
无穷基线
基线不仅可以设置为0或者其他有限数,甚至可以设置为正负无穷:
x=0:.1:8;
y=sin(x)-x;area(x,y,'FaceAlpha',.5,'BaseValue',-inf)
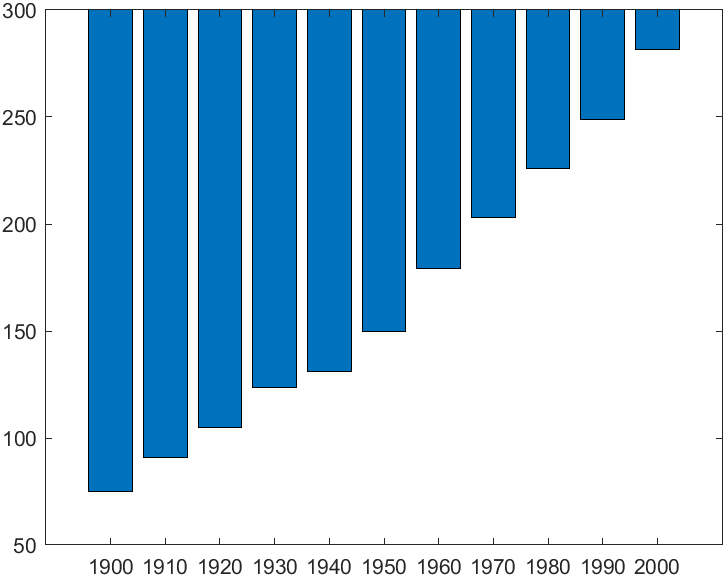
x=1900:10:2000;
y=[7591105123.5131150179203226249281.5];bar(x,y,'BaseValue',inf)
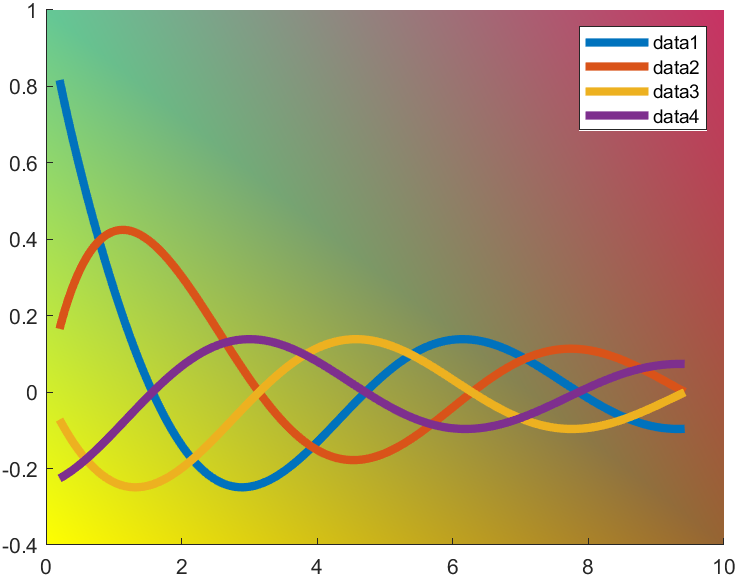
修改坐标区域背景
我们知道可以通过设置
set(gca,'Color',[1,0,0])
类似的形式设置背景颜色,但这只是纯色,那么有啥办法把背景色换成渐变色?
t=0.2:0.01:3*pi;

hold on
plot(t,cos(t)./(1+t),'LineWidth',4)plot(t,sin(t)./(1+t),'LineWidth',4)plot(t,cos(t+pi/2)./(1+t+pi/2),'LineWidth',4)plot(t,cos(t+pi)./(1+t+pi),'LineWidth',4)
legend

ax=gca;pause(1e-16);%Backdrop建立需要一定时间因此pause一下很重要
% 四列分别为四个角的颜色
% 使用4xN大小颜色矩阵
% 四行分别是R,G,B,和透明度
colorData =uint8([255,150,200,100;...255,100,50,200;...0,50,100,150;...102,150,200,50]);set(ax.Backdrop.Face, 'ColorBinding','interpolated','ColorData',colorData);
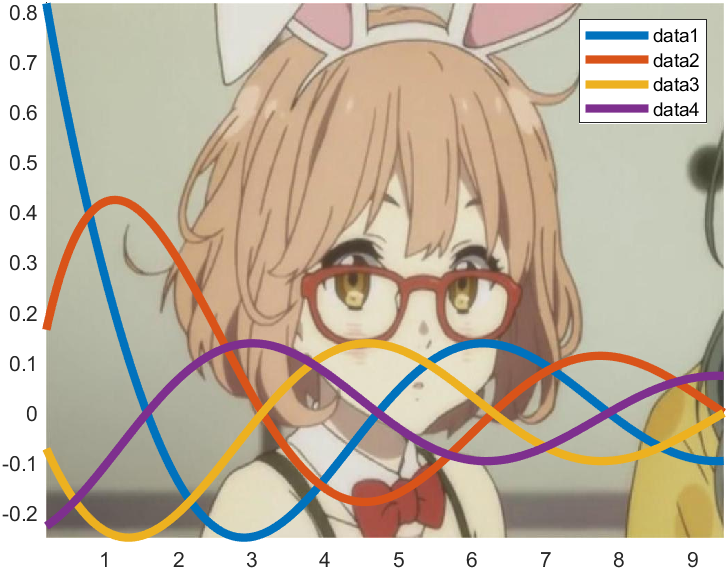
修改背景为图片
t=0.2:0.01:3*pi;

hold on
plot(t,cos(t)./(1+t),'LineWidth',4)plot(t,sin(t)./(1+t),'LineWidth',4)plot(t,cos(t+pi/2)./(1+t+pi/2),'LineWidth',4)plot(t,cos(t+pi)./(1+t+pi),'LineWidth',4)
legend

axis tight;
img=imread('test.png');
h=image(xlim,ylim,flipud(img));uistack(h,'bottom')
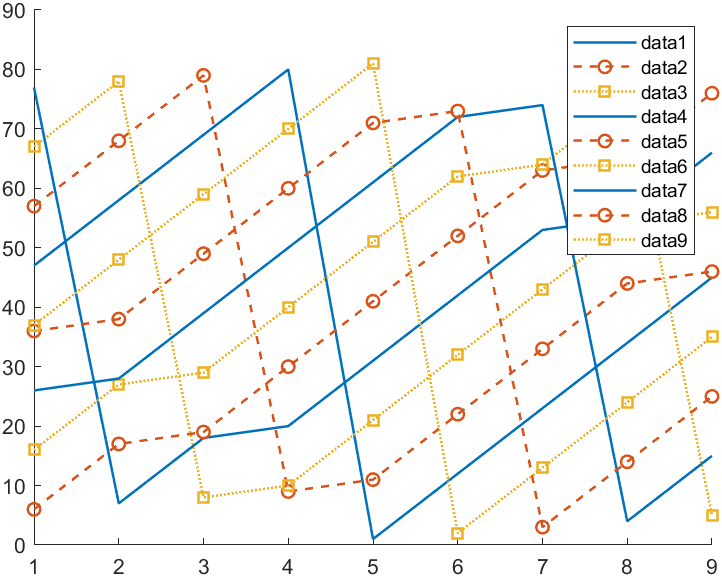
循环颜色和线形
ax=gca;hold on
m=magic(9);ax.ColorOrder=lines(3);ax.LineStyleOrder={'-','--o',':s'};

hold on
for i=1:9plot(m(i,:),'LineWidth',1.2)ax.LineStyleOrderIndex=ax.ColorOrderIndex;
end
legend
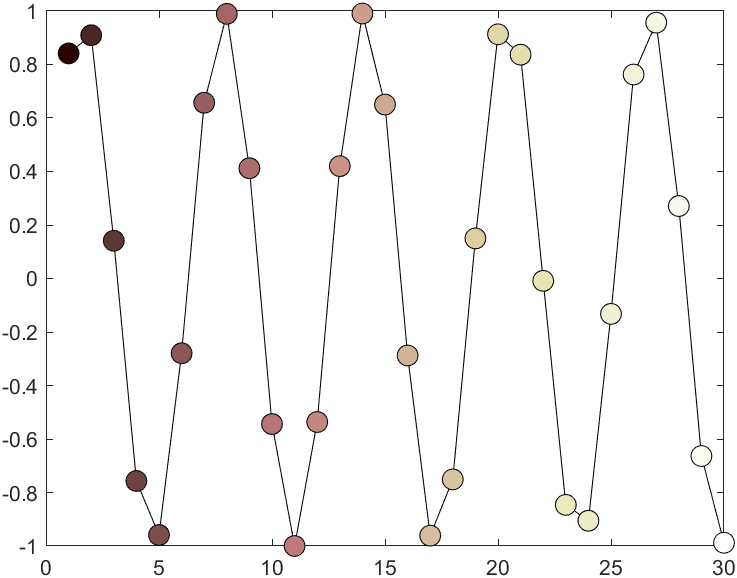
渐变marker
x=1:30;y=sin(x);
hLine=plot(x,y,'o-','MarkerSize',10,'Color',[0,0,0]);pause(1e-16)%MarkerHandle建立需要一定时间因此pause一下很重要
hMarkers=hLine.MarkerHandle;
markerNum=size(hMarkers.VertexData,2);% 这里用的pink配色,可以换成其他colormap
colorData=uint8([(pink(markerNum).*255)';255.*ones(1,markerNum)]);set(hMarkers,'FaceColorBinding','interpolated','FaceColorData',colorData)
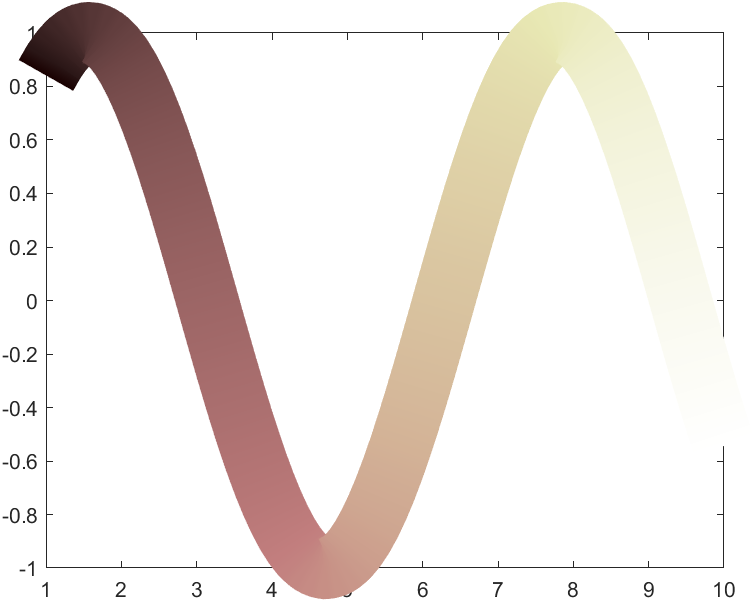
渐变折线图
x=1:.1:10;y=sin(x);
hLine=plot(x,y,'-','LineWidth',30);

colorNum=length(hLine.XData);% 这里用的pink配色,可以换成其他colormap
% 最后面透明度用的200可调整
colorData=uint8([(pink(colorNum).*255)';200.*ones(1,colorNum)]);pause(1e-16)%MarkerHandle建立需要一定时间因此pause一下很重要
set(hLine.Edge,'ColorBinding','interpolated', 'ColorData',colorData)
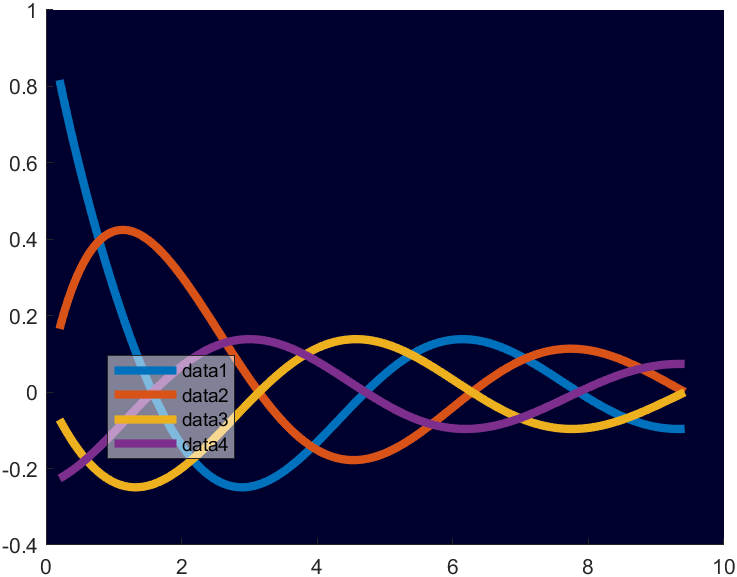
半透明及渐变图例
t=0.2:0.01:3*pi;

hold on
plot(t,cos(t)./(1+t),'LineWidth',4)plot(t,sin(t)./(1+t),'LineWidth',4)plot(t,cos(t+pi/2)./(1+t+pi/2),'LineWidth',4)plot(t,cos(t+pi)./(1+t+pi),'LineWidth',4)
hLegend=legend();% 设置图例为半透明
pause(1e-16)set(hLegend.BoxFace,'ColorType','truecoloralpha','ColorData',uint8(255*[1;1;1;.5]));set(gca,'Color',[0,0,.18]);
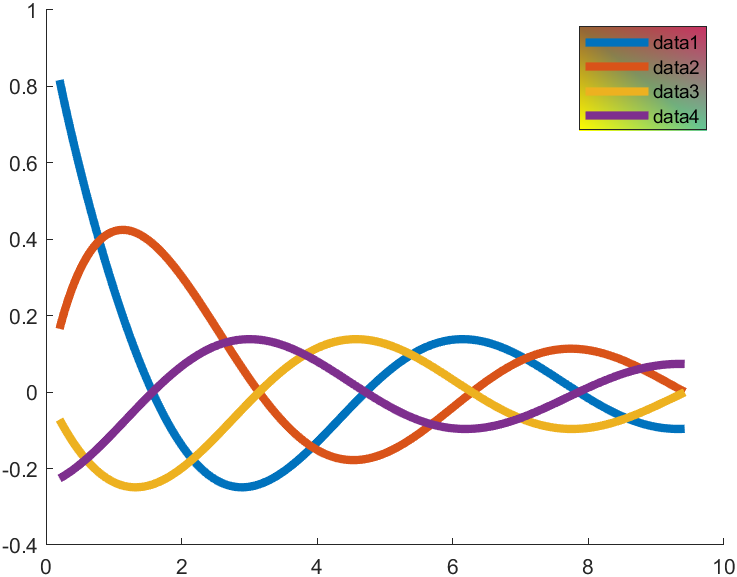
当然也可以花里胡哨:
t=0.2:0.01:3*pi;
hold on
plot(t,cos(t)./(1+t),'LineWidth',4)plot(t,sin(t)./(1+t),'LineWidth',4)plot(t,cos(t+pi/2)./(1+t+pi/2),'LineWidth',4)plot(t,cos(t+pi)./(1+t+pi),'LineWidth',4)
hLegend=legend();% 设置图例为渐变色
pause(1e-16)
colorData =uint8([255,150,200,100;...255,100,50,200;...0,50,100,150;...102,150,200,50]);set(hLegend.BoxFace,'ColorBinding','interpolated','ColorData',colorData)
特殊marker
众所周知,在版本R2020b版本中,横线及竖线marker以及可以直接使用:
t=0:0.1:3*pi;
hold on
plot(t,cos(t),'-_')plot(t,t./8,'-|')
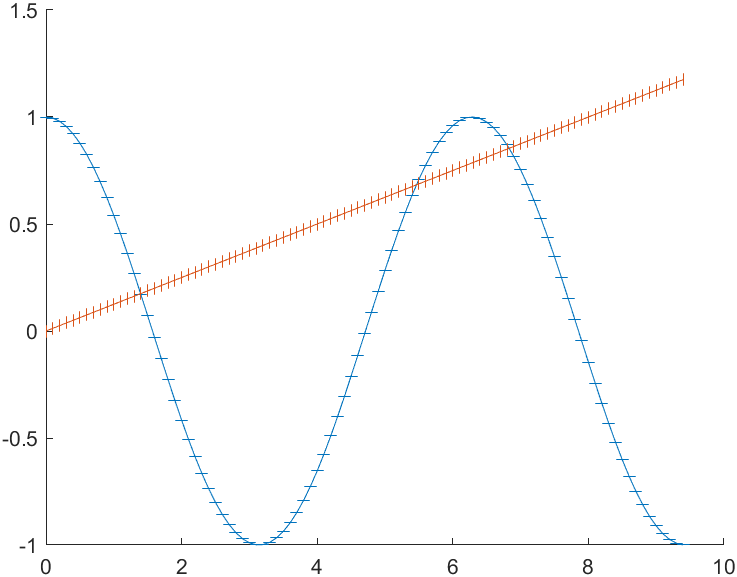
而在老版本,这俩marker可以这样调用出来:
t=0:0.1:3*pi;
hold on
hLine1=plot(t,cos(t),'-o');
hLine2=plot(t,t./8,'-o');pause(1e-8)set(hLine1.MarkerHandle,'Style','hbar')set(hLine2.MarkerHandle,'Style','vbar')
等高线图保留小数位数
[X,Y,Z]= peaks;[c,h]=contourf(X,Y,Z,5,'ShowText','on');h.LevelList=round(h.LevelList,3);% 保留三位小数
clabel(c,h)
绘制结果: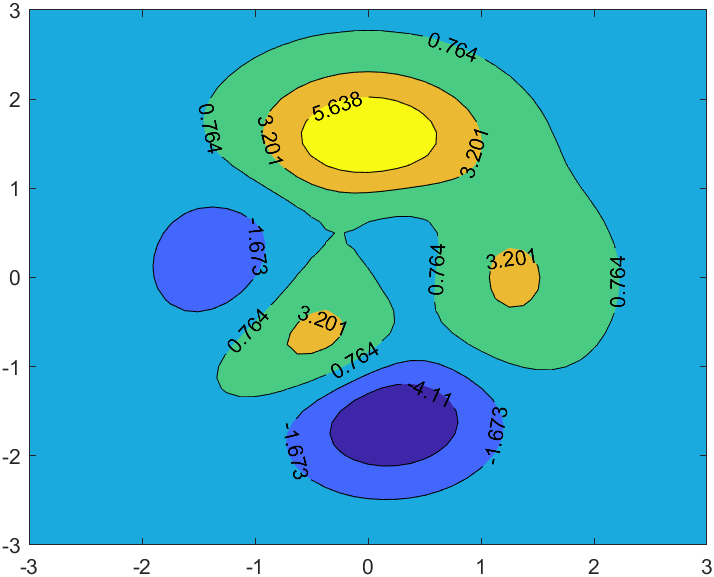
原始绘图: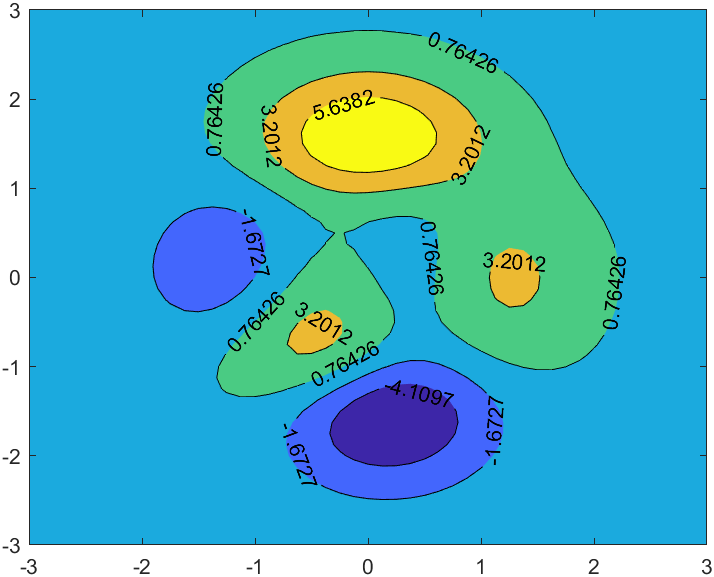
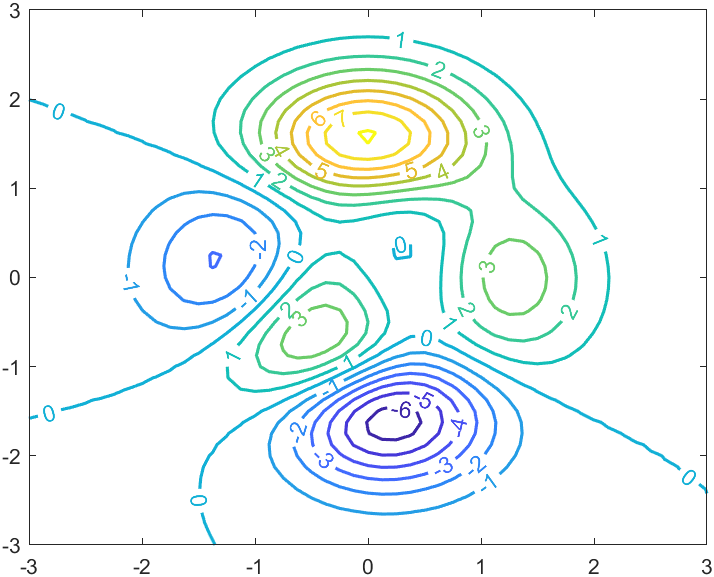
根据等高线颜色设置文本颜色
[X,Y,Z]= peaks;[C,hContour]=contour(X,Y,Z, 'ShowText','on', 'LevelStep',1, 'LineWidth',1.5);updateContours(hContour);% 因为标签位置是自动更新的属性,会刷新掉颜色,因此添加listener检测
addlistener(hContour, 'MarkedClean', @(h,e)updateContours(hContour));
function updateContours(hContour)
    drawnow
    levels =hContour.LevelList;
    labels =hContour.TextPrims;% 获取标签基础对象
    lines  =hContour.EdgePrims;% 获取边缘基础对象
    for idx =1:numel(labels)
        labelValue =str2double(labels(idx).String);
        lineIdx =find(abs(levels-labelValue)<10*eps,1);% 找到对应层级
        labels(idx).ColorData =lines(lineIdx).ColorData;% 修改标签颜色
        labels(idx).Font.Size =11;
    end
    drawnow
end
本文转载自: https://blog.csdn.net/slandarer/article/details/127027507
版权归原作者 slandarer 所有, 如有侵权,请联系我们删除。
版权归原作者 slandarer 所有, 如有侵权,请联系我们删除。