原文链接: node中的类似pandas 的库 danfo
上一篇: bluebirdjs 可以取消的promise
下一篇: ramda 数据流
https://github.com/opensource9ja/danfojs
https://segmentfault.com/a/1190000024534592
类似pandas的api, 将Python中的切片用数组和字符串代替, 用法也相似, 和tfjs可以配合使用 , 但是主要其实还是少一个numpyjs....
不会真有人觉得js能在ML上比得过C++和py吧... 玩一玩可以, 最多就是wasm+worker跑模型, 其他的就是玩具
浏览器中引入, windows上的安装还是有些问题, 直接使用cdn引入
<script src="https://cdn.jsdelivr.net/npm/[email protected]/dist/index.min.js"></script>
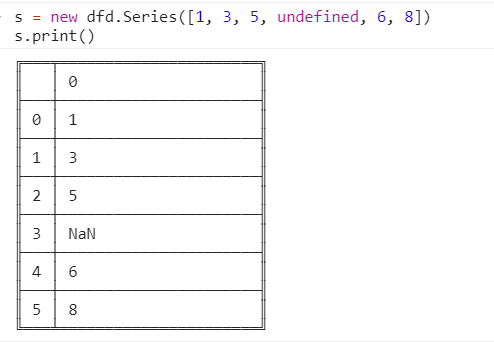
s = new dfd.Series([1, 3, 5, undefined, 6, 8])
s.print()

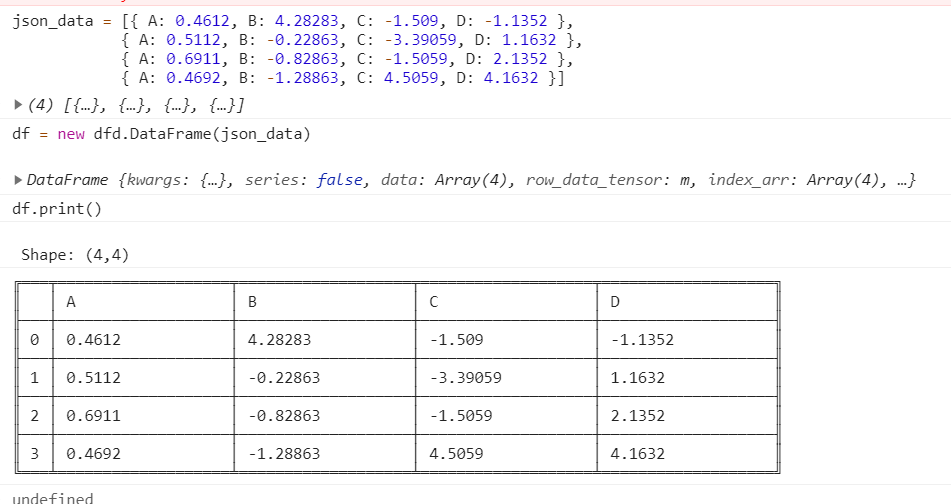
json_data = [{ A: 0.4612, B: 4.28283, C: -1.509, D: -1.1352 },
{ A: 0.5112, B: -0.22863, C: -3.39059, D: 1.1632 },
{ A: 0.6911, B: -0.82863, C: -1.5059, D: 2.1352 },
{ A: 0.4692, B: -1.28863, C: 4.5059, D: 4.1632 }]
df = new dfd.DataFrame(json_data)
df.print()

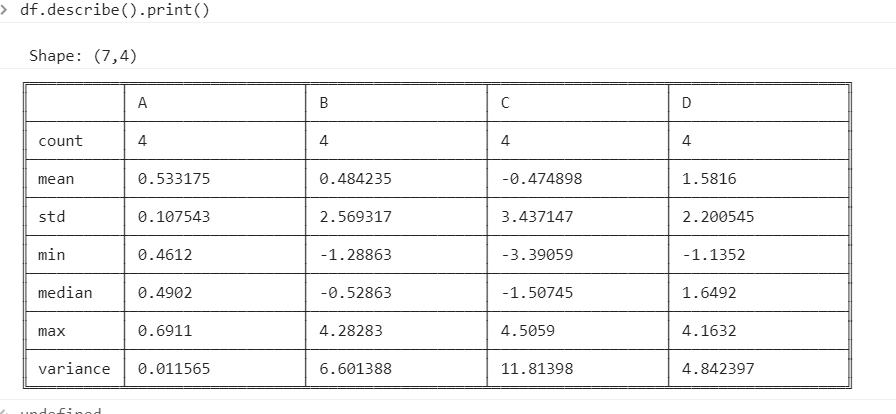
df.describe().print()

支持绘图, 并能动态的展示

<!DOCTYPE html>
<html lang="en">
  <head>
    <meta charset="utf-8" />
    <script src="https://cdn.jsdelivr.net/npm/[email protected]/dist/index.min.js"></script>
  <body>
    <div id="plot_div"></div>
    <script>
         dfd.read_csv("https://raw.githubusercontent.com/plotly/datasets/master/finance-charts-apple.csv")
            .then(df => {
                const layout = {
                    title: 'A financial charts',
                    xaxis: {
                        title: 'Date',
                    },
                    yaxis: {
                        title: 'Count',
                    }
                };
                const new_df = df.set_index({ key: "Date" })
                new_df.plot("plot_div").line({ columns: ["AAPL.Open", "AAPL.High"], layout: layout })
            }).catch(err => {
                console.log(err);
            })
    </script>
  </body>
</html>
版权归原作者 阿豪boy 所有, 如有侵权,请联系我们删除。