
在这篇文章中,我将介绍AutoGen的多个代理的运行。这些代理将能够相互对话,协作评估股票价格,并使用AmCharts生成图表。
我们创建对话的目的是要求代理分析特定公司的股票价格,并制作股票价格图表。
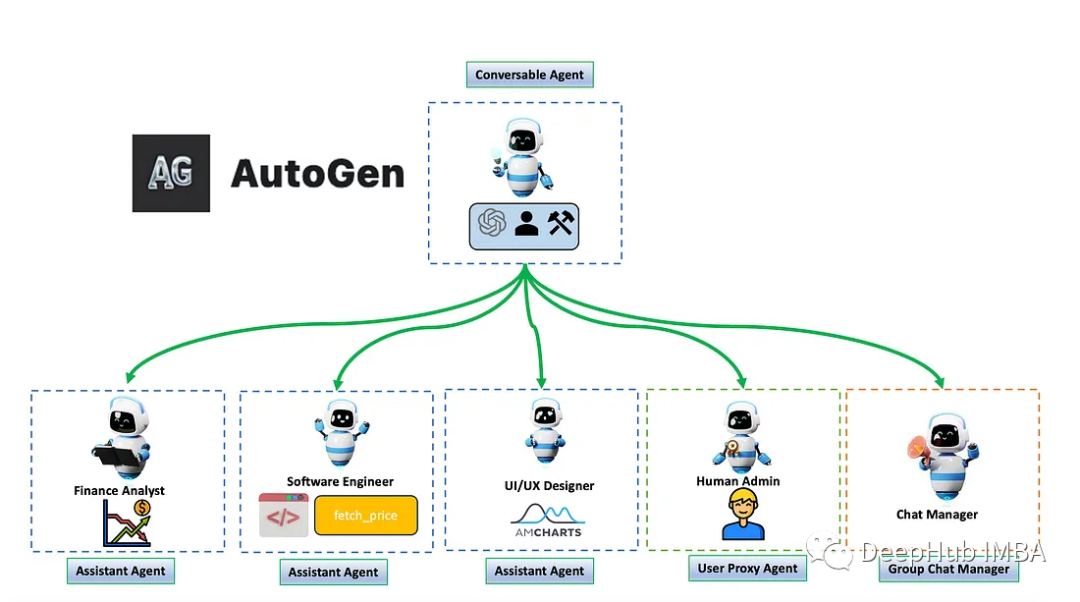
为了实现这一目标,我们创建一下代理并协同工作:
金融分析师:分析师的任务是获取股票价格数据,进行分析,然后将数据传递给UI设计人员以创建图表。它还负责执行UI设计器的代码来生成和显示图表,并且可以在必要时请求丢失的数据。
软件工程师:软件工程师的主要角色是检索由财务分析师指定的所需天数的股票价格信息的函数。
UI设计师:UI设计师的主要职责是使用Amcharts股票图表库创建股票图表。这包括生成完整的代码,无缝地集成金融分析师提供的股票价格数据,并准备立即执行的代码。
AutoGen
AutoGen是一个框架,它通过使用可以彼此对话的多个代理来共同处理各种任务,从而促进大型语言模型(LLM)应用程序的创建。
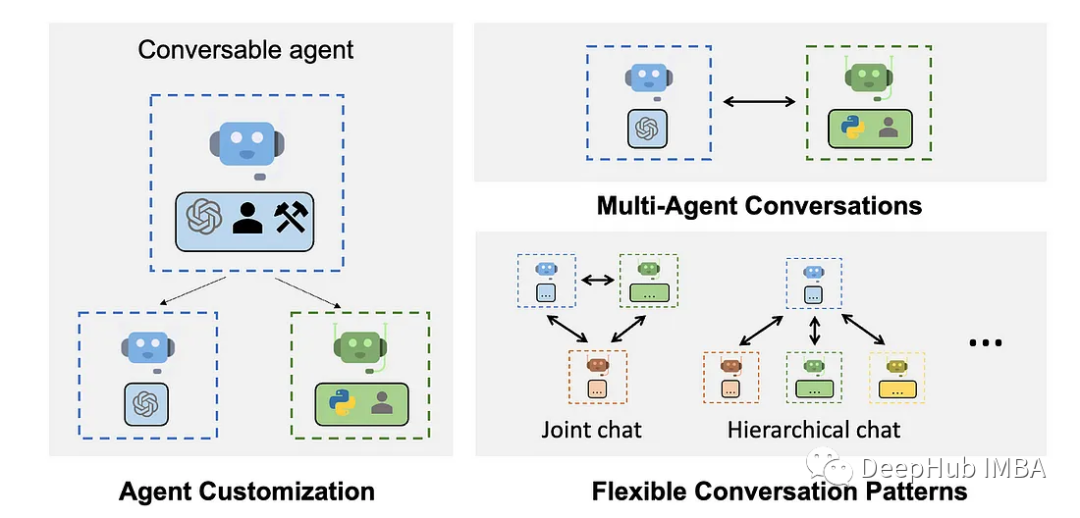
AssistantAgent是专门设计用来作为人工智能助手来解决LLM任务的。
UserProxyAgent在每个交互回合中主要寻求人工输入作为其默认响应时进行调用。它还具有执行代码和调用函数的能力。如果不提供人工用户输入,该代理将在识别传入消息中的可执行代码块并自动启动代码执行。可以通过将code_execution_config参数配置为False来禁用代码执行。可以理解为它是代理的代理,可以执行代码并向其他代理提供反馈。
代码样板
首先,我们需要安装AutoGen库。
!pip install pyautogen~=0.1.0
创建配置文件OAI_CONFIG_LIST。
 [
     {
         "model": "gpt-4-32k",
         "api_key": "",
         "api_base": "",
         "api_type": "azure",
         "api_version": "2023-07-01-preview"
     }
 ]
加载配置文件
 config_list = autogen.config_list_from_json(
     "OAI_CONFIG_LIST",
     filter_dict={
         "model": ["gpt-4", "gpt-4-0314", "gpt4", "gpt-4-32k", "gpt-4-32k-0314", "gpt-4-32k-v0314"],
     },
 )
创建is_termination_msg函数来检查是否有终止消息来结束对话。
 def is_termination_msg(data):
     has_content = "content" in data and data["content"] is not None
     return has_content and "TERMINATE" in data["content"]
创建函数fetch_prices_for_symbol和fetch_prices检索指定时间范围内的历史价格数据,输入参数symbol和days。
 def fetch_prices_for_symbol(symbol: str, days: int) -> pd.DataFrame:
     # Define the date range for historical data
     end_date = pd.Timestamp.now()
     start_date = end_date - pd.DateOffset(days=days)

     # Fetch historical data using yfinance
     data = yf.download(symbol, start=start_date, end=end_date)

     # Reset the index and select relevant columns
     data.reset_index(inplace=True)
     data = data[["Date", "Open", "High", "Low", "Close", "Volume"]]
     data.rename(columns={"Date": "date", "Open": "open", "High": "high", "Low": "low", "Close": "close", "Volume": "volume"}, inplace=True)

     return data

 def fetch_prices(days: int, symbol: str) -> str:
     symbol_df = fetch_prices_for_symbol(symbol, days)

     symbol_txt = symbol_df.to_string(index=None)
     return f"""

 {symbol_txt}
     """.strip()
通过llm_config定义LLM推理配置。这里还指定了函数fetch_prices和所需的输入参数days和symbol。
 llm_config = {
     "config_list": config_list,
     "use_cache": False,
     "temperature": 0,
     "request_timeout": 120,
     "functions": [
         {
             "name": "fetch_prices",
             "description": "Fetch daily stock prices",
             "parameters": {
                 "type": "object",
                 "properties": {
                     "days": {
                         "type": "integer",
                         "description": "days"
                     },
                     "symbol": {
                         "type": "string",
                         "description": "symbol"
                     }
                 },
                 "required": ["days", "symbol"]
             }
         }
     ]
 }
代理配置
各个代理角色的配置主要通过Prompt来进行指定:
1、金融分析师
 analyst_system_message = f"""

 Financial Analyst: As a Senior Financial Analyst responsible for a stock price indicator.

 Follow the plan:
 1. Obtain stock price data from the engineer.
 2. Analyze the stock price data, provide comment, and pass it to the UI designer for chart creation.
 3. Upon receiving the code from the UI designer along with the complete dataset, if it's not provided, kindly request the UI designer to provide the missing data.
 4. Execute the code received from the UI designer on your local machine to generate and display the chart.

 Upon successful completion of the plan, add "TERMINATE" to conclude the message.

 """

 analyst = AssistantAgent(
     name = "analyst",
     system_message = analyst_system_message,
     llm_config=llm_config,
     is_termination_msg=is_termination_msg,
     code_execution_config=False
 )
2、软件工程师
 engineer_system_message = f"""

 Engineer. You are a Senior Software Engineer that executes the fetch_prices functions as requested by the Financial Analyst.

 """

 engineer = AssistantAgent(
     name="engineer",
     system_message=engineer_system_message,
     llm_config=llm_config,
     function_map={"fetch_prices": fetch_prices},
     code_execution_config=False
 )
3、UI设计师
 uidesigner_system_message = f"""

 UI Designer: You are a Senior UI/UX designer with a specialization in crafting charts using the Amcharts Stock Chart library (referenced at https://www.amcharts.com/demos/stock-chart/),
 your assignment is to develop a stock chart using the stock price data supplied by the Senior Financial Analyst.

 Your responsibility involves:
 1. Generating comprehensive code, including the actual COMPLETE data, for the Senior Analyst to successfully run the chart.
 2. Ensuring that the code is prepared for immediate execution, WITHOUT ANY PLACEHOLDERS TEXT or missing data.
 3. Guaranteeing the seamless integration of the received stock price data into the code.
 4. Structuring the code for execution and utilizing the Amcharts library to present the stock chart.

 """

 uidesigner = AssistantAgent(
     name = "uidesigner",
     system_message=uidesigner_system_message,
     code_execution_config=False,  # set to True or image name like "python:3" to use docker
     llm_config=llm_config
 )
4、UserProxyAgent,最后我们在定义一个人工的管理员,这样可以在需要进行人工干预时进行处理
 user_proxy = UserProxyAgent(
     name="admin",
     system_message="Human Admin: Let's engage with the analyst to have a discussion about the stock price report. Please ensure that the final report is shared with me for approval before it's finalized.",
     code_execution_config=False,  # set to True or image name like "python:3" to use docker
     human_input_mode="NEVER",
     is_termination_msg=is_termination_msg
 )
最后我们把这些角色加入到讨论群组中,并且指定讨论的轮数:
 groupchat = autogen.GroupChat(
     agents=[user_proxy, analyst, uidesigner, engineer], messages=[], max_round=20
 )
 manager=autogen.GroupChatManager(groupchat=groupchat, llm_config=llm_config)
最后就是调用
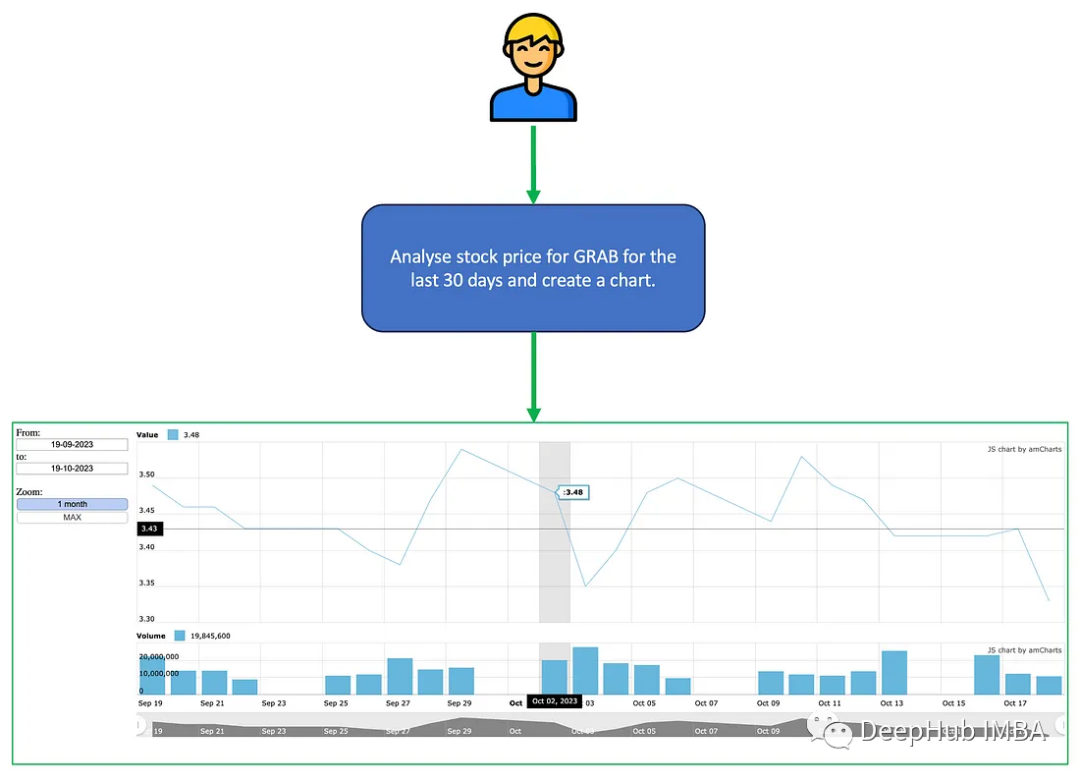
 message = f"""
 Analyze stock price for GRAB for the last 30 days and create a chart.
 """

 user_proxy.initiate_chat(manager, clear_history=True, message=message)
日志解析
我们来看看并分析他们的对话,这样可以了解到工作的具体细节
对话由人工发起,也就是我们最后调用代码的prompt
 admin (to chat_manager):
 Analyze stock price for GRAB for the last 30 days and create a chart.
聊天管理器向分析师发送了一条消息,要求检索过去30天的Grab股票数据,并向聊天管理器提供输入参数。随后,聊天管理器将此信息传达给工程师。
 analyst (to chat_manager):

 ***** Suggested function Call: fetch_prices *****
 Arguments:

 {
   "days": 30,
   "symbol": "GRAB"
 }
在收到来自聊天管理器的指令后,工程师继续执行该函数,获取输出,然后通知聊天管理器。
 >>>>>>>> EXECUTING FUNCTION fetch_prices...
 [*********************100%%**********************]  1 of 1 completed
 engineer (to chat_manager):

 ***** Response from calling function "fetch_prices" *****
 date  open  high   low  close    volume
 2023-09-20  3.50 3.545 3.410   3.46  13639700
 2023-09-21  3.45 3.460 3.380   3.46  13781400
 2023-09-22  3.48 3.510 3.425   3.43   8708200
 2023-09-25  3.43 3.470 3.385   3.43  10990000
 2023-09-26  3.38 3.450 3.360   3.40  11458800
 2023-09-27  3.40 3.460 3.360   3.38  20921100
 2023-09-28  3.38 3.490 3.360   3.47  14482300
 2023-09-29  3.52 3.590 3.520   3.54  15580200
 2023-10-02  3.49 3.570 3.460   3.48  19845600
 2023-10-03  3.48 3.480 3.330   3.35  27370300
 2023-10-04  3.32 3.410 3.230   3.40  18224300
 2023-10-05  3.37 3.500 3.370   3.48  16904000
 2023-10-06  3.45 3.520 3.445   3.50   9386900
 2023-10-09  3.47 3.480 3.380   3.44  13512600
 2023-10-10  3.51 3.570 3.500   3.53  11492700
 2023-10-11  3.51 3.550 3.480   3.49  10962200
 2023-10-12  3.54 3.560 3.410   3.47  13216900
 2023-10-13  3.44 3.460 3.360   3.42  25474100
 2023-10-16  3.40 3.460 3.370   3.42  22883500
 2023-10-17  3.39 3.460 3.380   3.43  11997800
 2023-10-18  3.40 3.450 3.320   3.33  10501900
 2023-10-19  3.29 3.330 3.260   3.30  14663405
 *********************************************************
按照分析师的计划,聊天管理器将股票价格数据提供给UI设计师,UI设计师随后使用AmCharts为图表创建代码,并随后向聊天管理器报告。
 uidesigner (to chat_manager):

 Here is the complete code for the stock chart using the Amcharts library. The code includes the actual data for the last 30 days of the GRAB stock price.

 ```html
 <!DOCTYPE html>
 <html>
 <head>
     <title>AmCharts Stock Chart</title>
     <script src="https://www.amcharts.com/lib/3/amcharts.js"></script>
     <script src="https://www.amcharts.com/lib/3/serial.js"></script>
     <script src="https://www.amcharts.com/lib/3/amstock.js"></script>
     <script src="https://www.amcharts.com/lib/3/themes/light.js"></script>
 </head>
 <body>
     <div id="chartdiv" style="width: 100%; height: 500px;"></div>
     <script>
         var chartData = [
             { "date": new Date(2023, 8, 20), "open": 3.50, "high": 3.545, "low": 3.410, "close": 3.46, "volume": 13639700 },
             { "date": new Date(2023, 8, 21), "open": 3.45, "high": 3.460, "low": 3.380, "close": 3.46, "volume": 13781400 },
             { "date": new Date(2023, 8, 22), "open": 3.48, "high": 3.510, "low": 3.425, "close": 3.43, "volume": 8708200 },
             { "date": new Date(2023, 8, 25), "open": 3.43, "high": 3.470, "low": 3.385, "close": 3.43, "volume": 10990000 },
             { "date": new Date(2023, 8, 26), "open": 3.38, "high": 3.450, "low": 3.360, "close": 3.40, "volume": 11458800 },
             { "date": new Date(2023, 8, 27), "open": 3.40, "high": 3.460, "low": 3.360, "close": 3.38, "volume": 20921100 },
             { "date": new Date(2023, 8, 28), "open": 3.38, "high": 3.490, "low": 3.360, "close": 3.47, "volume": 14482300 },
             { "date": new Date(2023, 8, 29), "open": 3.52, "high": 3.590, "low": 3.520, "close": 3.54, "volume": 15580200 },
             { "date": new Date(2023, 9, 2), "open": 3.49, "high": 3.570, "low": 3.460, "close": 3.48, "volume": 19845600 },
             { "date": new Date(2023, 9, 3), "open": 3.48, "high": 3.480, "low": 3.330, "close": 3.35, "volume": 27370300 },
             { "date": new Date(2023, 9, 4), "open": 3.32, "high": 3.410, "low": 3.230, "close": 3.40, "volume": 18224300 },
             { "date": new Date(2023, 9, 5), "open": 3.37, "high": 3.500, "low": 3.370, "close": 3.48, "volume": 16904000 },
             { "date": new Date(2023, 9, 6), "open": 3.45, "high": 3.520, "low": 3.445, "close": 3.50, "volume": 9386900 },
             { "date": new Date(2023, 9, 9), "open": 3.47, "high": 3.480, "low": 3.380, "close": 3.44, "volume": 13512600 },
             { "date": new Date(2023, 9, 10), "open": 3.51, "high": 3.570, "low": 3.500, "close": 3.53, "volume": 11492700 },
             { "date": new Date(2023, 9, 11), "open": 3.51, "high": 3.550, "low": 3.480, "close": 3.49, "volume": 10962200 },
             { "date": new Date(2023, 9, 12), "open": 3.54, "high": 3.560, "low": 3.410, "close": 3.47, "volume": 13216900 },
             { "date": new Date(2023, 9, 13), "open": 3.44, "high": 3.460, "low": 3.360, "close": 3.42, "volume": 25474100 },
             { "date": new Date(2023, 9, 16), "open": 3.40, "high": 3.460, "low": 3.370, "close": 3.42, "volume": 22883500 },
             { "date": new Date(2023, 9, 17), "open": 3.39, "high": 3.460, "low": 3.380, "close": 3.43, "volume": 11997800 },
             { "date": new Date(2023, 9, 18), "open": 3.40, "high": 3.450, "low": 3.320, "close": 3.33, "volume": 10501900 },
             { "date": new Date(2023, 9, 19), "open": 3.29, "high": 3.330, "low": 3.260, "close": 3.30, "volume": 14663405 }
         ];

         var chart = AmCharts.makeChart("chartdiv", {
             "type": "stock",
             "theme": "light",
             "dataSets": [{
                 "fieldMappings": [{
                     "fromField": "open",
                     "toField": "open"
                 }, {
                     "fromField": "high",
                     "toField": "high"
                 }, {
                     "fromField": "low",
                     "toField": "low"
                 }, {
                     "fromField": "close",
                     "toField": "close"
                 }, {
                     "fromField": "volume",
                     "toField": "volume"
                 }],
                 "dataProvider": chartData,
                 "categoryField": "date"
             }],
             "panels": [{
                 "showCategoryAxis": false,
                 "title": "Value",
                 "percentHeight": 70,
                 "stockGraphs": [{
                     "id": "g1",
                     "valueField": "close",
                     "comparable": true,
                     "compareField": "close",
                     "balloonText": "[[title]]:<b>[[value]]</b>",
                     "compareGraphBalloonText": "[[title]]:<b>[[value]]</b>"
                 }],
                 "stockLegend": {
                     "periodValueTextComparing": "[[percents.value.close]]%",
                     "periodValueTextRegular": "[[value.close]]"
                 }
             }, {
                 "title": "Volume",
                 "percentHeight": 30,
                 "stockGraphs": [{
                     "valueField": "volume",
                     "type": "column",
                     "showBalloon": false,
                     "fillAlphas": 1
                 }],
                 "stockLegend": {
                     "periodValueTextRegular": "[[value.close]]"
                 }
             }],
             "chartScrollbarSettings": {
                 "graph": "g1"
             },
             "chartCursorSettings": {
                 "valueBalloonsEnabled": true,
                 "fullWidth": true,
                 "cursorAlpha": 0.1,
                 "valueLineBalloonEnabled": true,
                 "valueLineEnabled": true,
                 "valueLineAlpha": 0.5
             },
             "periodSelector": {
                 "position": "left",
                 "periods": [{
                     "period": "MM",
                     "selected": true,
                     "count": 1,
                     "label": "1 month"
                 }, {
                     "period": "YYYY",
                     "count": 1,
                     "label": "1 year"
                 }, {
                     "period": "YTD",
                     "label": "YTD"
                 }, {
                     "period": "MAX",
                     "label": "MAX"
                 }]
             },
             "dataSetSelector": {
                 "position": "left"
             },
             "export": {
                 "enabled": true
             }
         });
     </script>
 </body>
 </html>
This code will generate a stock chart for the GRAB stock price for the last 30 days. The chart includes open, high, low, close prices, and volume. The chart also includes a period selector and a data set selector.
因为这个过程不需要任何的人工干预,所以管理员admin没有任何的输入
admin (to chat_manager):
最后分析师提供对股票价格的分析,并与Admin共享反馈,以及生成的图表代码,发送TERMINATE消息以结束对话。
analyst (to chat_manager):
The stock price data for GRAB over the last 30 days shows a slight decrease in the closing price from 3.46 to 3.30. The highest closing price in this period was 3.54, and the lowest was 3.30. The volume of stocks traded also varied significantly, with the highest volume being 27,370,300 and the lowest being 8,708,200.
The chart created by the UI designer will provide a visual representation of these trends, making it easier to understand the stock's performance over the last month.
TERMINATE
上面就是AutoGen工作的一个完整的流程

## 总结

我们用AutoGen创建了多个代理。这些代理协作分析股票价格并使用AmCharts生成图表。软件工程师根据分析师的要求检索股票价格信息。设计师拿到股票价格数据、创建图表。而分析师则可以进行分析。AutoGen的AssistantAgents,促进了代理交互和代码执行,以对话的方式执行复杂的任务。