
其中,TP表示正类数预测为正类数的个数;FP为负类数预测为正类数的个数;FN为正类数预测为负类数的个数;TN为负类数预测为负类数的个数。
附上python代码:
# coding=utf-8
import matplotlib.pyplot as plt
import numpy as np

confusion = np.array(([190,0,0,0,0,0,0,0,0,0,10,0,0,0,0],
                      [0,200,0,0,0,0,0,0,0,0,0,0,0,0,0],
                      [0,0,200,0,0,0,0,0,0,0,0,0,0,0,0],
                      [0,0,0,199,0,0,0,1,0,0,0,0,0,0,0],
                      [0,0,0,0,200,0,0,0,0,0,0,0,0,0,0],
                      [0,0,0,0,0,200,0,0,0,0,0,0,0,0,0],
                      [0,0,0,0,0,0,200,0,0,0,0,0,0,0,0],
                      [0,0,0,0,0,0,0,200,0,0,0,0,0,0,0],
                      [0,0,0,0,0,0,0,0,200,0,0,0,0,0,0],
                      [0,0,0,0,0,0,0,1,0,199,0,0,0,0,0],
                      [0,0,0,0,0,0,0,0,0,0,200,0,0,0,0],
                      [0,1,0,0,0,0,0,0,0,0,0,199,0,0,0],
                      [0,0,0,0,0,2,0,0,0,0,0,0,197,0,1],
                      [0,0,0,0,0,0,0,0,0,0,0,0,0,200,0],
                      [0,0,0,0,0,0,0,0,0,0,0,0,0,0,200]
                      ))
classes=['1','2','3','4','5','6','7','8','9','10','11','12','13','14','15']
#画出混淆矩阵
def confusion_matrix(confMatrix):
    # 热度图,后面是指定的颜色块,可设置其他的不同颜色
    plt.imshow(confMatrix, cmap=plt.cm.Blues)
    # ticks 坐标轴的坐标点
    # label 坐标轴标签说明
    indices = range(len(confMatrix))
    # 第一个是迭代对象,表示坐标的显示顺序,第二个参数是坐标轴显示列表
    # plt.xticks(indices, [0, 1, 2])
    # plt.yticks(indices, [0, 1, 2])
    plt.xticks(indices, classes,rotation=45)
    plt.yticks(indices, classes)

    plt.colorbar()

    plt.xlabel('预测值')
    plt.ylabel('真实值')
    plt.title('混淆矩阵')

    # plt.rcParams两行是用于解决标签不能显示汉字的问题
    plt.rcParams['font.sans-serif'] = ['SimHei']
    plt.rcParams['axes.unicode_minus'] = False

    # 显示数据
    for first_index in range(len(confMatrix)):  # 第几行
        for second_index in range(len(confMatrix[first_index])):  # 第几列
            if first_index==second_index:
                plt.text(first_index, second_index, confMatrix[first_index][second_index],va='center',ha='center',color='white')
            else:
                plt.text(first_index, second_index, confMatrix[first_index][second_index], va='center', ha='center')
    # 在matlab里面可以对矩阵直接imagesc(confusion)
    # 显示
    plt.show()

#计算准确率
def calculate_all_prediction(confMatrix):
    '''
    计算总精度,对角线上所有值除以总数
    :return:
    '''
    total_sum=confMatrix.sum()
    correct_sum=(np.diag(confMatrix)).sum()
    prediction=round(100*float(correct_sum)/float(total_sum),2)
    print('准确率:'+str(prediction)+'%')

def calculae_lable_prediction(confMatrix):
    '''
    计算每一个类别的预测精度:该类被预测正确的数除以该类的总数
    '''
    l=len(confMatrix)
    for i in range(l):
        label_total_sum = confMatrix.sum(axis=1)[i]
        label_correct_sum=confMatrix[i][i]
        prediction = round(100 * float(label_correct_sum) / float(label_total_sum), 2)
        print('精确率:'+classes[i]+":"+str(prediction)+'%')

def calculate_label_recall(confMatrix):
    l = len(confMatrix)
    for i in range(l):
        label_total_sum = confMatrix.sum(axis=0)[i]
        label_correct_sum = confMatrix[i][i]
        prediction = round(100 * float(label_correct_sum) / float(label_total_sum), 2)
        print('召回率:'+classes[i] + ":" + str(prediction) + '%')

confusion_matrix(confusion)
calculate_all_prediction(confusion)
calculae_lable_prediction(confusion)
calculate_label_recall(confusion)
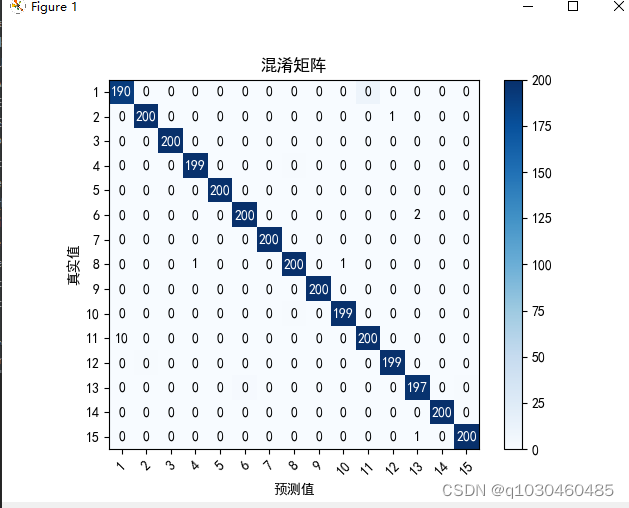
结果如图所示:

求得的精确率和召回率如下:
E:\pycharm_code\venv\Scripts\python.exe E:/pycharm_code/分割算法/Demo.py
精确率:1:95.0%
精确率:2:100.0%
精确率:3:100.0%
精确率:4:99.5%
精确率:5:100.0%
精确率:6:100.0%
精确率:7:100.0%
精确率:8:100.0%
精确率:9:100.0%
精确率:10:99.5%
精确率:11:100.0%
精确率:12:99.5%
精确率:13:98.5%
精确率:14:100.0%
精确率:15:100.0%
召回率:1:100.0%
召回率:2:99.5%
召回率:3:100.0%
召回率:4:100.0%
召回率:5:100.0%
召回率:6:99.01%
召回率:7:100.0%
召回率:8:99.01%
召回率:9:100.0%
召回率:10:100.0%
召回率:11:95.24%
召回率:12:100.0%
召回率:13:100.0%
召回率:14:100.0%
召回率:15:99.5%

Process finished with exit code 0
另外:
比如对A, B, C三类有如下混淆矩阵:
A B C
A 10 1 2
B 2 11 3
C 5 3 8
其中,行表示真值;列表示预测值。 此时,每一类都有自己的精准率和召回率。 精准率表示正确预测X占所有预测X的比例。
所以对于A类来说,Precision(A) = 10 / (10 + 2 + 5) = 10 / 17
所以对于B类来说,Precision(B) = 11 / (1 + 11 + 3) = 11 / 15
所以对于C类来说,Precision(C) = 8 / (2 + 3 + 8) = 8 / 13
召回率表示正确预测X占所有真实X的比例。
所以对于A类来说,Recall(A) = 10 / (10 + 1 + 2) = 10 / 13
所以对于B类来说,Recall(B) = 11 / (2 + 11 + 3) = 11 / 16
所以对于C类来说,Recall(C) = 8 / (5 + 3 + 8) = 8 / 16
在这个基础上,整个算法的精准率和召回率,可以简单地使用平均值法。
即: Precision = (Precision(A) + Precision(B) + Precision(C)) / 3 = 0.6457
Recall = (Recall(A) + Recall(B) + Recall(C)) / 3 = 0.6522
而准确率:
Accuracy = (所有正确识别的)/(所有样本总数)
下面这个代码也可以求混淆矩阵。
#coding=utf-8
import matplotlib.pyplot as plt
import numpy as np
from sklearn.metrics import confusion_matrix

save_flg = True

# confusion = confusion_matrix(y_test, y_pred)
confusion = np.array([[221,0,3,0],
                      [1,198,0,9],
                      [3,0,190,2],
                      [0,6,0,203]])

plt.figure(figsize=(5, 5))  #设置图片大小


# 1.热度图,后面是指定的颜色块,cmap可设置其他的不同颜色
plt.imshow(confusion, cmap=plt.cm.Blues)
plt.colorbar()   # 右边的colorbar


# 2.设置坐标轴显示列表
indices = range(len(confusion))
classes = ['白枯叶病', '褐斑病', '干尖线虫病', '稻瘟病']
# 第一个是迭代对象,表示坐标的显示顺序,第二个参数是坐标轴显示列表
plt.xticks(indices, classes, rotation=45) # 设置横坐标方向,rotation=45为45度倾斜
plt.yticks(indices, classes)


# 3.设置全局字体
# 在本例中,坐标轴刻度和图例均用新罗马字体['TimesNewRoman']来表示
# ['SimSun']宋体;['SimHei']黑体,有很多自己都可以设置
plt.rcParams['font.sans-serif'] = ['SimHei']
plt.rcParams['axes.unicode_minus'] = False


# 4.设置坐标轴标题、字体
# plt.ylabel('True label')
# plt.xlabel('Predicted label')
# plt.title('Confusion matrix')

plt.xlabel('真实值')
plt.ylabel('预测值')
plt.title('混淆矩阵', fontsize=12, fontfamily="SimHei")  #可设置标题大小、字体


# 5.显示数据
normalize = False
fmt = '.2f' if normalize else 'd'
thresh = confusion.max() / 2.

for i in range(len(confusion)):    #第几行
    for j in range(len(confusion[i])):    #第几列
        plt.text(j, i, format(confusion[i][j], fmt),
        fontsize=16,  # 矩阵字体大小
        horizontalalignment="center",  # 水平居中。
        verticalalignment="center",  # 垂直居中。
        color="white" if confusion[i, j] > thresh else "black")


#6.保存图片
# if save_flg:
#     plt.savefig("./picture/confusion_matrix.png")


# 7.显示
plt.show()
版权归原作者 q1030460485 所有, 如有侵权,请联系我们删除。