
NeuralProphet是一个python库,用于基于神经网络对时间序列数据进行建模。它建立在PyTorch之上,并受到Facebook Prophet和AR-Net库的极大启发。
NeuralProphet 和 Prophet对比
从库名称中,您可能会问Facebook的Prophet库和NeuralProphet之间的主要区别是什么。根据NeuralProphet的文档,增加的功能是[1]:
- 使用PyTorch的Gradient Descent进行优化,使建模过程比Prophet快得多
- 使用AR-Net建模时间序列自相关(也称为序列相关)
- 自定义损失和指标
- 具有前馈神经网络的可配置非线性层,
- 等等
项目维护者
基于该项目的GitHub页面,该项目的主要维护者是斯坦福大学的Oskar Triebe,Facebook和莫纳什大学的合作。
安装
该项目处于测试阶段,因此,如果您要在生产环境中使用此库,我建议您谨慎使用。
不幸的是,在撰写本文时,该库没有pip或conda软件包。只能通过克隆存储库并运行pip install。来安装它。但是,如果要在Jupyter Notebook环境中使用该软件包,则应安装其实时版本
pip install .
这将提供更多功能,例如使用plot_live_loss()实时训练和验证损失。
 git clone https://github.com/ourownstory/neural_prophet
 cd neural_prophet
 pip install .[live]
我建议创建一个新环境(conda或venv),并从新环境安装NeuralProphet软件包,让安装程序处理所有依赖项(它具有Pandas,Jupyter Notebook,PyTorch作为依赖项)。
现在我们已经安装了软件包,让我们开始吧!
案例分析实践
在这里,我使用在Kaggle上的2013年至2017年德里的每日气候数据。首先,让我们导入主要包。
 import pandas as pd
 from neuralprophet import NeuralProphet
然后,我们可以将数据读取到Panda DataFrame中。NeuralProphet对象期望时间序列数据具有一个名为ds的日期列,而我们希望将其预测为y。
 # Data is from https://www.kaggle.com/sumanthvrao/daily-climate-time-series-data
 df = pd.read_csv("./DailyDelhiClimateTrain.csv", parse_dates=["date"])
 df = df[["date", "meantemp"]]
 df.rename(columns={"date": "ds", "meantemp": "y"}, inplace=True)
现在,让我们初始化模型,为NeuralProphet对象定义的所有默认参数,包括有关某些参数的其他信息。这些是您可以在模型中配置的超参数。当然,如果您打算使用默认变量,则只需执行model = NeuralProphet()。
 # model = NeuralProphet() if you're using default variables below.
 model = NeuralProphet(
     growth="linear",  # Determine trend types: 'linear', 'discontinuous', 'off'
     changepoints=None, # list of dates that may include change points (None -> automatic )
     n_changepoints=5,
     changepoints_range=0.8,
     trend_reg=0,
     trend_reg_threshold=False,
     yearly_seasonality="auto",
     weekly_seasonality="auto",
     daily_seasonality="auto",
     seasonality_mode="additive",
     seasonality_reg=0,
     n_forecasts=1,
     n_lags=0,
     num_hidden_layers=0,
     d_hidden=None,     # Dimension of hidden layers of AR-Net
     ar_sparsity=None,  # Sparcity in the AR coefficients
     learning_rate=None,
     epochs=40,
     loss_func="Huber",
     normalize="auto",  # Type of normalization ('minmax', 'standardize', 'soft', 'off')
     impute_missing=True,
     log_level=None, # Determines the logging level of the logger object
 )
配置模型及其超参数后,我们需要训练模型并进行预测。让我们对温度进行一年的预测。
 metrics = model.fit(df, validate_each_epoch=True, freq="D")
 future = model.make_future_dataframe(df, periods=365, n_historic_predictions=len(df))
 forecast = model.predict(future)
您可以通过调用model.plot(forecast)来简单地绘制预测,如下所示:
 fig, ax = plt.subplots(figsize=(14, 10))
 model.plot(forecast, xlabel="Date", ylabel="Temp", ax=ax)
 ax.set_title("Mean Temperature in Delhi", fontsize=28, fontweight="bold")
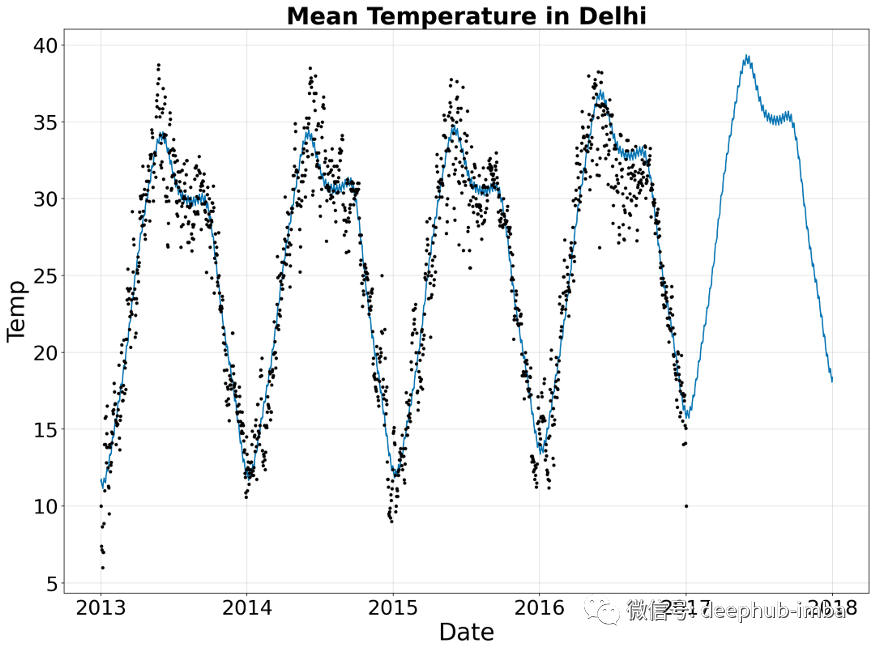
上面显示了一年的预测图,其中从2017-01-01到2018-01-01之间的时间段是预测。可以看出,预测图类似于历史时间序列。它既捕获了季节性,又捕获了线性趋势的缓慢增长。
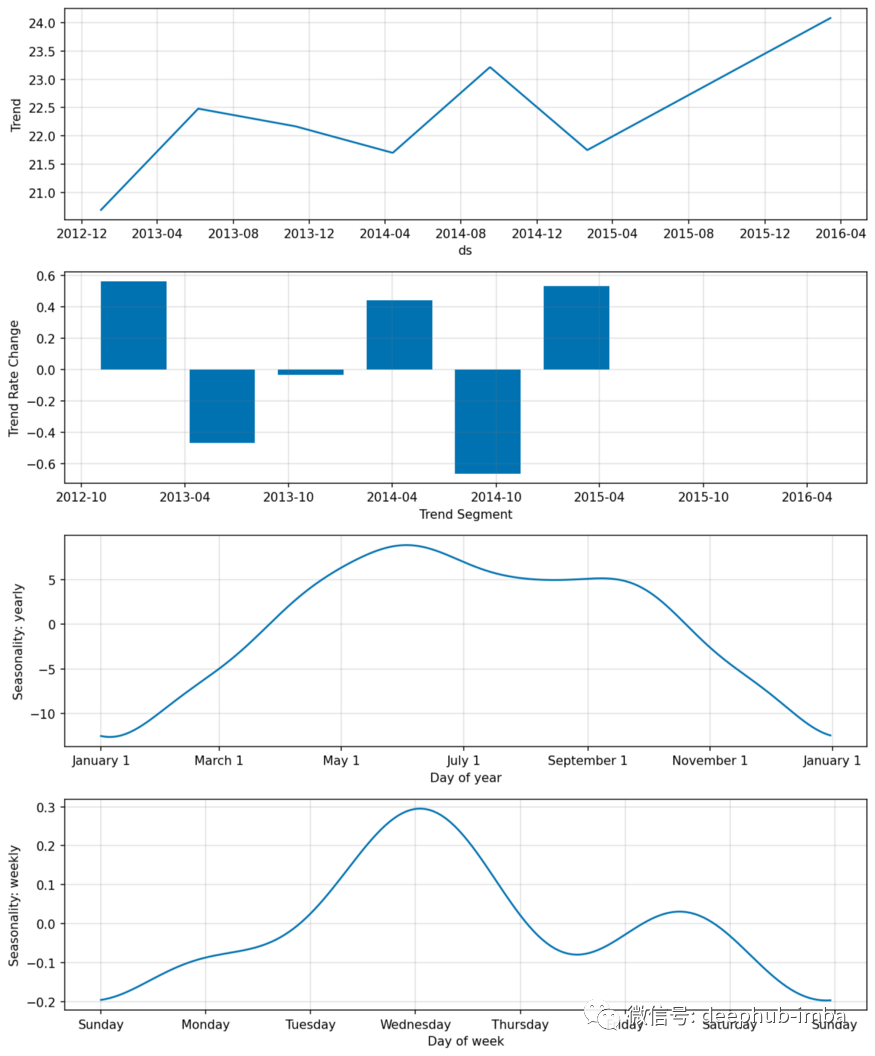
也可以通过调用model.plot_parameters()来绘制参数。
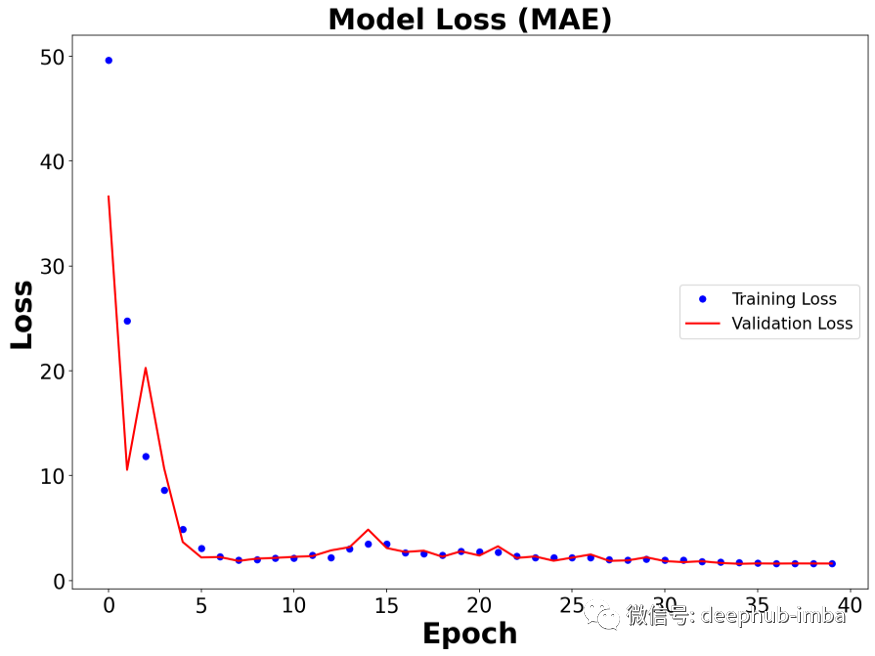
使用平均绝对误差(MAE)的模型损失如下图所示。您也可以使用“平滑的L1损失”功能。
 fig, ax = plt.subplots(figsize=(14, 10))
 ax.plot(metrics["MAE"], 'ob', linewidth=6, label="Training Loss")
 ax.plot(metrics["MAE_val"], '-r', linewidth=2, label="Validation Loss")
 # You can use metrics["SmoothL1Loss"] and metrics["SmoothL1Loss_val"] too.
总结
在本文中,我们讨论了NeuralProphet,这是一个基于神经网络对时间序列进行建模的python库。该库使用PyTorch作为后端。作为案例研究,我们为德里的每日气候时间序列数据创建了一个预测模型,并进行了一年的预测。使用此库的一个优点是其语法与Facebook的Prophet库类似。
您可以在GitHub上找到此博客文章的Jupyter笔记本。谢谢阅读!
https://github.com/e-alizadeh/medium/blob/master/notebooks/NeuralProphet/neural_prophet.ipynb
参考文献
[1] NeuralProphet
[2] O. J. Triebe et al, AR-Net: A Simple Auto-Regressive Neural Network For Time-Series, (2019)
[3] https://facebook.github.io/prophet/
[4] https://github.com/ourownstory/AR-Net
作者:Esmaeil Alizadeh
deephub翻译组