
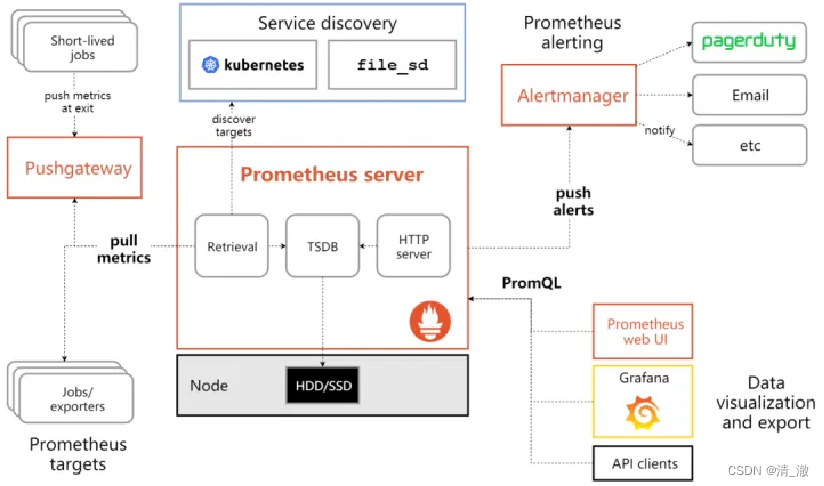
1.Prometheus环境搭建
1.1 下载和安装Prometheus
访问Prometheus官方网站(https://prometheus.io/download/),下载适合操作系统的Prometheus版本。解压下载的文件,将包含Prometheus二进制文件和配置文件的目录放在合适的位置。
1.2 配置Prometheus
在Prometheus的安装目录中,找到prometheus.yml配置文件。打开并编辑该文件,以配置Prometheus以抓取Spring Boot应用程序的指标数据。
1.3 配置Prometheus抓取Spring Boot应用Metrics
在prometheus.yml文件中,找到scrape_configs部分,并添加一个新的抓取配置,如下所示:
scrape_configs:
- job_name: 'spring_boot_app'
metrics_path: '/actuator/prometheus'
static_configs:
- targets: ['localhost:8080'] # 使用你的Spring Boot应用程序的实际主机和端口替换
在此配置中,我们指定了应用程序的/actuator/prometheus端点作为Prometheus抓取指标数据的路径。确保将targets中的localhost:8080替换为你的Spring Boot应用程序的实际主机名和端口号。
以下是我机器的实际配置:
# my global config

global:

  scrape_interval: 5s # Set the scrape interval to every 15 seconds. Default is every 1 minute.

  evaluation_interval: 5s # Evaluate rules every 15 seconds. The default is every 1 minute.

  # scrape_timeout is set to the global default (10s).

# Alertmanager configuration

alerting:

  alertmanagers:

    - static_configs:

        - targets:

          # - alertmanager:9093

# Load rules once and periodically evaluate them according to the global 'evaluation_interval'.

rule_files:

  # - "first_rules.yml"

  # - "second_rules.yml"

# A scrape configuration containing exactly one endpoint to scrape:

# Here it's Prometheus itself.

# scrape_configs:

  # The job name is added as a label `job=<job_name>` to any timeseries scraped from this config.

#   - job_name: "prometheus"

    # metrics_path defaults to '/metrics'

    # scheme defaults to 'http'.

#     static_configs:

 #      - targets: ["localhost:9090"]


scrape_configs:

  - job_name: 'springboot-69-8084'

    metrics_path: '/actuator/prometheus'

    static_configs:

      - targets: ['localhost:8084'] # 使用你的Spring Boot应用程序的实际主机和端口替换


  - job_name: 'springboot-69-8082'

    metrics_path: '/actuator/prometheus'

    static_configs:

      - targets: ['localhost:8082'] # 使用你的Spring Boot应用程序的实际主机和端口替换


  - job_name: 'springboot-69-8761'

    metrics_path: '/actuator/prometheus'

    static_configs:

      - targets: ['localhost:8761'] # 使用你的Spring Boot应用程序的实际主机和端口替换


  - job_name: "nacos_162_8848"

    metrics_path: '/actuator/prometheus'

    static_configs:

      - targets: ['192.168.3.162:8848']


  - job_name: "prometheus_162"

    static_configs:

      - targets: ["192.168.3.162:9090"]


  - job_name: "prometheus_69"

    static_configs:

      - targets: ["192.168.3.69:9090"]


  - job_name: "linux_exporter_162"

    metrics_path: '/metrics'

    static_configs:

      - targets: ["192.168.3.162:9100"]

  - job_name: order-jvm  #监控Job名称

    static_configs:

      - targets: ['localhost:8314']  #待监控机器列表,node exporter默认端口9100,多台机器用“,”分隔。
1.4 启动Prometheus
在Prometheus的安装目录中,使用命令行运行以下命令以启动Prometheus:
- 对于Linux/macOS:
./prometheus --config.file=prometheus.yml
- 对于Windows:
prometheus.exe --config.file=prometheus.yml
现在,Prometheus已经开始运行并监控你的Spring Boot应用程序的指标数据。接下来,需要安装和配置Grafana,以实现指标数据的可视化。
启动成功日志如下

浏览器访问: http://localhost:9090/targets?search=

2.Grafana环境搭建
2.1 下载和安装Grafana
访问Grafana官方网站(https://grafana.com/grafana/download/),下载适合你操作系统的Grafana版本。安装完成后,按照Grafana官方文档中的说明启动Grafana服务。
Windows版本,直接安装运行即可
grafana-enterprise-10.0.1.windows-amd64.msi
Linux版本:
sudo yum install -y https://dl.grafana.com/enterprise/release/grafana-enterprise-10.0.1-1.x86_64.rpm
修改配置文件 /etc/grafana/grafana.ini 中端口为3001,并重启
[root@grafana ~]# systemctl daemon-reload

[root@grafana ~]# systemctl start grafana-server

[root@grafana ~]# systemctl enable grafana-server

[root@grafana ~]# systemctl status grafana-server
浏览器访问:
http://192.168.3.162:3001/ admin / admin

2.2 配置Grafana数据源
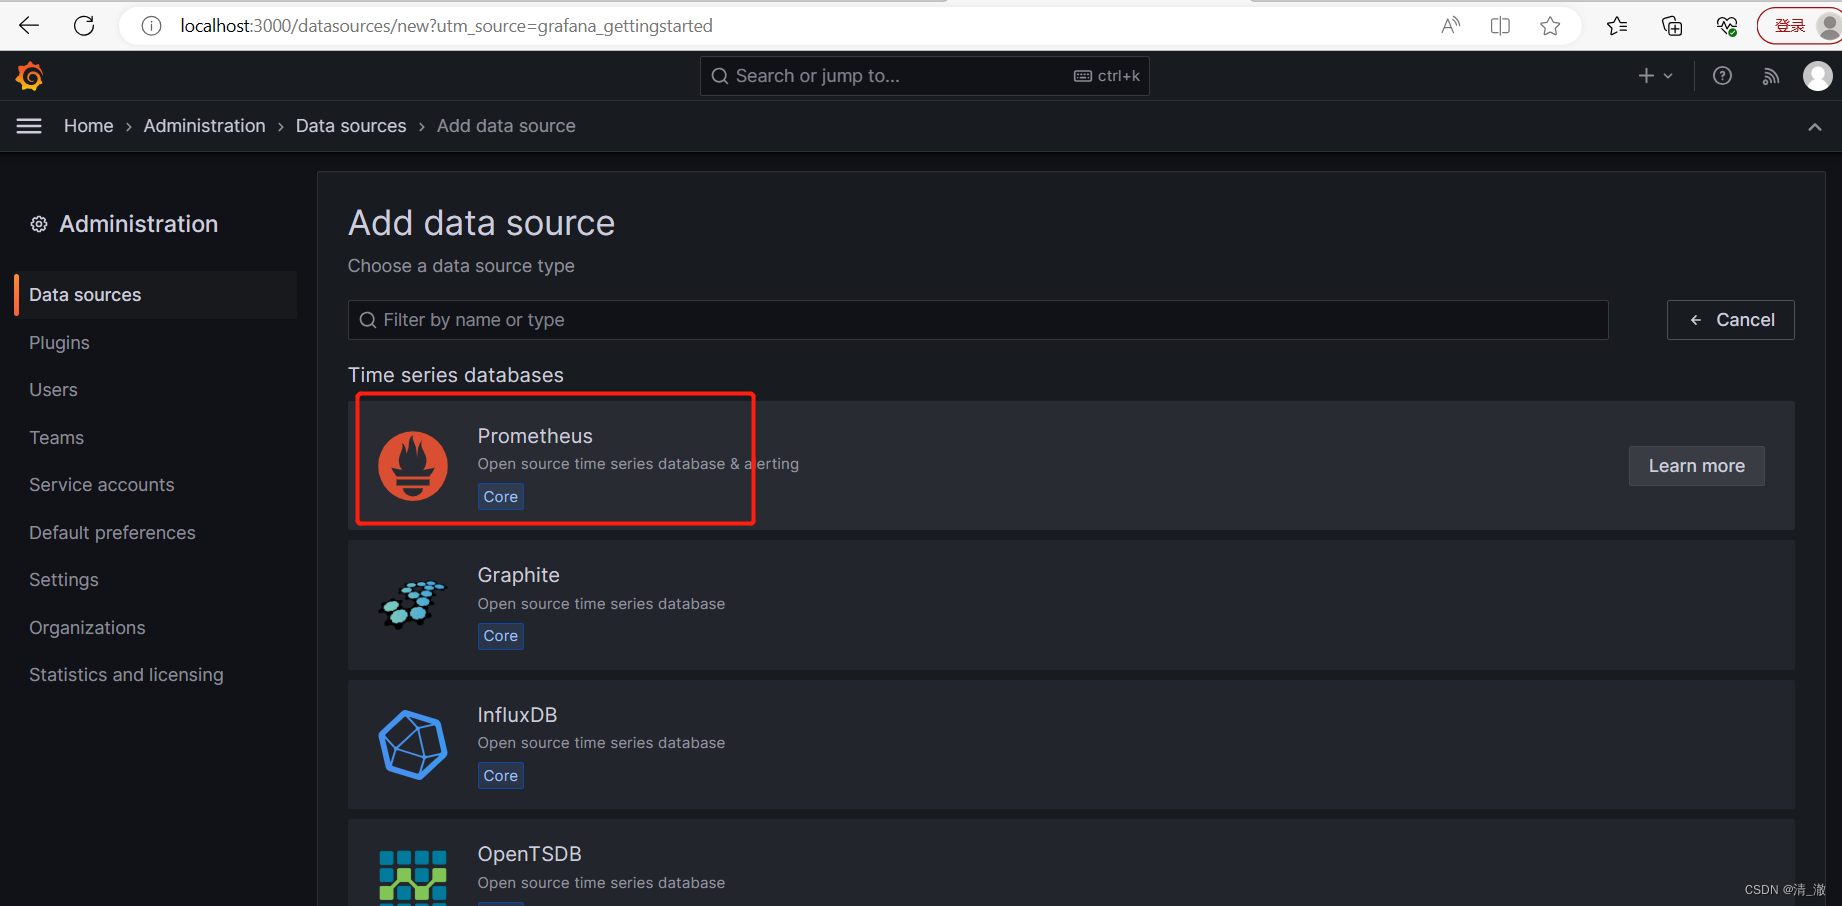
登录Grafana(默认用户名和密码均为admin),然后转到Configuration > Data Sources。点击Add data source,选择Prometheus作为数据源类型。
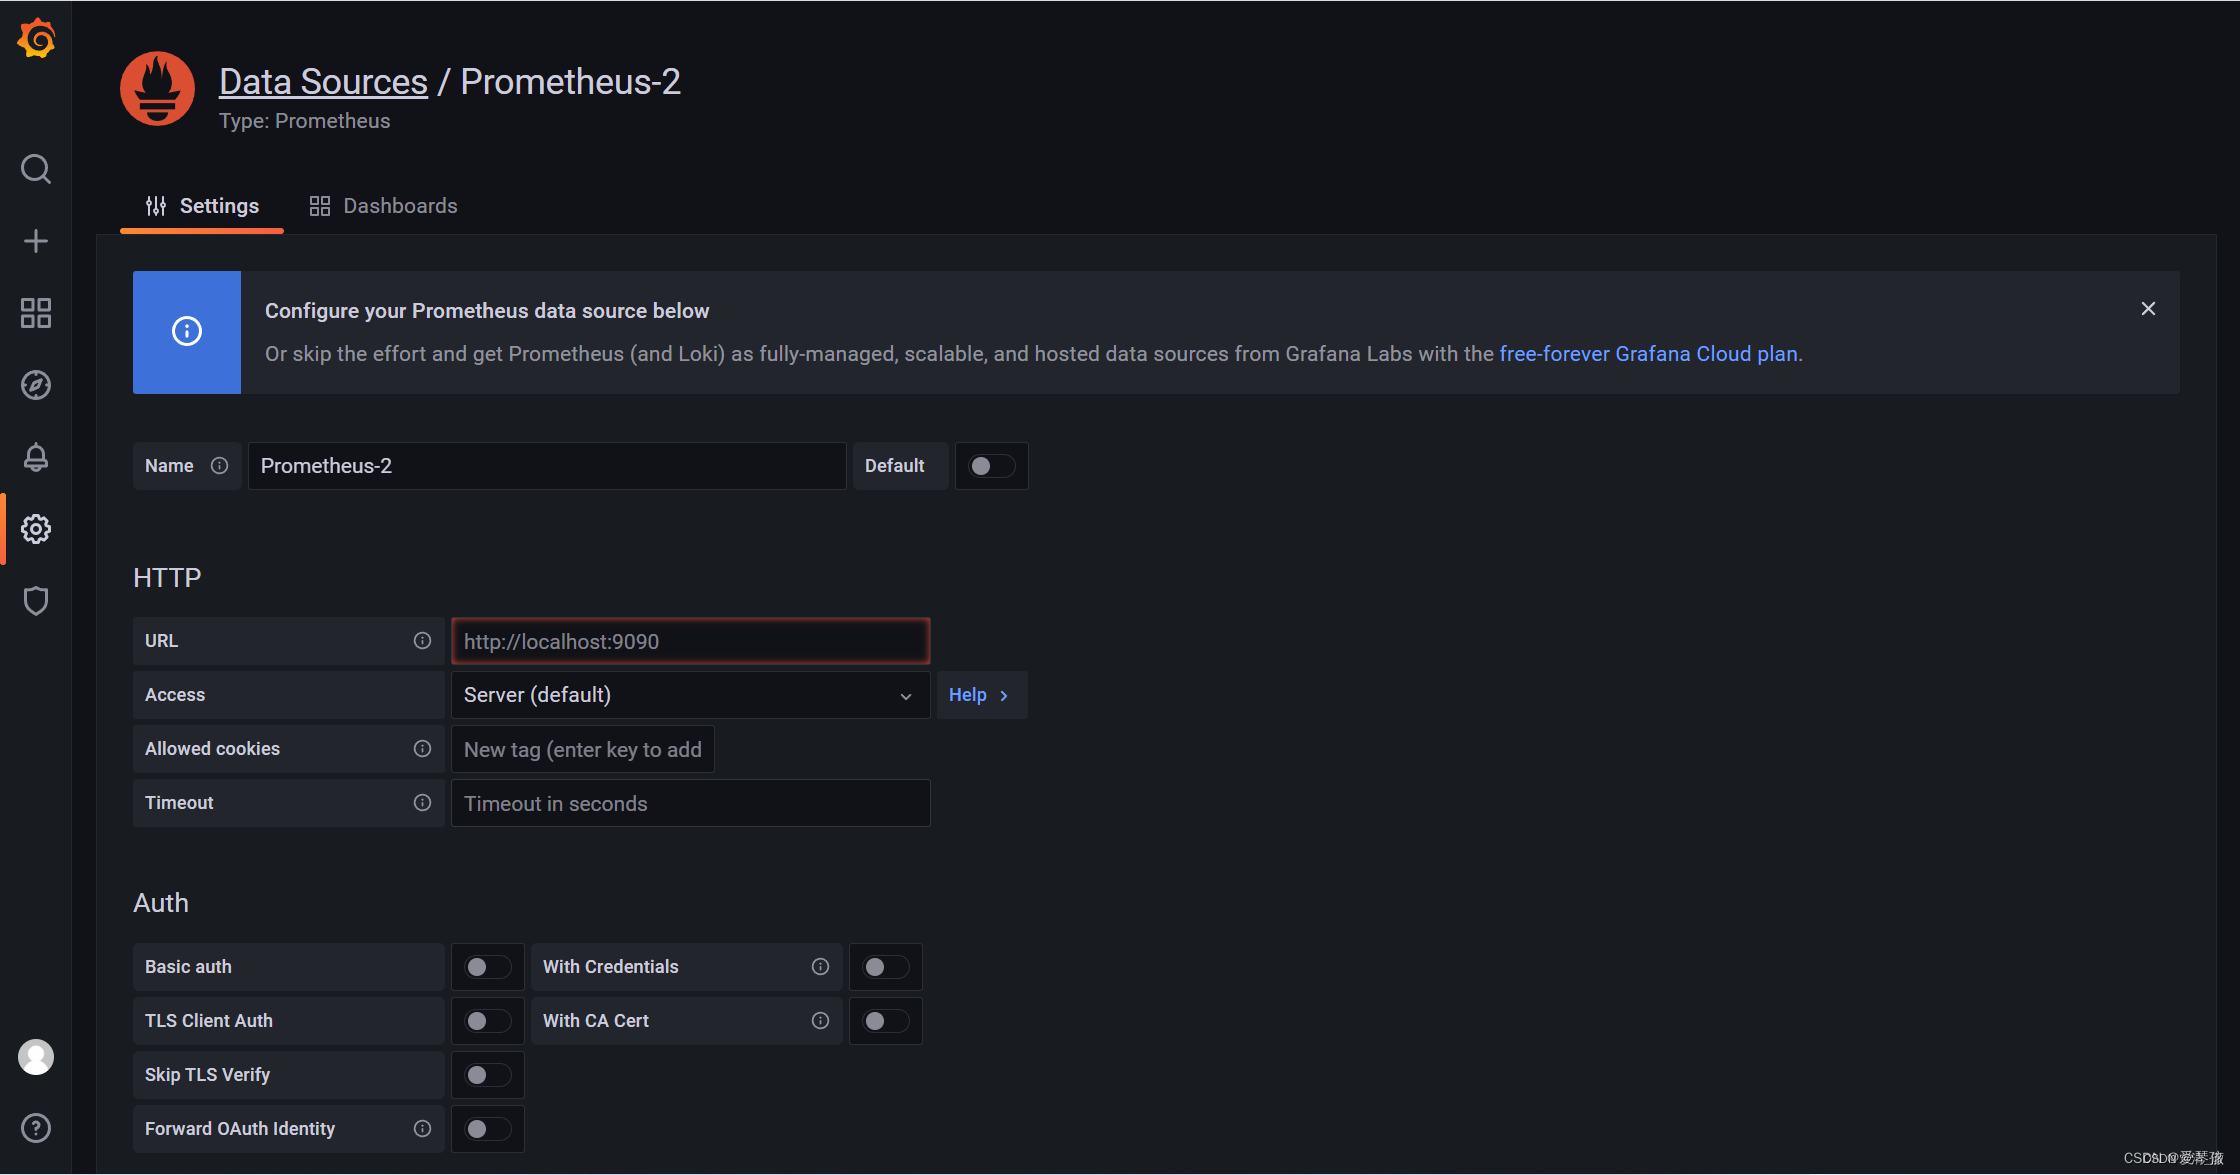
在URL字段中,输入Prometheus实例的地址(例如http://localhost:9090),然后将Access设置为Server。点击Save & Test按钮以测试和保存数据源配置。
2.3 创建Dashboard
完成数据源配置后,转到Dashboards > Manage,点击New dashboard按钮创建一个新的Dashboard。
在新的Dashboard中,点击Add new panel以添加图表。在图表编辑器中,你可以选择查询Prometheus数据源的指标数据。例如,要查看Spring Boot应用程序的HTTP请求数,可以输入以下PromQL查询:
rate(http_server_requests_seconds_count[1m])
3、NodeExporter(服务器监控)插件配置安装
3.1 下载和安装Node Exporter** 插件**
Node Exporter 安装及启动运行
https://github.com/prometheus/node_exporter/releases
tar zxvf node_exporter-1.6.0.linux-amd64.tar.gz
cd /usr/local/node_exporter-1.3.1.linux-amd64
nohup ./node_exporter --web.listen-address=":9100" &
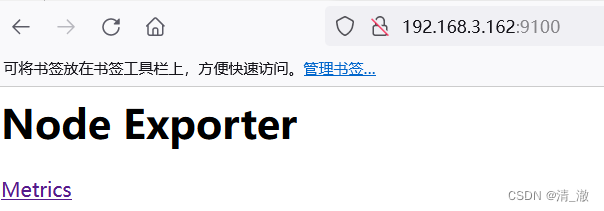
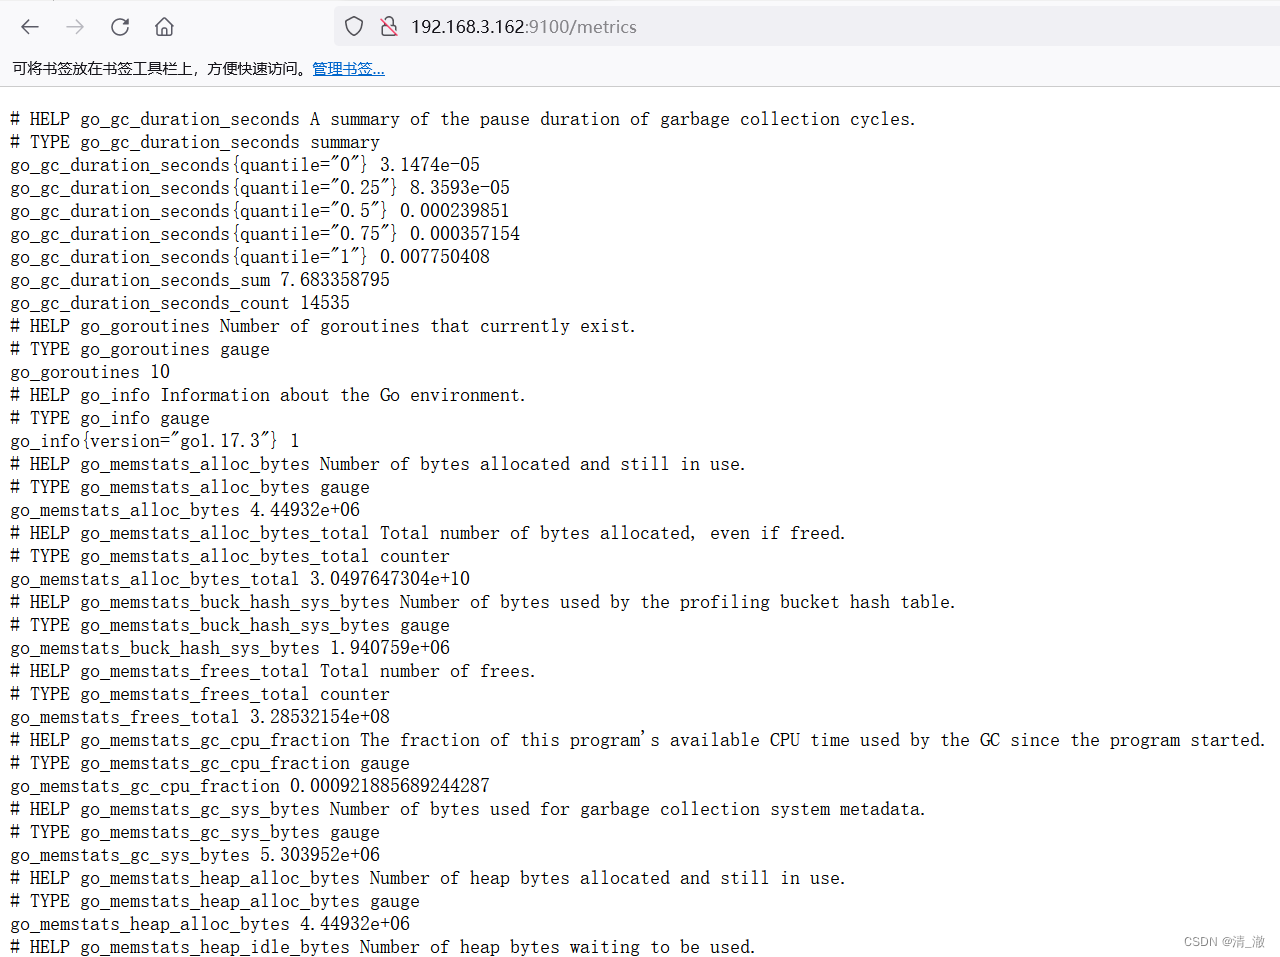
可见,插件已经抓取到服务器的监控信息。
3.2配置prometheus.yml

将192.168.3.162:9100的ip和端口配置到一个新建job
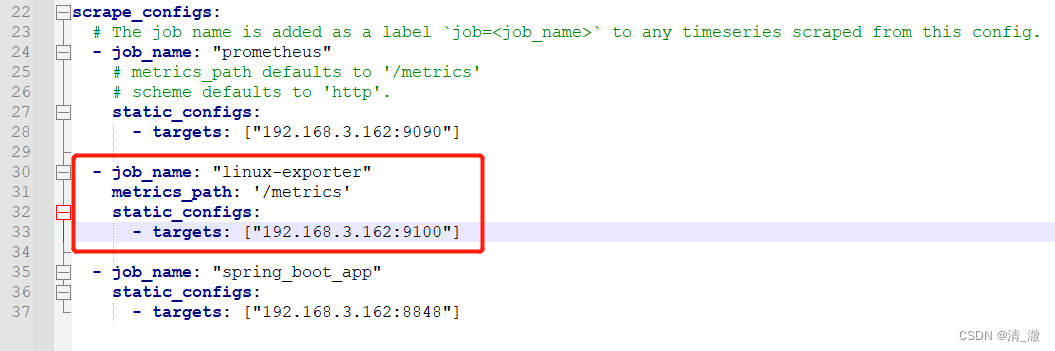
配置完后,重启普罗米修斯:
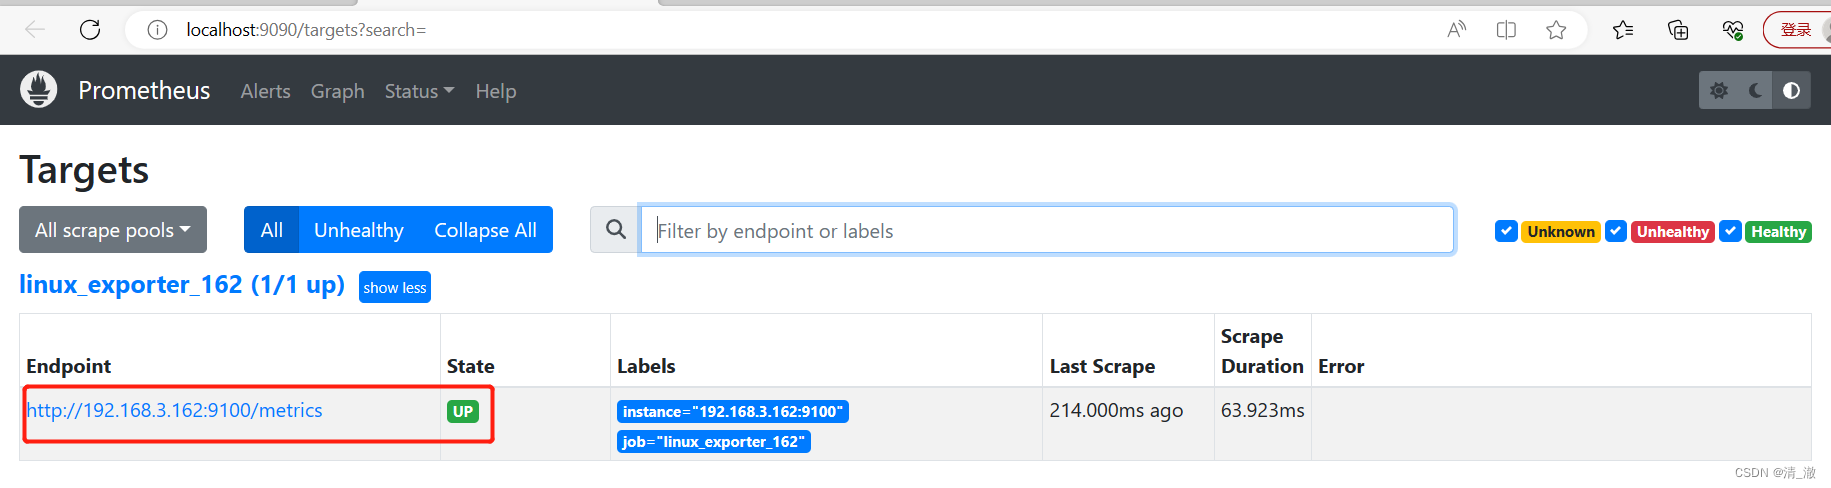
可以看到普罗米修斯已经监控到9100的job,点击确认查看监控详情:

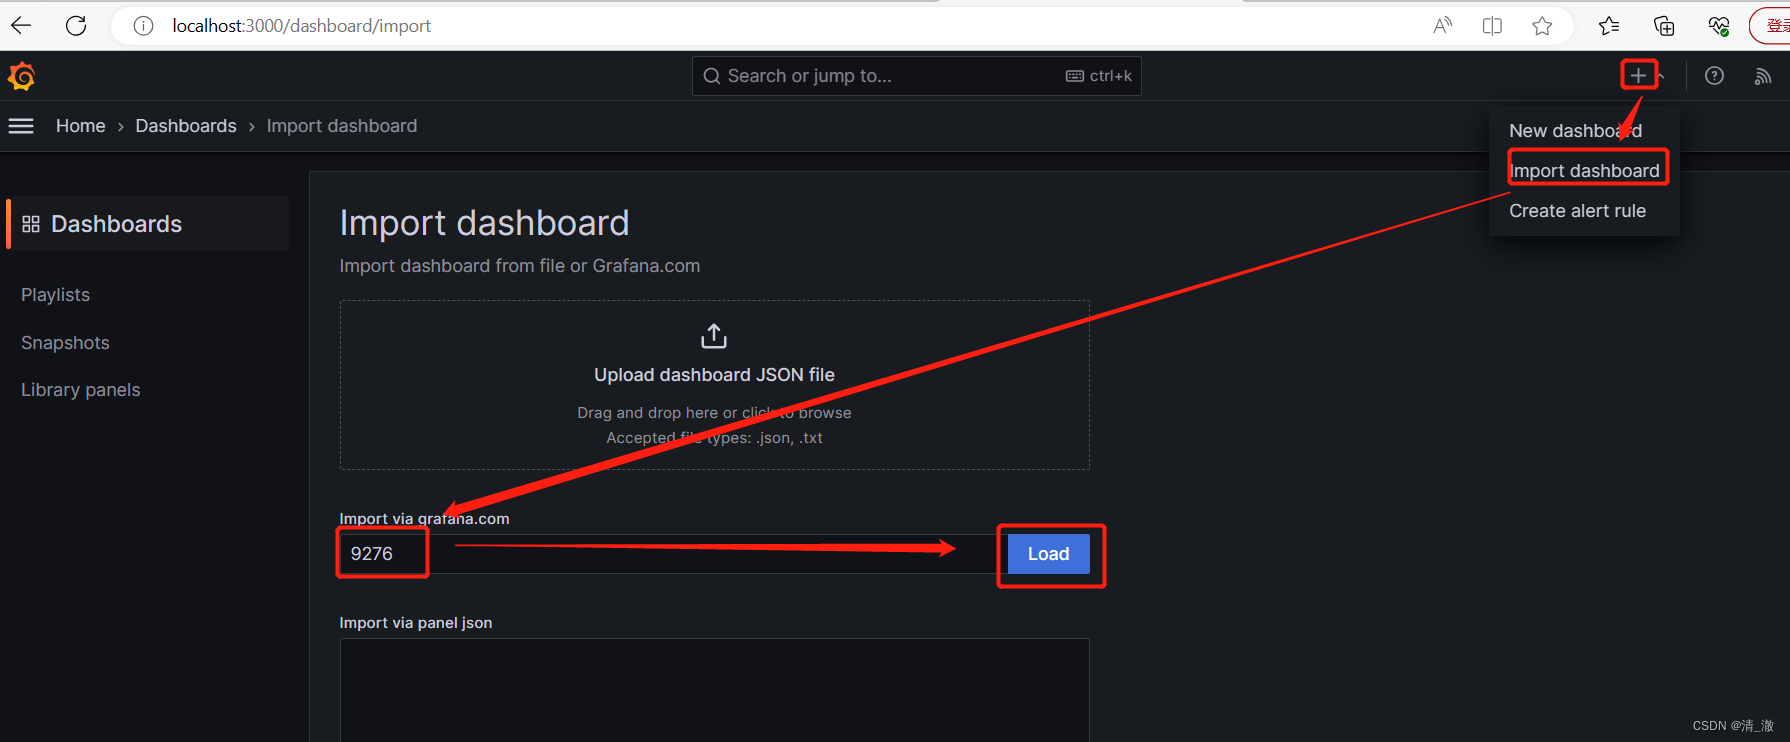
3.3配置Grafana
这里我们使用官方的模板配置 9276 :
grafana模板下载地址
https://grafana.com/grafana/dashboards
数据源选Prometheus:
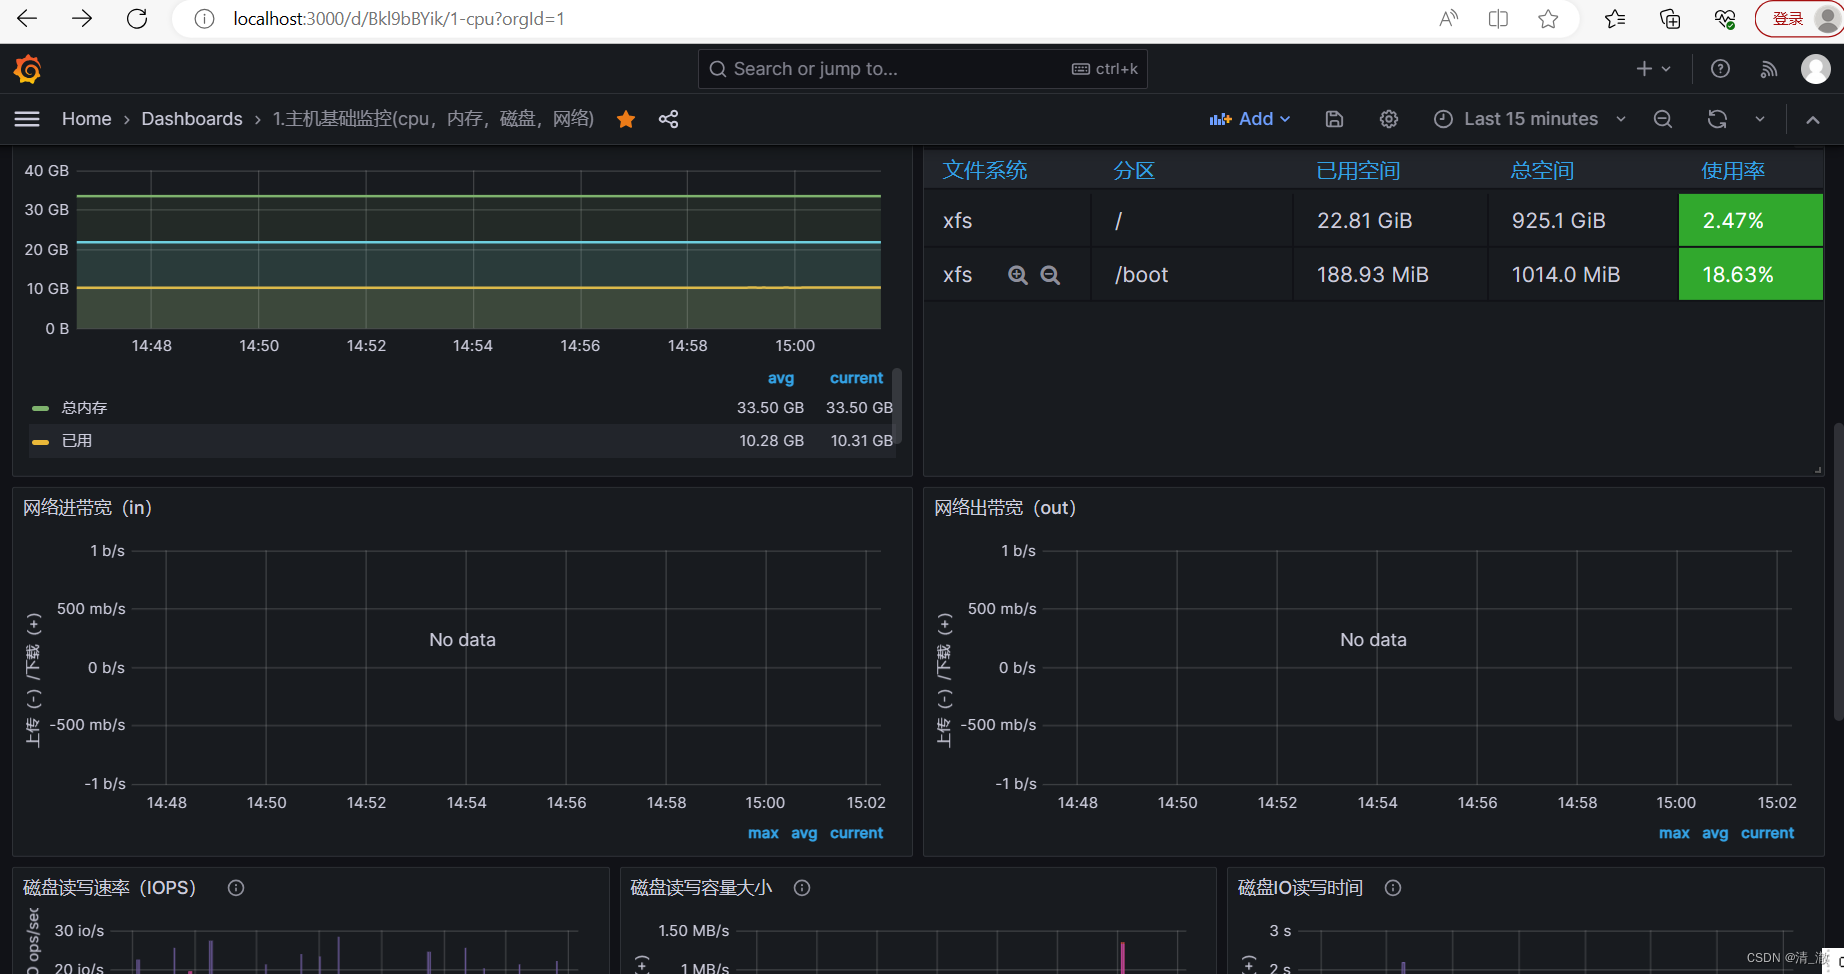
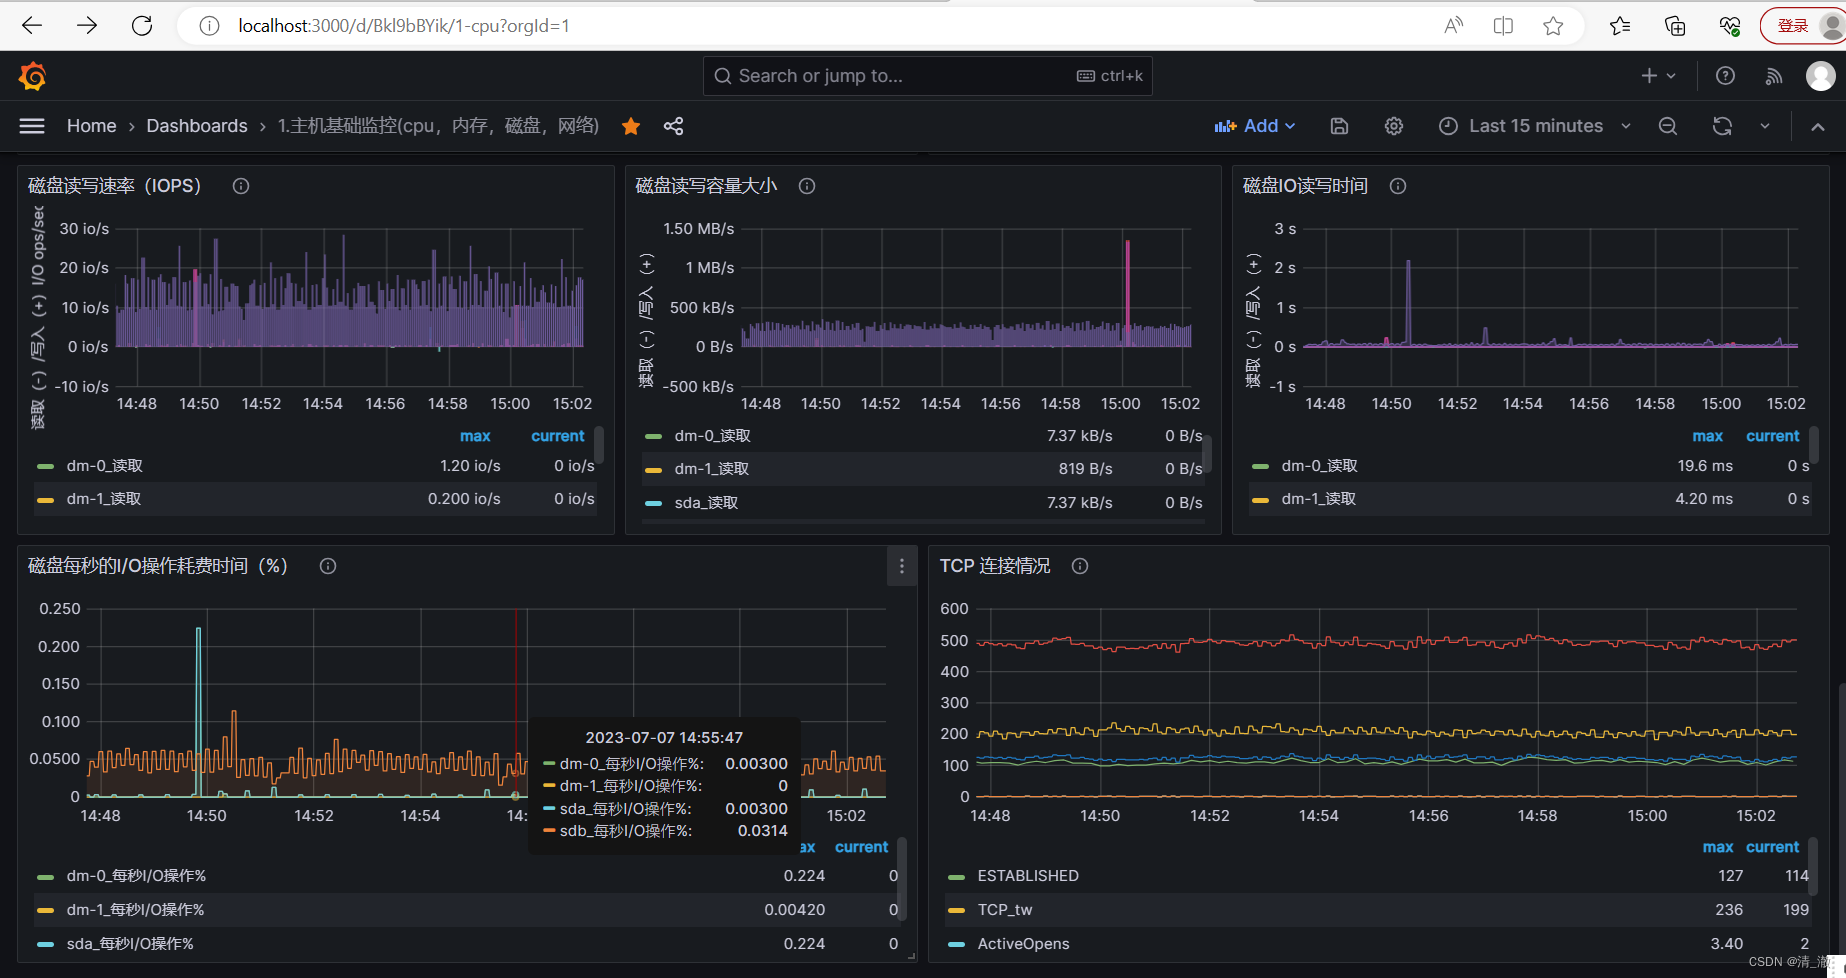
点确定后,进入监控面板:

3.4遇到的坑及解决方法
Grafana中监控不到数据
1.Centos上安装ntpdate:命令 yum install ntpdate -y
2.输入命令:ntpdate ntp1.aliyun.com
3.输入命令:hwclock --sysohc
4.输入命令:timedatectl
5.重新查看一下日期,输入命令:date
6.删除原来的Prometheus,重新安装配置一下
7.输入命令:reboot,重启centos
8.先检查一下日期:输入命令date,保证时间与windows监控机一致
9.关闭防火墙,重新启动grafana,prometheus,node_exporter
10.windows登录grafana,进入监控面板,已经可以监控到数据了,问题完美解决
4、Spring boot应用的监控配置
4**.1 **springboot工程pom.xml 配置
<dependency>
    <groupId>org.springframework.boot</groupId>
    <artifactId>spring-boot-starter-actuator</artifactId>
</dependency>
<dependency>
    <groupId>io.micrometer</groupId>
    <artifactId>micrometer-registry-prometheus</artifactId>
</dependency>

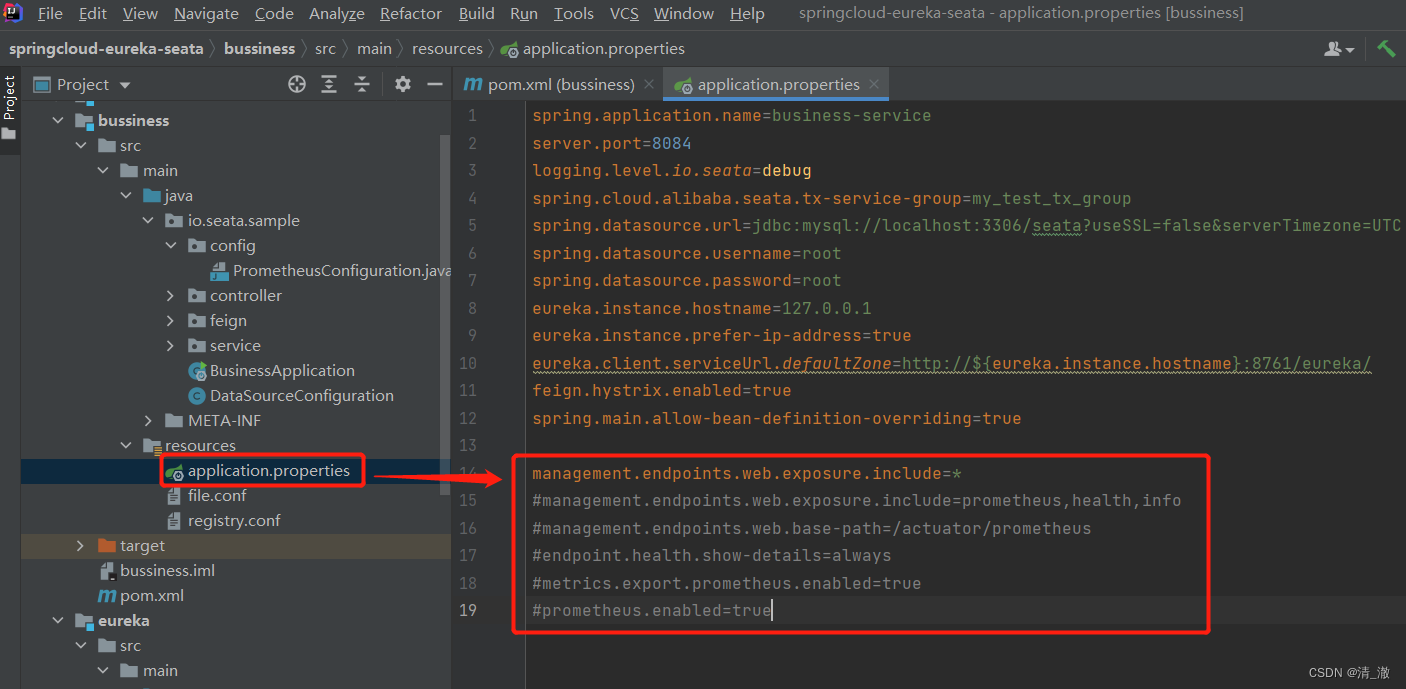
4**.2 **application.properties或application.yml 配置
management.endpoints.web.exposure.include=*
management:

  endpoints:

    web:

      exposure:

        include: *
如下图:
4**.3 **定义Prometheus监控任务
 - job_name: 'springboot-69-8084'

    metrics_path: '/actuator/prometheus'

    static_configs:

      - targets: ['localhost:8084'] # 使用你的Spring Boot应用程序的实际主机和端口替换

这里注意 metrics_path 要修改为 '/actuator/prometheus'
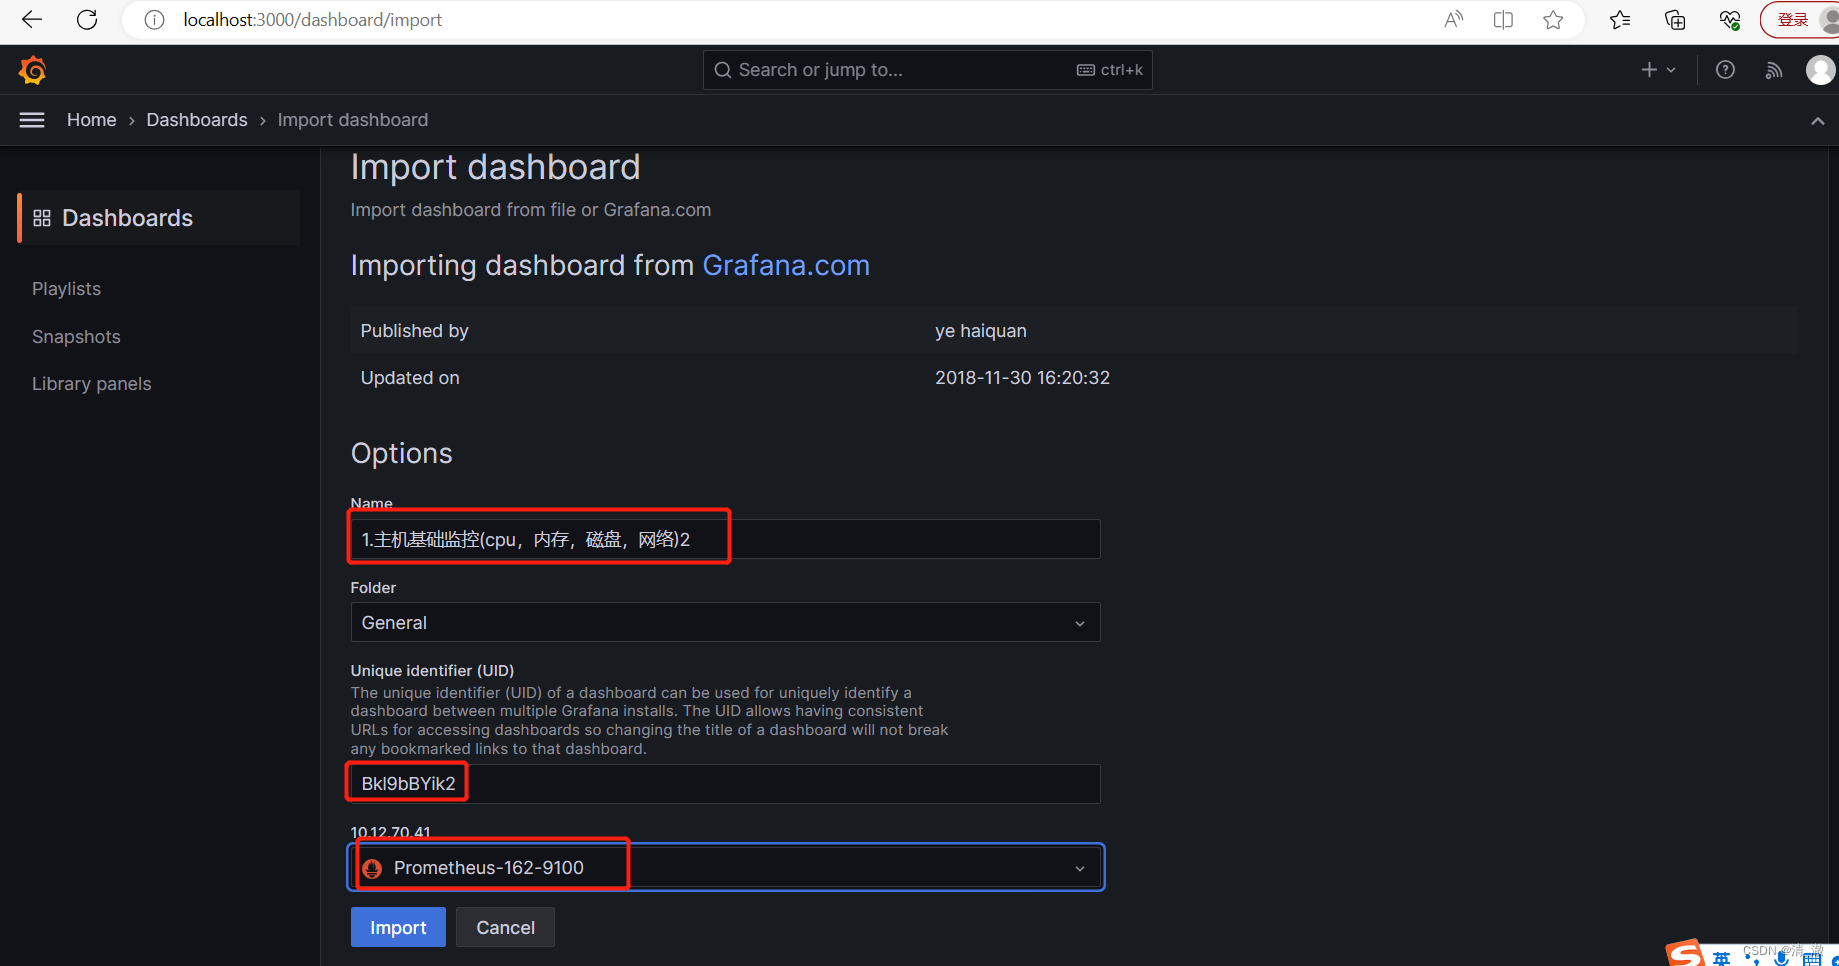
4**.4 **配置Grafana的dashboard
这里我们还是使用官方的模板:
SpringBoot Dashboard 模板ID: 12900


版权归原作者 蒙奇·D·路飞- 所有, 如有侵权,请联系我们删除。