个性签名:整个建筑最重要的是地基,地基不稳,地动山摇。而学技术更要扎稳基础,关注我,带你稳扎每一板块邻域的基础。
博客主页:啊四战斗霸的博客
收录专栏:Python三剑客之江湖云
南来的北往的,走过路过千万别错过,错过本篇,“精彩”可能与您失之交臂yo
Triple attack(三连击):Comment,Like and Collect—>Attention
文章目录
Matplotlib简介
认识Matlpotlib
- Matplotlib 是 Python 的2D绘图库,它能让使用者很轻松地将数据图形化,并且提供多样化的输出格式。
- Matplotlib 可以用来绘制各种静态,动态,交互式的图表,我们熟知的Seaborn,Pandas的绘图接口也是基于Matplotlib做了更高级的封装。
- Matplotlib 是一个非常强大的 Python 画图工具,我们可以使用该工具将很多数据通过图表的形式更直观的呈现出来。
- Matplotlib 可以绘制线图、散点图、等高线图、条形图、柱状图、3D 图形、甚至是图形动画等等。

安装Matplotlib库
- 使用pip
pip install matplotlib
- 使用conda
conda install matplotlib
- 安装官方版本
https://matplotlib.org/stable/users/installing/index.html
举个简单的栗子
- 引入Matplotlib并命名为plt,注意这个引入的是matplotlib.pyplot而不是直接引入matplotlib。
- Matplotlib的图像是画在figure(如windows,jupyter窗体)上的,每一个figure又包含了一个或多个axes(一个可以指定坐标系的子区域)。
- 最简单的创建figure以及axes的方式是通过pyplot.subplots命令,创建axes以后,可以使用Axes.plot绘制最简易的折线图。
import matplotlib.pyplot as plt
import numpy as np

x = np.linspace(0,2* np.pi,200)
y = np.sin(x)

fig, ax = plt.subplots()
ax.plot(x, y)
plt.show()
输出图形: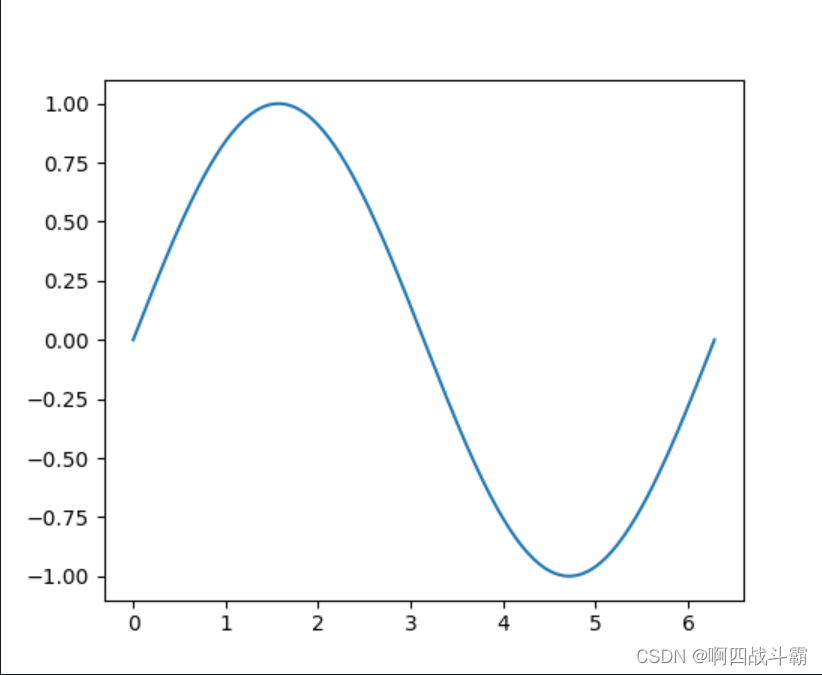
Matplotlib图表窗口
- Matplotlib → 一个python版的matlab绘图接口,以2D为主,支持python、numpy、pandas基本数据结构,运营高效且有较丰富的图表库。
import numpy as np
import pandas as pd
import matplotlib.pyplot as plt

# 这个show()方法主要是显示所绘制的图形,当我们绘制图形完成后,可以调用此方法。# 图表窗口1 → plt.show()
plt.plot(np.random.rand(10))
plt.show()# 直接生成图表# 图表窗口2 → 魔法函数,嵌入图表# 通过Jupyter的魔法命令%matplotlib inline 可以直接在jupyter notebook中展示图表,不需要每个图表都是用plt.show()来展现来% matplotlib inline
x = np.random.randn(1000)
y = np.random.randn(1000)
plt.scatter(x,y)# 直接嵌入图表,不用plt.show()# <matplotlib.collections.PathCollection at ...> 代表该图表对象# 图表窗口3 → 魔法函数,弹出可交互的matplotlib窗口% matplotlib notebook
s = pd.Series(np.random.randn(100))
s.plot(style ='k--o',figsize=(10,5))# 可交互的matplotlib窗口,不用plt.show()# 可做一定调整# 图表窗口4 → 魔法函数,弹出matplotlib控制台% matplotlib qt5
df = pd.DataFrame(np.random.rand(50,2),columns=['A','B'])
df.hist(figsize=(12,5),color='g',alpha=0.8)# 可交互性控制台# 如果已经设置了显示方式(比如notebook),需要重启然后再运行魔法函数# 网页嵌入的交互性窗口 和 控制台,只能显示一个#plt.close()    # 关闭窗口#plt.gcf().clear()  # 每次清空图表内内容
图的部分
一个完整的matplotlib图像通常会包括以下四个层级,这些层级也被称为容器(container)
- Figure:顶层级,用来容纳所有绘图元素
- Axes:matplotlib宇宙的核心,容纳了大量元素用来构造一幅幅子图,一个figure可以由一个或多个子图组成
- Axis:axes的下属层级,用于处理所有和坐标轴,网格有关的元素
- Tick:axis的下属层级,用来处理所有和刻度有关的元素
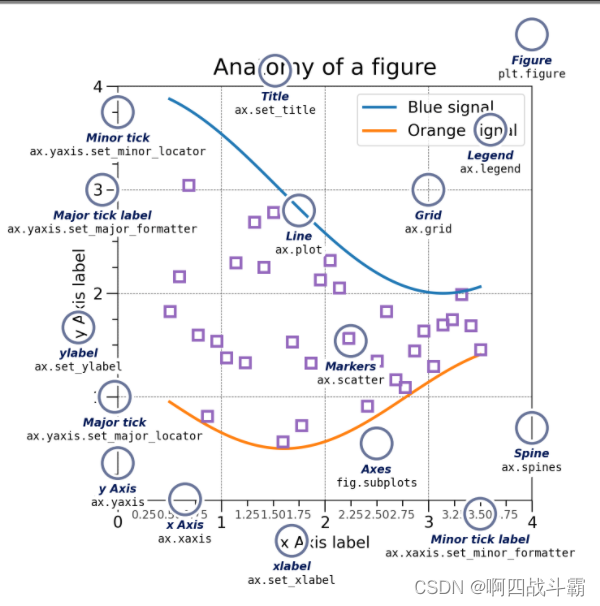
Figure
创建新图形的最简单方法是使用 pyplot:
- 通过plt.subplot()命令来创建Figure和Axes - axes是绘图的坐标系- figure是绘图的窗口
fig = plt.figure()# 一个没有轴的空图形
fig, ax = plt.subplots()# 单轴图形,创建一个包含一个axes的figure
fig, axs = plt.subplots(2,2)# 具有2x2轴网格的图形
Axes
Axis对象(注意区别 在 Axes 和 Axis )提供刻度和刻度标签 为轴中的数据提供比例。 每个 Axes还 有:
- 一个标题 (通过设置 set_title())
- 一个x标签(通过设置 set_xlabel())
- 一个y标签集通过 set_ylabel()).
Axis
这些对象设置比例和限制并生成刻度(标记 在轴上)和刻度标签(标记刻度的字符串)。
Artist
图上可见的一切都是艺术家(甚至 Figure, Axes, 和 Axis对象)。 当图形被渲染时,所有的 艺术家被 画布 。 大多数艺术家都被绑在轴上; 这样的 艺术家不能被多个轴共享,也不能从一个轴移动到另一个轴。
绘图函数的输入类型
numpy.array 或 numpy.asarray
- 绘图功能期望 numpy.array或者 numpy.ma.masked_array作为 输入,或可以传递给对象 numpy.asarray. 类似于数组的类, - 例如 pandas 数据对象和 numpy.matrix可能无法按预期工作。 共同约定是将这些转换为 numpy.array绘制之前的对象。- 例如,要转换一个 numpy.matrix。代码如下:
b = np.matrix([[1,2],[3,4]])
b_asarray = np.asarray(b)
dict 、 numpy.recarray, 或 pandas.DataFrame
- 大多数方法还将解析可寻址对象,例如 dict 、 numpy.recarray, 或 pandas.DataFrame. Matplotlib 允许提供这data关键字参数并生成传递字符串的图 对应于 x 和 y 变量。
np.random.seed(19680801)# seed the random number generator.
data ={'a': np.arange(50),'c': np.random.randint(0,50,50),'d': np.random.randn(50)}
data['b']= data['a']+10* np.random.randn(50)
data['d']= np.abs(data['d'])*100

fig, ax = plt.subplots(figsize=(5,2.7))
ax.scatter('a','b', c='c', s='d', data=data)
ax.set_xlabel('entry a')
ax.set_ylabel('entry b');
两种绘图接口
OO风格
- 显式创建图形(figure)和轴(axes),并在它们上调用方法,也被称为OO模式(object-oriented style)
- 通过plt.subplot()命令来创建Figure和Axes,然后再对axes进行数据的绑定
x = np.linspace(0,2,100)# 样本数据# 注意,即使在OO风格中,我们也使用'pyplot.figure'创建图形的步骤
fig, ax = plt.subplots(figsize=(5,2.7))
ax.plot(x, x, label='linear')# 在x,y轴上绘制一些数据
ax.plot(x, x**2, label='quadratic')# 在x,y轴上绘制更多数据
ax.plot(x, x**3, label='cubic')# 还有更多
ax.set_xlabel('x label')# 将x标签添加到轴
ax.set_ylabel('y label')# 将y标签添加到轴
ax.set_title("Simple Plot")# 将标题添加到轴
ax.legend();# 添加一个图例
输出图形: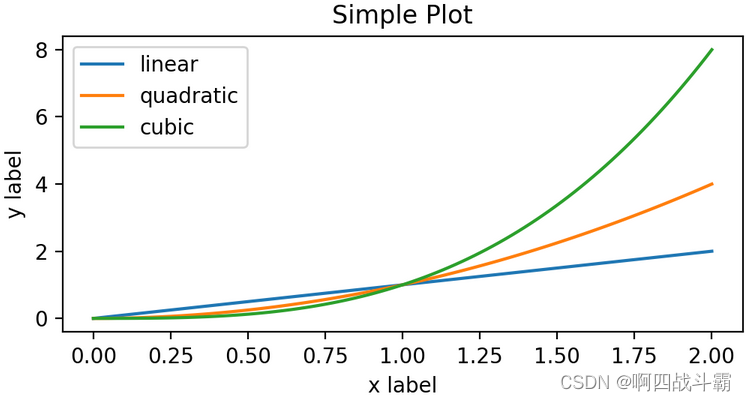
pyplot风格
- 依赖pyplot自动创建与管理figure和axes,以及使用pyplot函数进行绘图
- 还可以通过一个更简单的方法来创建,matplotlib.pyplot方法能够直接在当前axes上绘制图像,如果用户未指定axes,matplotlib会帮你自动创建一个。
x = np.linspace(0,2,100)# 样本数据

plt.figure(figsize=(5,2.7))
plt.plot(x, x, label='linear')# 在x,y轴上绘制一些数据。
plt.plot(x, x**2, label='quadratic')# etc.
plt.plot(x, x**3, label='cubic')
plt.xlabel('x label')
plt.ylabel('y label')
plt.title("Simple Plot")
plt.legend();
输出图形: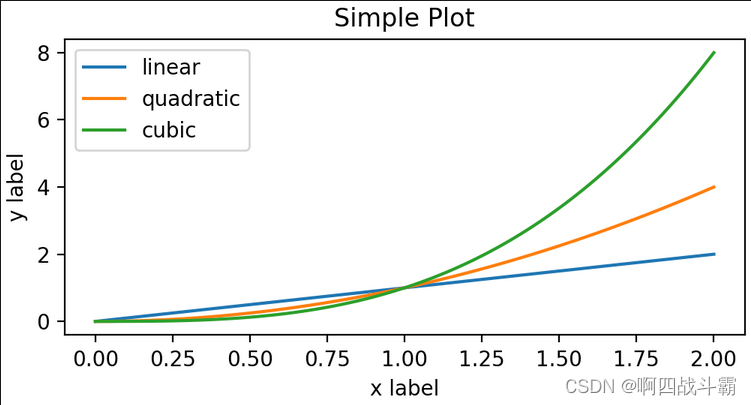
通用绘图模板
OO绘图模板
import matplotlib.pyplot as plt
import numpy as np

# 1 准备数据
x = np.linspace(0,2,100)
y = x**2# 2 设置绘图样式,这一步不是必须的,样式也可以在绘制图像中进行设置
mpl.rc('lines', linewidth=4, linestyle='-.')# 3 定义布局
fig, ax = plt.subplots()# 4 绘制图像
ax.plot(x, y, label='linear')# 5 添加标签,文字和图例
ax.set_xlabel('x label')
ax.set_ylabel('y label')
ax.set_title("Simple Plot")
ax.legend()
输出图形: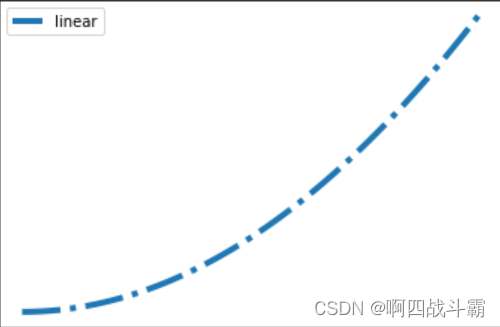
pyplot绘图模板
import matplotlib.pyplot as plt
import numpy as np

# 1 准备数据
x = np.linspace(-3,3,50)
y1 =2*x +1
y2 = x**2# 2 定义图像窗口
plt.figure(num=3, figsize=(8,5))# 3 画图
plt.plot(x, y2)
plt.plot(x, y1, color='red', linewidth=1.0, linestyle='--')# 4 定义坐标轴范围及名称
plt.xlim((-1,2))
plt.ylim((-2,3))
plt.xlabel('I am x')
plt.ylabel('I am y')# 5 定义坐标轴刻度及名称
new_ticks = np.linspace(-1,2,5)
plt.xticks(new_ticks)
plt.yticks([-2,-1.8,-1,1.22,3],[r'$really\ bad$',r'$bad$',r'$normal$',r'$good$',r'$really\ good$'])# 6 设置图像边框颜色
ax = plt.gca()
ax.spines['right'].set_color('none')
ax.spines['top'].set_color('none')# 7 调整刻度及边框位置
ax.xaxis.set_ticks_position('bottom')
ax.spines['bottom'].set_position(('data',0))
ax.yaxis.set_ticks_position('left')
ax.spines['left'].set_position(('data',0))
plt.show()
版权归原作者 啊四战斗霸 所有, 如有侵权,请联系我们删除。