
1 安装 Prometheus Server
Prometheus 基于 Golang 编写,编译后的软件包,不依赖于任何的第三方依赖。只需要下载对应平台的二进制包,解压并且添加基本的配置即可正常启动 Prometheus Server。
1.1 下载安装包之后上传到服务器

1.2 解压安装包 prometheus-2.40.1.linux-amd64.tar.gz
[root@localserver /root/prometheus]# tar zxvf prometheus-2.40.1.linux-amd64.tar.gz [root@localserver /root/prometheus]# mv prometheus-2.40.1.linux-amd64 /usr/local/prometheus-2.40.1[root@localserver /root/prometheus]# cd /usr/local/prometheus-2.40.1[root@localserver /usr/local/prometheus-2.40.1]# ll
total 215448
drwxr-xr-x. 2100112138 Nov  922:52 console_libraries
drwxr-xr-x. 21001121173 Nov  922:52 consoles
-rw-r--r--. 1100112111357 Nov  922:52 LICENSE
-rw-r--r--. 110011213773 Nov  922:52 NOTICE
-rwxr-xr-x. 11001121114465160 Nov  922:34 prometheus
-rw-r--r--. 11001121934 Nov  922:52 prometheus.yml
-rwxr-xr-x. 11001121106127759 Nov  922:36 promtool
1.3 修改配置文件 prometheus.yml
scrape_configs:
  - job_name: "prometheus"
    static_configs:
      - targets: ["localserver:9090"]

  - job_name: 'pushgateway'
    static_configs:
      - targets: ['localserver:9091']
        labels:
          instance: pushgateway

  - job_name: 'node exporter'
    static_configs:
      - targets: ['localserver:9100', 'ubuntu18:9100']
注:这里的 localserver 写为本地的 IP 也可以,或者使用 localhost 代替均可。
配置说明:
global 配置块:此片段指定的是 prometheus 的全局配置, 比如采集间隔,抓取超时时间等。
➢ scrape_interval:拉取数据的时间间隔,默认为 1 分钟默认继承 global 值。
scrape_timeout: 抓取超时时间,默认继承 global 值。
➢ evaluation_interval:规则验证(生成 alert)的时间间隔,默认为 1 分钟。
rule_files 配置块:此片段指定报警规则文件, prometheus 根据这些规则信息,会推送报警信息到alertmanager 中。
scrape_configs 配置块:配置采集目标相关, prometheus 监视的目标。Prometheus自身的运行信息可以通过 HTTP 访问,所以Prometheus 可以监控自己的运行数据。指定抓取配置,prometheus 的数据采集通过此片段配置。
➢ job_name:监控作业的名称。他的下一集是instance,也就是target
➢ static_configs:表示静态目标配置,就是固定从某个 target 拉取数据。一个 scrape_config 片段指定一组目标和参数, 目标就是实例,指定采集的端点, 参数描述如何采集这些实例, 主要参数如下
➢ targets : 指定监控的目标, 其实就是从哪儿拉取数据。
metric_path: 抓取路径, 默认是/metrics
*_sd_configs: 指定服务发现配置
Prometheus 会从 http://server:9090/metrics 上拉取数据。
Prometheus 是可以在运行时自动加载配置的。启动时需要添加:–web.enable-lifecycle
2 安装 node_exporter(可选)
简言之就是在每个node启动之后就通过了每个node的查询接口,promethus就能收集到了。
在 Prometheus 的架构设计中,Prometheus Server 主要负责数据的收集,存储并且对外提供数据查询支持,而实际的监控样本数据的收集则是由 Exporter 完成。
因此为了能够监控到某些东西,如主机的CPU 使用率,我们需要使用到 Exporter。Prometheus 周期性的从 Exporter 暴露的HTTP 服务地址(通常是/metrics)拉取监控样本数据。
Exporter 可以是一个相对开放的概念,其可以是一个独立运行的程序独立于监控目标以外,也可以是直接内置在监控目标中。只要能够向 Prometheus 提供标准格式的监控样本数据即可。
为了能够采集到主机的运行指标如CPU, 内存,磁盘等信息。我们可以使用Node Exporter。Node Exporter 同样采用 Golang 编写,并且不存在任何的第三方依赖,只需要下载,解压即可运行。可以从 https://prometheus.io/download/ 获取最新的 node exporter 版本的二进制包。
2.1 解压 node_exporter-1.4.0.linux-amd64.tar.gz
[root@localserver /root/prometheus]# tar xf node_exporter-1.4.0.linux-amd64.tar.gz[root@localserver /root/prometheus]# mv node_exporter-1.4.0.linux-amd64 /usr/local/node_exporter-1.4.0[root@localserver /root/prometheus]# cd /usr/local/node_exporter-1.4.0[root@localserver /usr/local/node_exporter-1.4.0]# ./node_exporter## 直接使用 ./node_exporter 启动会在终端上有很多日志,所以我们可以使用 nohup 命令,用于在系统后台不挂断地运行命令,退出终端不会影响程序的运行。## 以下命令在后台执行 node_exporter 脚本,并重定向输入到当前目录下的 node_exporter.log 文件:[root@localserver /usr/local/node_exporter-1.4.0]# nohup ./node_exporter > node_exporter.log 2>&1 &############################2>&1 解释:

将标准错误 2 重定向到标准输出 &1 ,标准输出 &1 再被重定向输入到 runoob.log 文件中。

    0 – stdin (standard input,标准输入)1 – stdout (standard output,标准输出)2 – stderr (standard error,标准错误输出)
此时,可以使用 ps -ef | grep node 命令确认node_exporter是否启动,或者使用 ss -tlnp 都可以;
启动之后,就可以在浏览器中输入:http://192.168.178.150:9100/metrics 进行访问了。如下图:
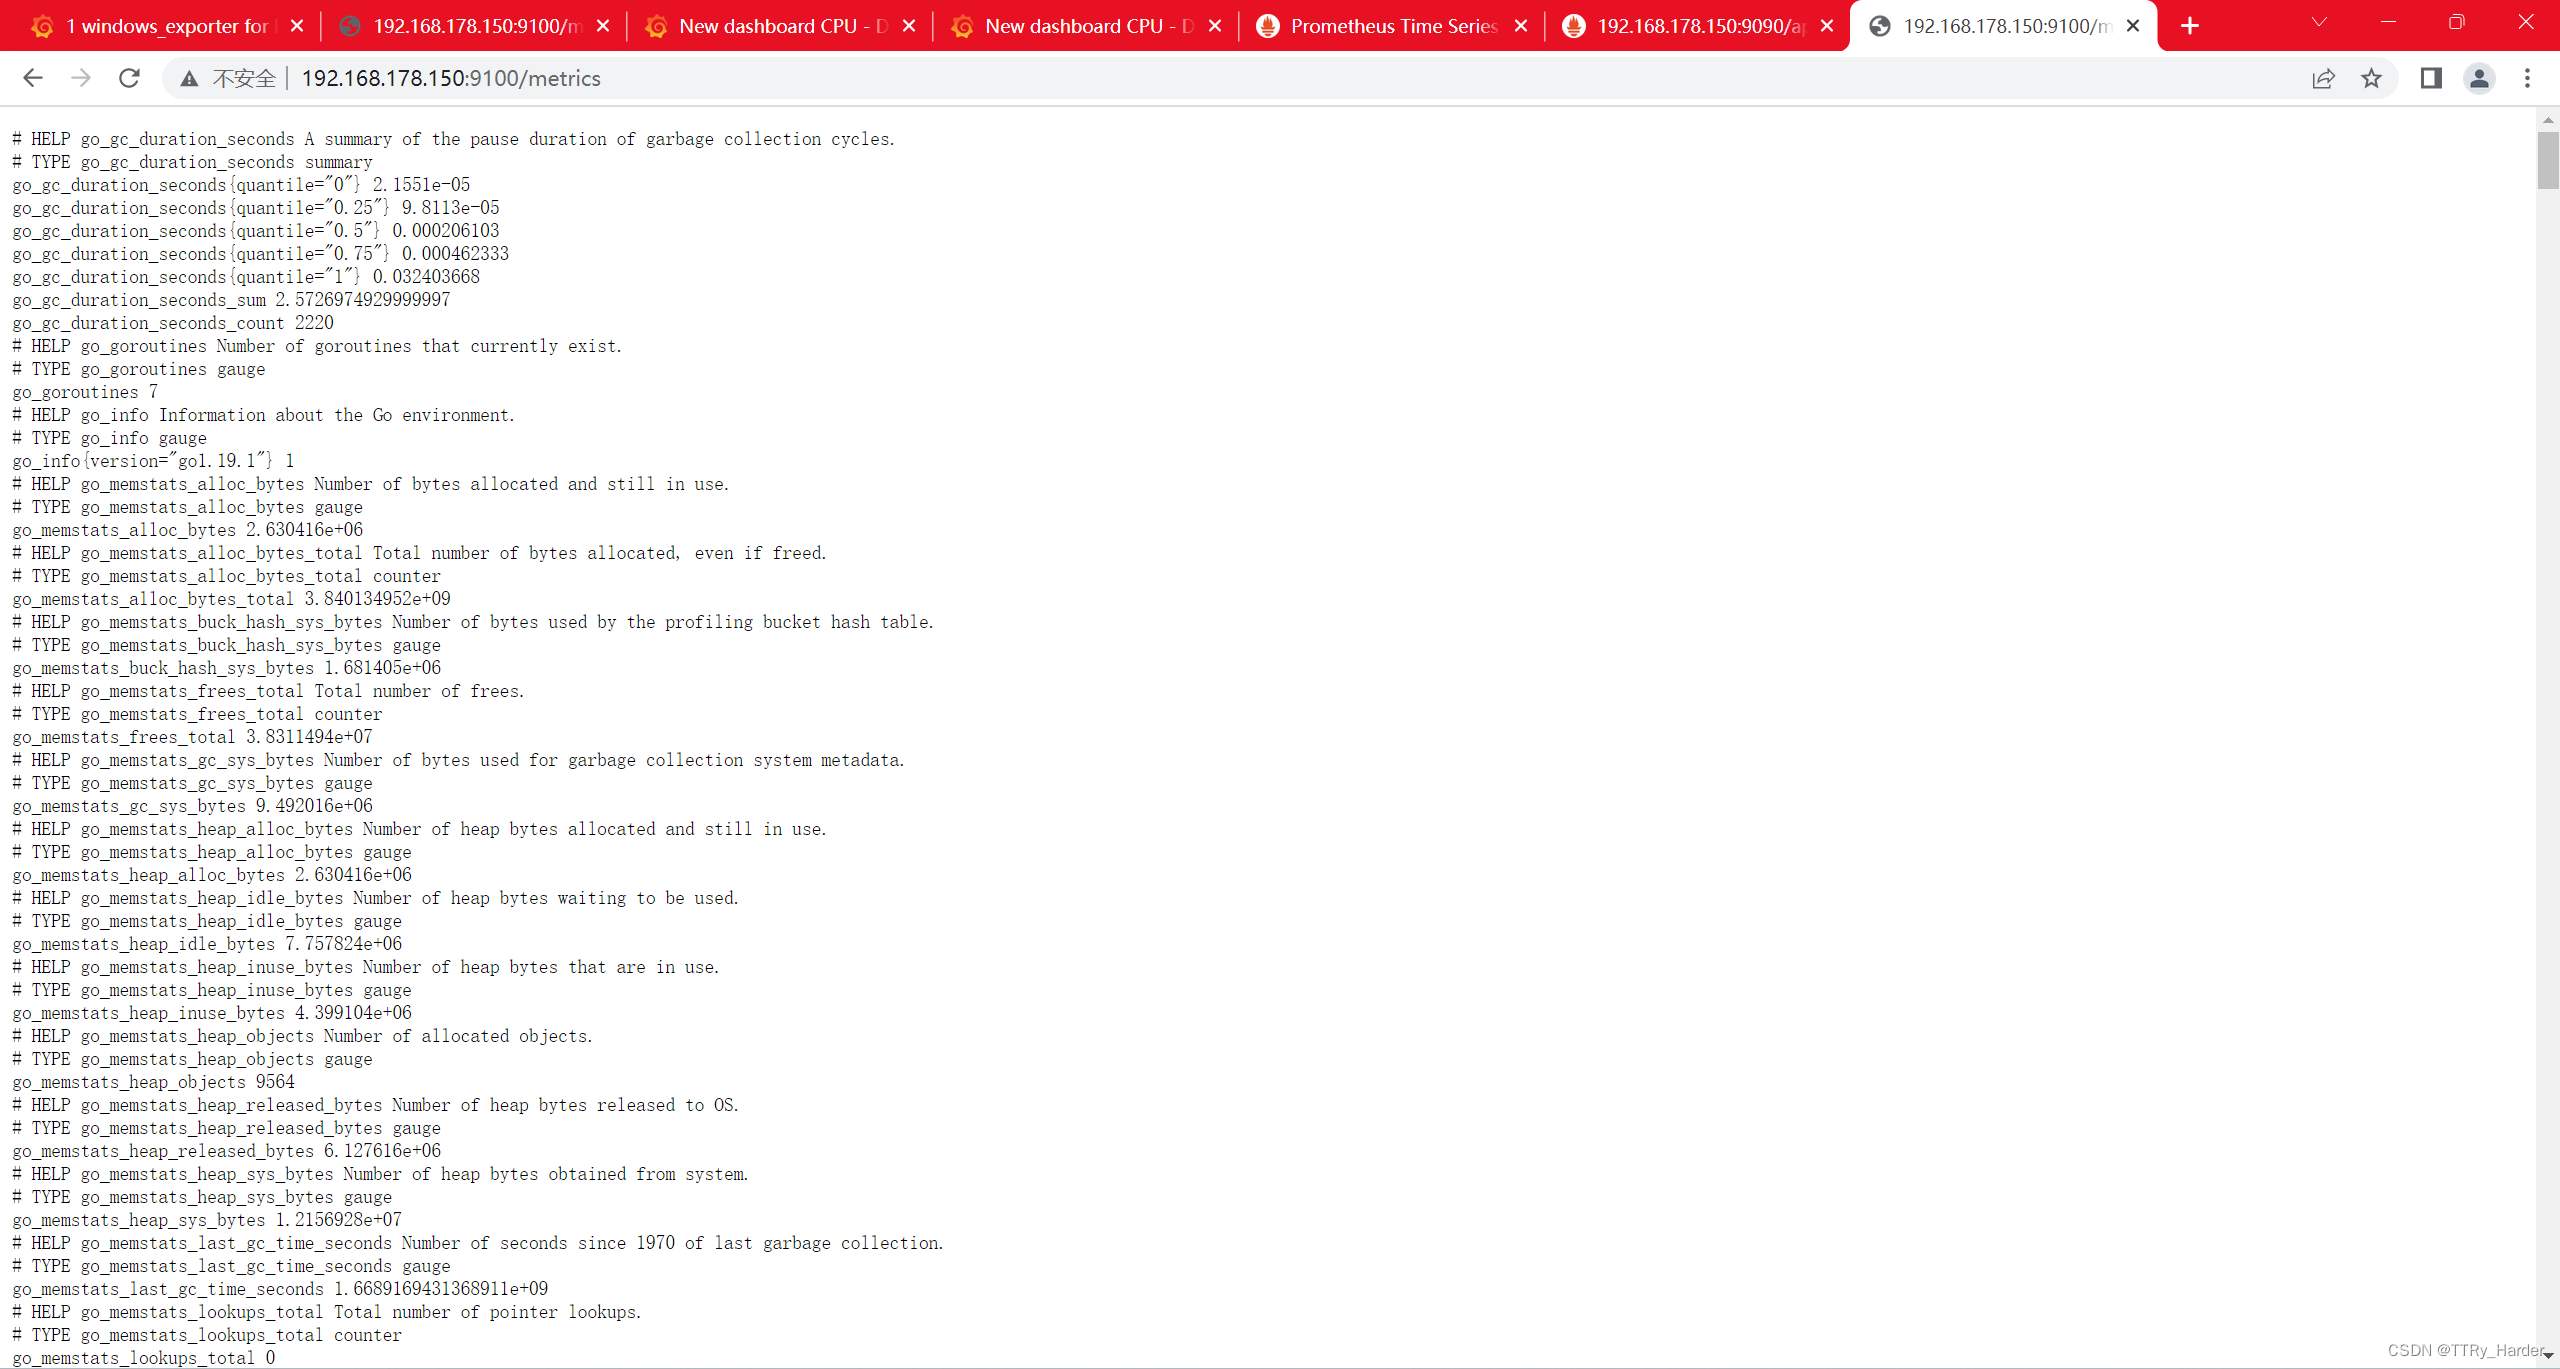
可见,当前 node exporter 获取到的当前主机的所有监控数据。
2.2 配置 node_exporter 的 service 文件
[root@localserver /root]# vim /usr/lib/systemd/system/node_exporter.service[root@localserver /root]# cat /usr/lib/systemd/system/node_exporter.service[Unit]Description=node_export
Documentation=https://github.com/prometheus/node_exporter
After=network.target
[Service]Type=simple
ExecStart= /usr/local/node_exporter-1.4.0/node_exporter
Restart=on-failure
[Install]WantedBy=multi-user.target

[root@localserver /root]# systemctl restart node_exporter[root@localserver /root]# systemctl status node_exporter
● node_exporter.service - node_export
   Loaded: loaded (/usr/lib/systemd/system/node_exporter.service; disabled; vendor preset: disabled)
   Active: active (running) since Tue 2022-11-15 12:17:41 CST; 4s ago
     Docs: https://github.com/prometheus/node_exporter
 Main PID: 13013(node_exporter)
   CGroup: /system.slice/node_exporter.service
           └─13013 /usr/local/node_exporter-1.4.0/node_exporter

Nov 1512:17:41 localserver node_exporter[13013]: ts=2022-11-15T04:17:41.886Z caller=node_exporter.go:115 level=info collector=thermal_zone
Nov 1512:17:41 localserver node_exporter[13013]: ts=2022-11-15T04:17:41.886Z caller=node_exporter.go:115 level=info collector=time
Nov 1512:17:41 localserver node_exporter[13013]: ts=2022-11-15T04:17:41.886Z caller=node_exporter.go:115 level=info collector=timex
Nov 1512:17:41 localserver node_exporter[13013]: ts=2022-11-15T04:17:41.886Z caller=node_exporter.go:115 level=info collector=udp_queues
Nov 1512:17:41 localserver node_exporter[13013]: ts=2022-11-15T04:17:41.886Z caller=node_exporter.go:115 level=info collector=uname
Nov 1512:17:41 localserver node_exporter[13013]: ts=2022-11-15T04:17:41.886Z caller=node_exporter.go:115 level=info collector=vmstat
Nov 1512:17:41 localserver node_exporter[13013]: ts=2022-11-15T04:17:41.886Z caller=node_exporter.go:115 level=info collector=xfs
Nov 1512:17:41 localserver node_exporter[13013]: ts=2022-11-15T04:17:41.886Z caller=node_exporter.go:115 level=info collector=zfs
Nov 1512:17:41 localserver node_exporter[13013]: ts=2022-11-15T04:17:41.886Z caller=node_exporter.go:199 level=info msg="Listening on"address=:9100
Nov 1512:17:41 localserver node_exporter[13013]: ts=2022-11-15T04:17:41.886Z caller=tls_config.go:195 level=info msg="TLS is disabled."http2=false
3 安装 Pushgateway(可选)
Prometheus 在正常情况下是采用拉模式从产生 metric 的作业或者 exporter(比如专门监控主机的NodeExporter)拉取监控数据。但是我们要监控的是 Flink on YARN 作业,想要让 Prometheus 自动发现作业的提交、结束以及自动拉取数据显然是比较困难的。
PushGateway 就是一个中转组件,通过配置Flink on YARN 作业将 metric 推到PushGateway,Prometheus 再从PushGateway 拉取就可以了。
[root@localserver /root/prometheus]# tar xf pushgateway-1.4.3.linux-amd64.tar.gz [root@localserver /root/prometheus]# mv pushgateway-1.4.3.linux-amd64 /usr/local/pushgateway-1.4.3[root@localserver /root/prometheus]# cd /usr/local/pushgateway-1.4.3[root@localserver /usr/local/pushgateway-1.4.3]# ll
total 16868
-rw-r--r--. 13434343411357 May 31 03:07 LICENSE
-rw-r--r--. 134343434487 May 31 03:07 NOTICE
-rwxr-xr-x. 13434343417255173 May 31 03:02 pushgateway
4 安装Alertmanager(可选)
[root@localserver /root/prometheus]# tar xf alertmanager-0.24.0.linux-amd64.tar.gz [root@localserver /root/prometheus]# mv alertmanager-0.24.0.linux-amd64 /usr/local/alertmanager-0.24.0[root@localserver /root/prometheus]# cd /usr/local/alertmanager-0.24.0[root@localserver /usr/local/alertmanager-0.24.0]# ll
total 55744
-rwxr-xr-x. 13434343431988661 Mar 252022 alertmanager
-rw-r--r--. 134343434356 Mar 252022 alertmanager.yml
-rwxr-xr-x. 13434343425067944 Mar 252022 amtool
-rw-r--r--. 13434343411357 Mar 252022 LICENSE
-rw-r--r--. 134343434457 Mar 252022 NOTICE
5 启动服务
[root@localserver /usr/local/prometheus-2.40.1]# nohup ./prometheus --config.file=prometheus.yml > ./prometheus.log 2>&1 &[root@localserver /usr/local/pushgateway-1.4.3]# nohup ./pushgateway --web.listen-address :9091 > ./pushgateway.log 2>&1 &[root@localserver /usr/local/alertmanager-0.24.0]# nohup ./alertmanager --config.file=/usr/local/prometheus-2.40.1/alertmanager.yml > ./alertmanager.log 2>&1 &
启动之后在浏览器访问:http://192.168.178.150:9090/
点击:status - targets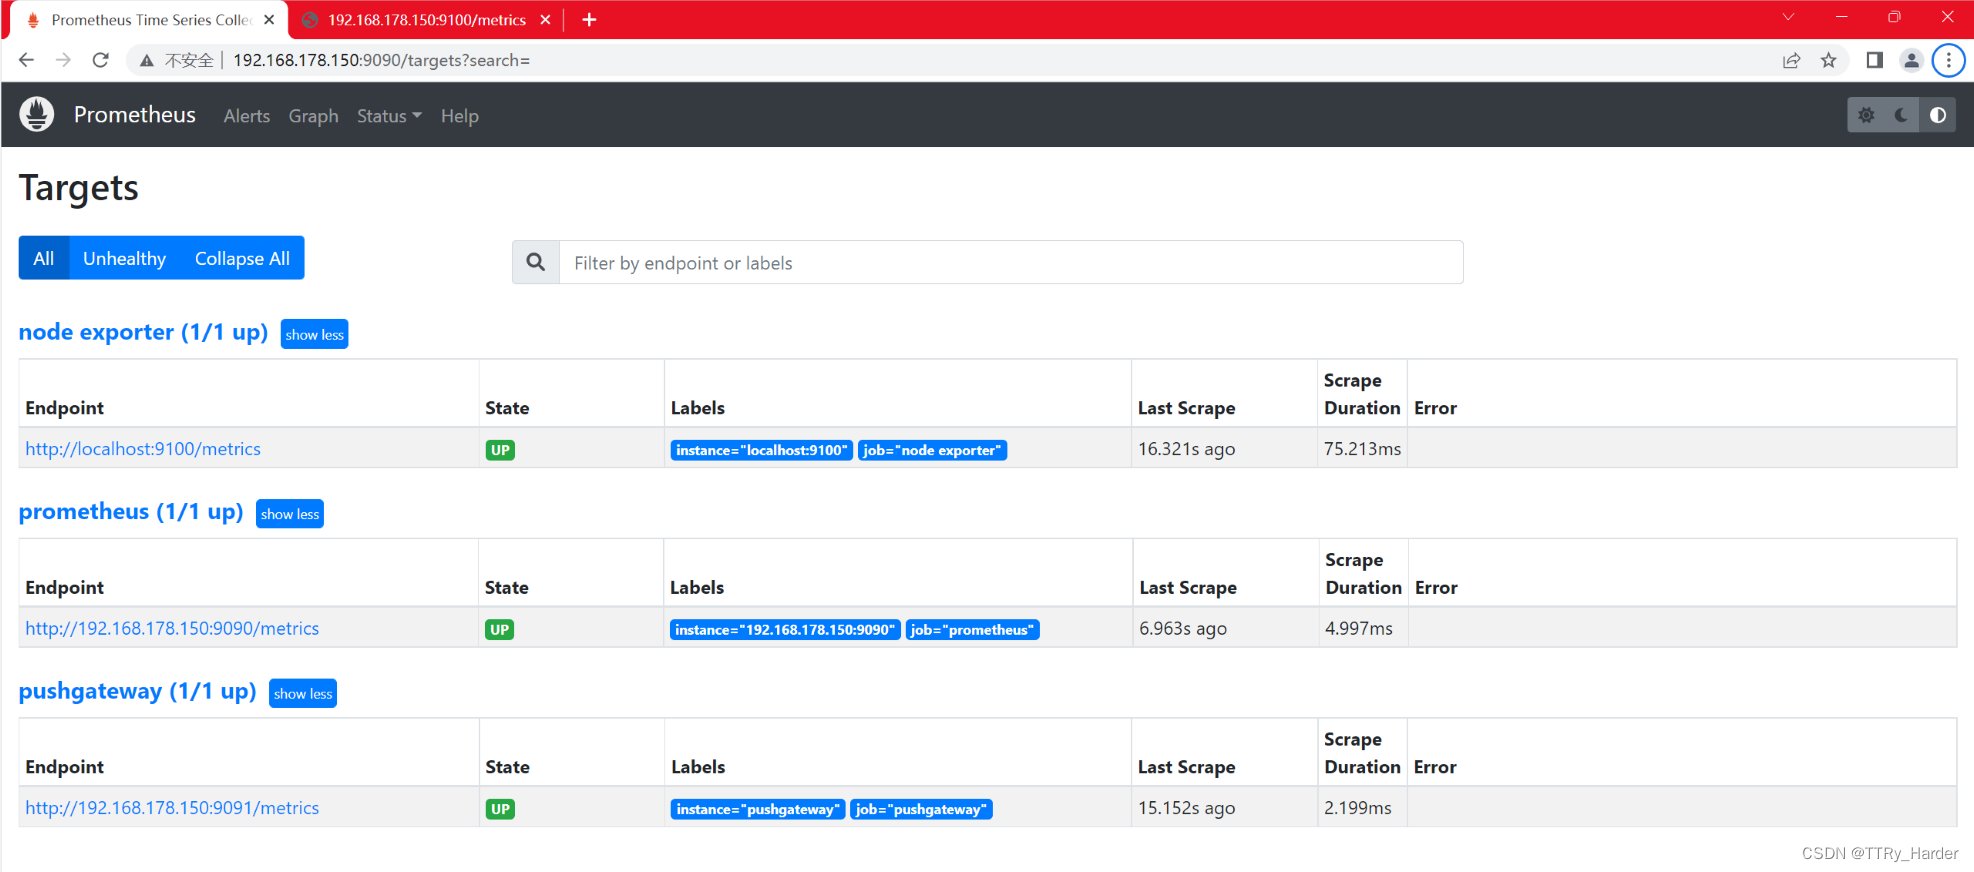
Prometheus、node exporter、pushgateway 都是 up 状态,表示安装启动成功。
补充
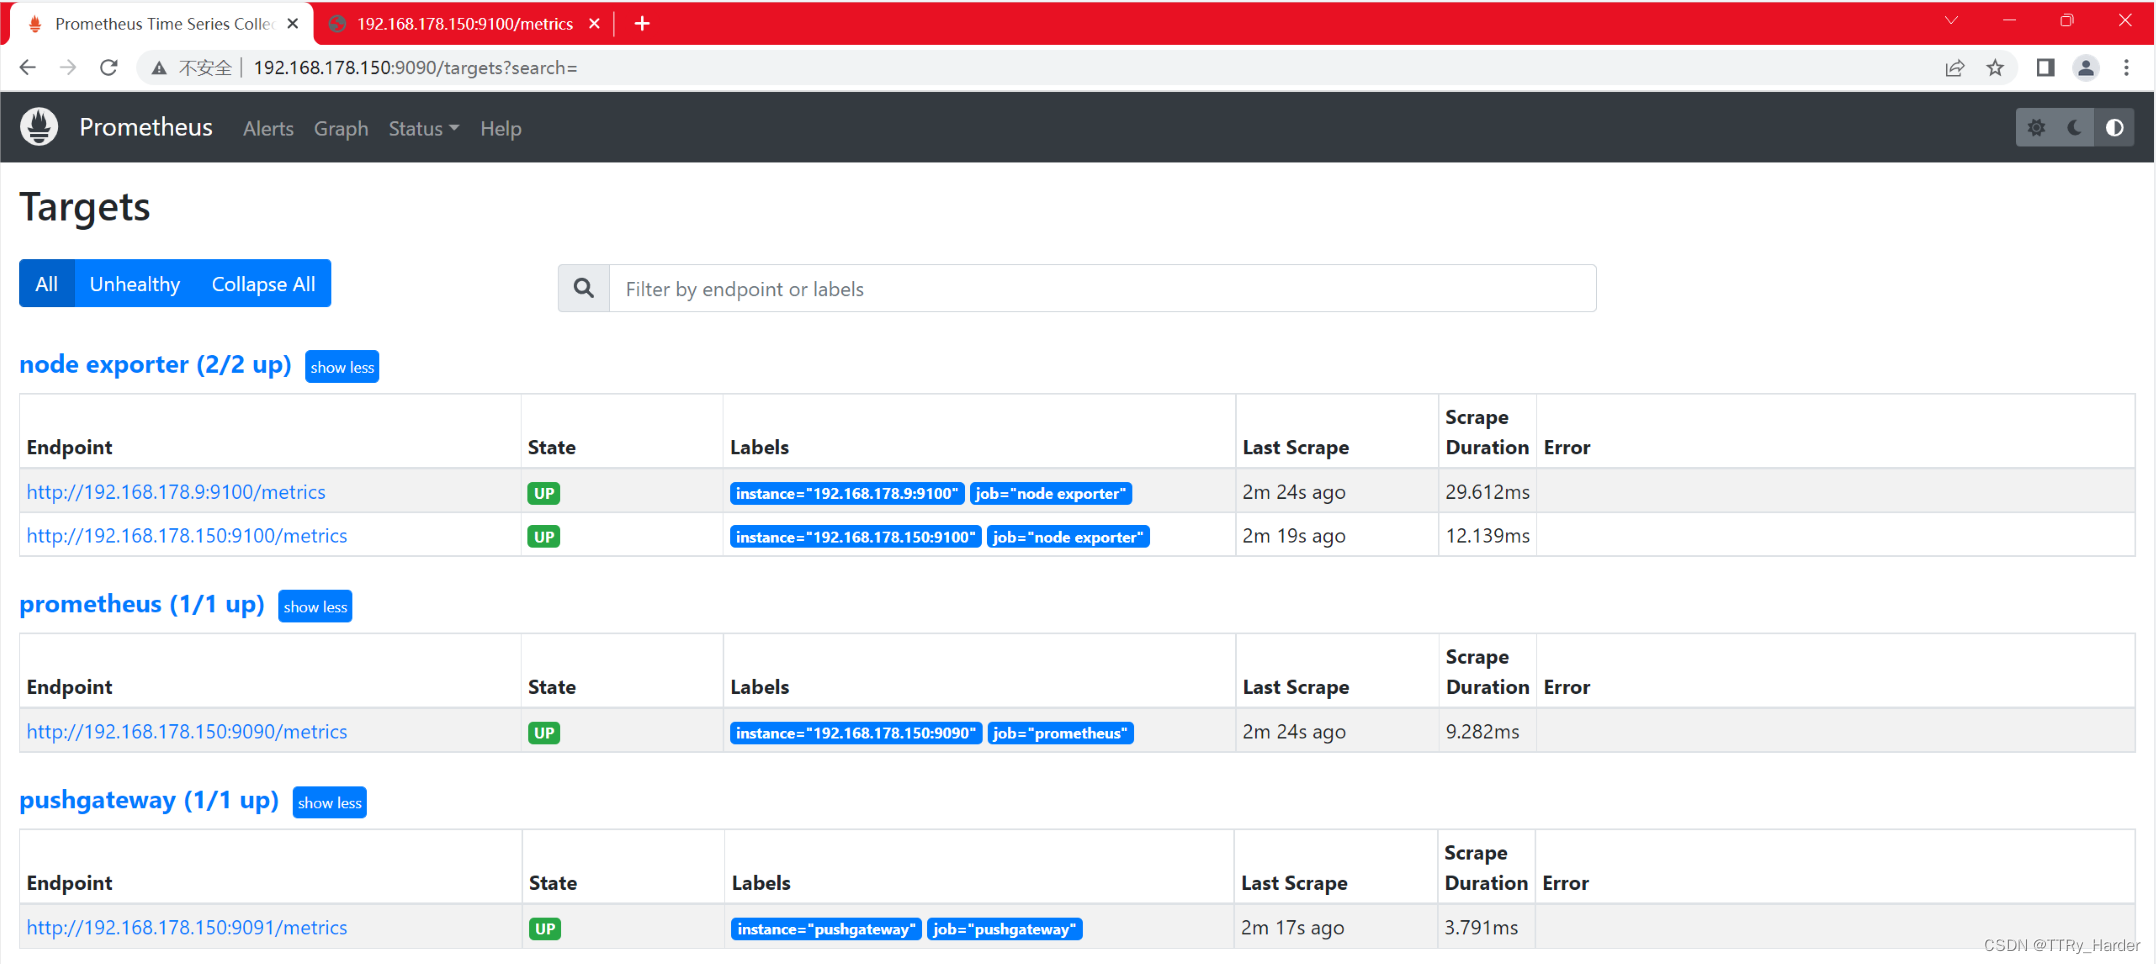
如果想要获取其它机器的上报信息,那么直接给这台下载 node_exporter 进行安装并启动即可;如下图: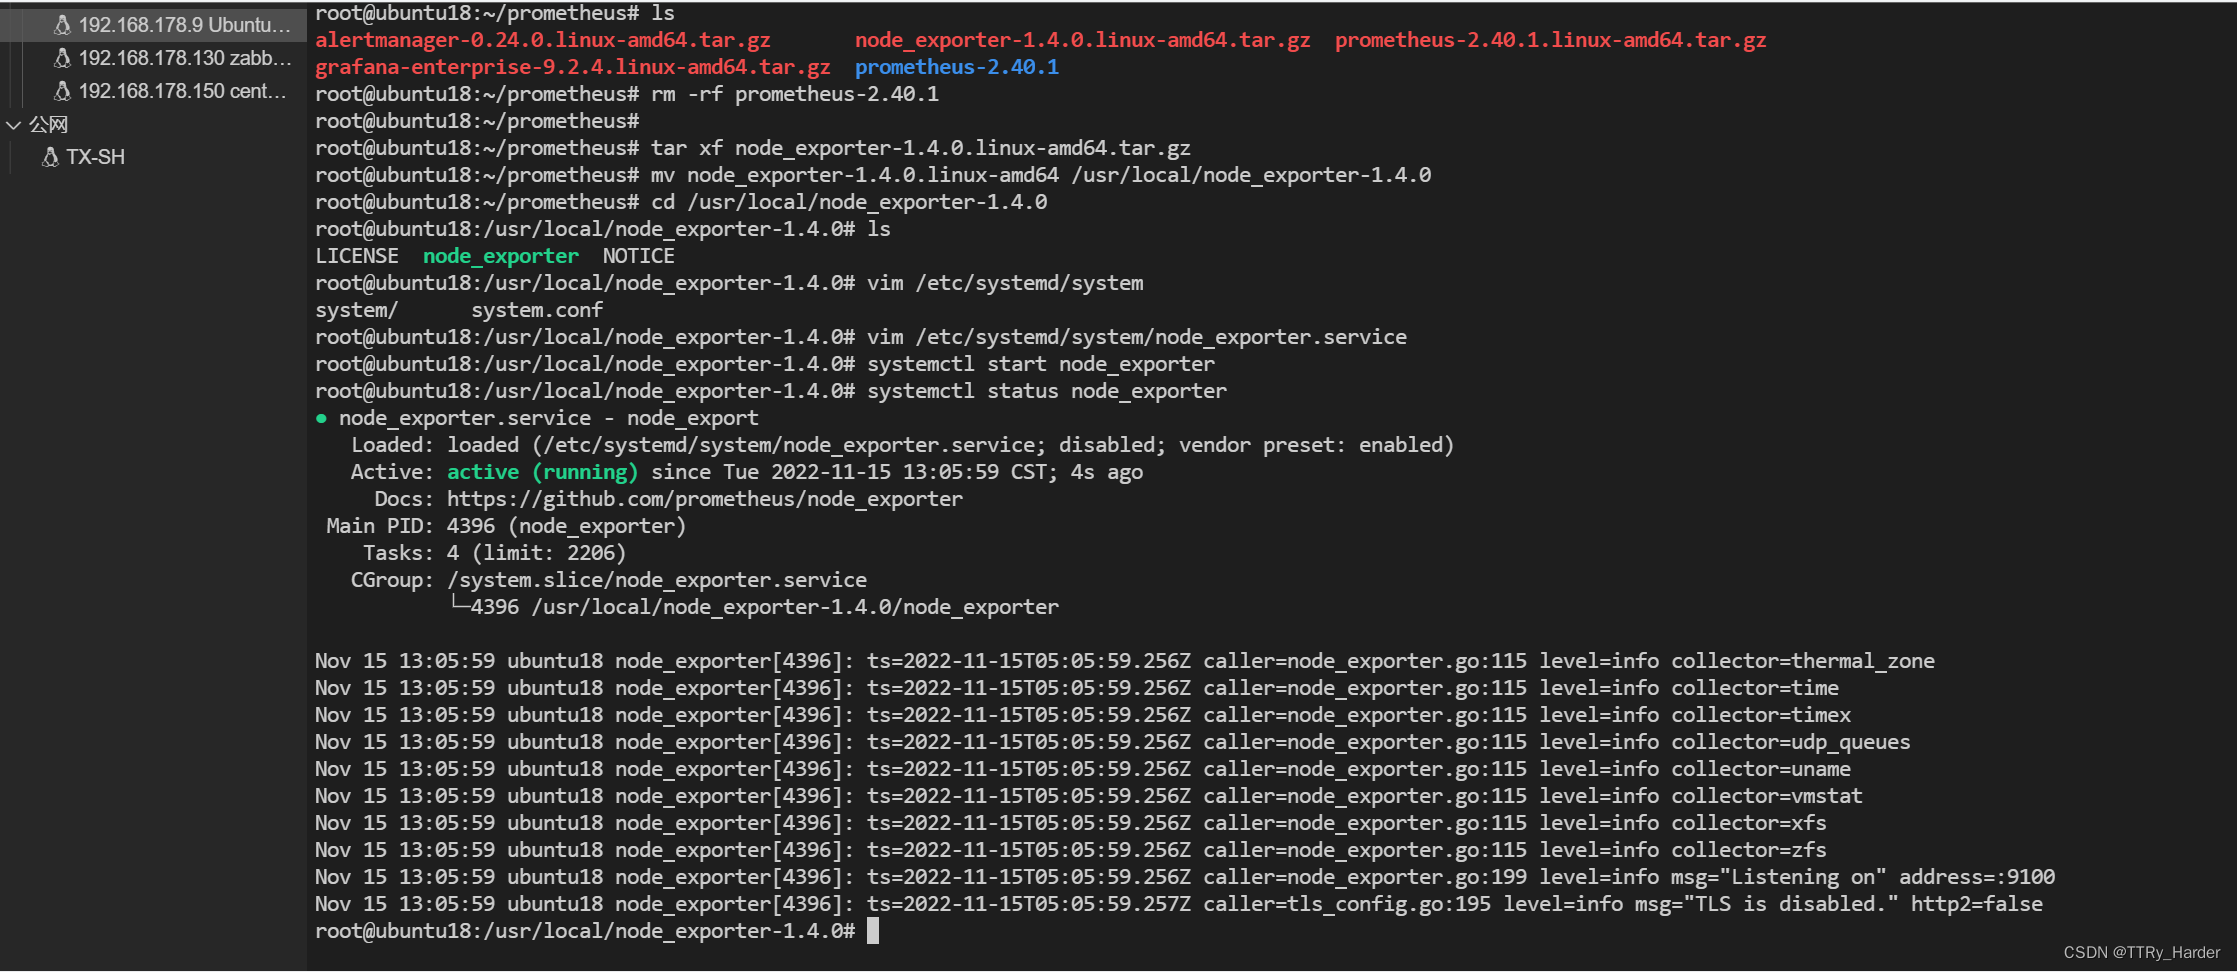
版权归原作者 TTRy_Harder 所有, 如有侵权,请联系我们删除。