
一.实现效果:
Vue3-Vite-Ts数据大屏
二.vue3项目构建:
前言:随着vue2官宣年底停止维护不在提供解决问题的帮助后,vue3+ts+vite大家已经都开始用了,最近也在学习,并结合DataV和Echarts搭建了一个数据大屏,多端自适应,拿来即用!
1.使用vite构建一个vue3项目
npm create vite@latest
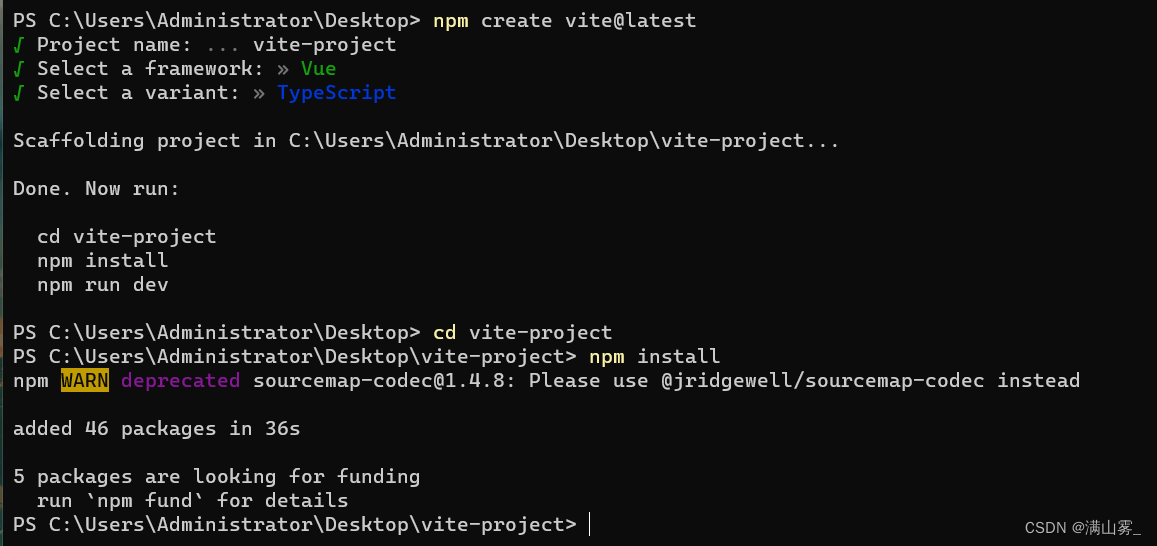
Project name:你的项目名;
Select a framework:框架选择Vue;
Select a variant:语言选择TypeSceript
cd vite-project
npm install
npm run dev
这样你的项目就创建好了
三.安装DataV
这里因为我们用的是Vue3+TS+Vite,所以推荐大家使用下边这个:
DataV
- 安装,此处使用pnpm工具,也可以yarn,npm等:
pnpm install @kjgl77/datav-vue3
- 全局引入:
// main.ts中全局引入
import { createApp } from ‘vue’
import DataVVue3 from ‘@kjgl77/datav-vue3’
const app = createApp(App)
app.use(DataVVue3)
app.mount(‘#app’)
引入后在.vue文件中可以直接使用:
<dv-decoration-1:color="['pink','yellow']"style="width:200px;height:50px;"/>
- 局部引入:
<!-- 在.vue文件的script中import部分组件 --><script lang="ts" setup>import{ Decoration1, Decoration2 }from'@kjgl77/datav-vue3'</script><template><!-- 引入之后就可以在vue的template中直接使用 --><decoration-1:color="['pink','yellow']" style="width:200px;height:50px;"/><decoration-2:reverse="true" style="width:5px;height:150px;"/></template>
安装并配置好以后就可以使用它里边的一些组件了,有炫酷的动态边框、装饰以及一些基本的图表等等,并且有详细的配置项文档可以帮助我们更快地去做排版。本文中展示效果的边框就是使用的DataV中的组件构建的。
四.安装Echarts
npm i echarts -S 或 npm install echarts --save
- 在页面中使用:
import*as echarts from'echarts';import{init, EChartsOption}from'echarts';
- Echarts中文社区网址:
Echarts中文社区
里边有好多炫酷的各类图表,大家可以更具自己业务需求去配置。
五.实现代码:
- 代码中ifrname引入的是canvas实现的粒子效果,大家需要的话可以翻看我的相关博文;
- 需要图片的话留或者私信我。
<template><div class="screen-bg" v-loading="loading"><iframe frameborder="0" src="src/assets/js/index.html" style="width: 100%; height: 100%;z-index: -10"></iframe><div class="container" ref="dataScreenRef"><div class="header"><div class="date">{{currentDate +' '+ str}}</div><div class="title">BOOL数据可视化大屏</div><div class="light"@click="backIndex"><div></div><div></div><div></div><div></div>X</div></div><div class="body"><div class="left" style="flex: 0 1 30%"><dv-border-box1 style="width: 100%;height: 50%;overflow: hidden;" ref="borderRef"><dv-scroll-ranking-board :config="config" style="width:90%;height:90%;margin: 0 auto"/></dv-border-box1><dv-border-box1 style="width: 100%;height: 50%" ref="borderRef"><div id="echart6" style="width: 100%;height: 90%;position: absolute"></div></dv-border-box1></div><div class="central" style="flex: 0 1 60%"><dv-border-box1 ref="borderRef"><div class="mapBox"><img class="imgItem1" src="../../assets/mapImg/lbx.png"><img class="imgItem2" src="../../assets/mapImg/jt.png" alt=""><img class="imgItem3" src="../../assets/mapImg/map.png" alt=""><div style="width: 100%;height: 80%;position: absolute" id="map"/></div></dv-border-box1></div><div class="right" style="flex: 0 1 30%;display: flex;flex-direction: column;justify-content: space-between"><dv-border-box1 ref="borderRef" style="width: 100%;height: 33%;overflow: hidden"><div id="echart5" style="width: 90%;height: 85%;margin: 0 auto"></div></dv-border-box1><dv-border-box1 ref="borderRef" style="width: 100%;height: 33%;overflow: hidden"><div id="echart4" style="width: 90%;height: 85%;margin: 0 auto"></div></dv-border-box1><dv-border-box1 ref="borderRef" style="width: 100%;height: 33%;overflow: hidden"><div id="echart1" style="width: 90%;height: 85%;margin: 0 auto"></div></dv-border-box1></div></div></div></div></template><script setup lang='ts'>import{onMounted, ref, reactive}from'vue';import{useRouter}from"vue-router";import*as echarts from'echarts';import{init, EChartsOption}from'echarts';import mapJson from'./modules/china.json'// console.log(mapJson)// 获取当前时间const currentDate =ref('');const a =["日","一","二","三","四","五","六"];const week =ref(null);const str =ref('');const timeInterval =setInterval(()=>{
currentDate.value =newDate().toLocaleString()
week.value =newDate().getDay();
str.value ="今天是星期"+ a[week.value]},1000)const loading =ref(true)// 获取自适应的盒子const dataScreenRef =ref<HTMLElement |null>(null);// 地图数据const config =reactive({
data:[{
name:'北京市',
value:55,},{
name:'天津市',
value:120,},{
name:'河北省',
value:78,},{
name:'河南省',
value:66,},{
name:'山西省',
value:80,},{
name:'上海市',
value:45,},{
name:'山东省',
value:29,},],
unit:'万辆',})onMounted(()=>{// 初始化时为外层盒子加上缩放属性,防止刷新界面时就已经缩放if(dataScreenRef.value){
dataScreenRef.value.style.transform =`scale(${getScale()}) translate(-50%, -50%)`;
dataScreenRef.value.style.width =`1920px`;
dataScreenRef.value.style.height =`1080px`;}// 初始化echartsinitChart();initChart2();initChart3();initChart4();initChart5();// 为浏览器绑定事件
window.addEventListener("resize", resize);});// 根据浏览器大小推断缩放比例constgetScale=(width =1920, height =1080)=>{let ww = window.innerWidth / width;let wh = window.innerHeight / height;return ww < wh ? ww : wh;};// 监听浏览器 resize 事件constresize=()=>{if(dataScreenRef.value){
dataScreenRef.value.style.transform =`scale(${getScale()}) translate(-50%, -50%)`;}// 使用了 scale 的echarts其实不需要需要重新计算缩放比例// Object.values(dataScreen).forEach(chart => {// chart && chart.resize();// });};// 地图echartsfunctioninitChart(){const myChart =init(document.getElementById('map')as HTMLDivElement)
echarts.registerMap('china', mapJson)const option =<EChartsOption>{
title:{
text:"BOOL T-BOX 全国安装数量",
subtext:"",
x:"center",
textStyle:{
color:'#ffffff'}},
backgroundColor:"transparent",//左侧小导航图标
visualMap:{
min:0,
max:600,
text:["高","低"],
inRange:{
color:["#D8FAFE","#006EDD"]},
textStyle:{
color:'#ffffff'}},
series:[{
name:"中华人民共和国",
type:"map",
top:200,
label:{
normal:{
show:true,
textStyle:{
color:"#fff",
fontSize:15,},},
emphasis:{
textStyle:{
color:"#fff",},},},
itemStyle:{
normal:{// borderWidth: 1.5,
areaColor:"#4c60ff",
borderColor:"#002097",},
emphasis:{
areaColor:"#293fff",
borderWidth:0,
color:"green",},},
zoom:1.4,
roam:false,
map:"china",//使用
data:[//这是数据,500以内的随机数{ name:"北京市", value:"100"},{ name:"天津市", value: Math.round(Math.random()*500)},{ name:"上海市", value: Math.round(Math.random()*500)},{ name:"重庆", value: Math.round(Math.random()*500)},{ name:"河北省", value: Math.round(Math.random()*500)},{ name:"河南省", value: Math.round(Math.random()*500)},{ name:"云南省", value: Math.round(Math.random()*500)},{ name:"辽宁省", value: Math.round(Math.random()*500)},{ name:"黑龙江省", value: Math.round(Math.random()*500)},{ name:"湖南省", value: Math.round(Math.random()*500)},{ name:"安徽省", value: Math.round(Math.random()*500)},{ name:"山东省", value: Math.round(Math.random()*500)},{ name:"新疆维吾尔自治区", value: Math.round(Math.random()*500)},{ name:"江苏省", value: Math.round(Math.random()*500)},{ name:"浙江省", value: Math.round(Math.random()*500)},{ name:"江西省", value: Math.round(Math.random()*500)},{ name:"湖北省", value: Math.round(Math.random()*500)},{ name:"广西省", value: Math.round(Math.random()*500)},{ name:"甘肃省", value: Math.round(Math.random()*500)},{ name:"山西省", value: Math.round(Math.random()*500)},{ name:"内蒙古自治区", value: Math.round(Math.random()*500)},{ name:"陕西省", value: Math.round(Math.random()*500)},{ name:"吉林省", value: Math.round(Math.random()*500)},{ name:"福建省", value: Math.round(Math.random()*500)},{ name:"贵州省", value: Math.round(Math.random()*500)},{ name:"广东省", value: Math.round(Math.random()*500)},{ name:"青海省", value: Math.round(Math.random()*500)},{ name:"西藏自治区", value: Math.round(Math.random()*500)},{ name:"四川省", value: Math.round(Math.random()*500)},{ name:"宁夏回族自治区", value: Math.round(Math.random()*500)},{ name:"海南省", value: Math.round(Math.random()*500)},{ name:"台湾省", value: Math.round(Math.random()*500)},{ name:"香港特别行政区", value: Math.round(Math.random()*500)},{ name:"澳门特别行政区", value: Math.round(Math.random()*500)},{ name:"南海诸岛", value:5},]//数据}],
tooltip:{// 自定义弹窗// 鼠标引入省份,不断触发.params 对象.当前省份的信息.formatter:function(params){// console.log(params);return params.seriesName +"<br>"+ params.name +":"+ params.value +"辆";},}}
myChart.setOption(option)
window.addEventListener("resize",function(){
myChart.resize();});setTimeout(()=>{
loading.value =false},2000)}// 饼图functioninitChart2(){// 基于准备好的dom,初始化echarts实例const myChart =init(document.getElementById('echart6')as HTMLDivElement)let dataStyle ={
normal:{
label:{
show:false},
labelLine:{
show:false},//shadowBlur: 40,//shadowColor: 'rgba(40, 40, 40, 1)',}};let placeHolderStyle ={
normal:{
color:'rgba(255,255,255,.05)',
label:{show:false,},
labelLine:{show:false}},
emphasis:{
color:'rgba(0,0,0,0)'}};let option ={
title:{
text:"T-BOX 全国销量Top5",
subtext:"",
x:"center",
textStyle:{
color:'#ffffff'}},
color:['#0f63d6','#0f78d6','#0f8cd6','#0fa0d6','#0fb4d6'],
tooltip:{
show:true,
formatter:"{a} : {c} 万辆"},
legend:{
itemWidth:10,
itemHeight:10,
itemGap:12,
bottom:'3%',
data:['浙江','上海','广东','北京','深圳'],
textStyle:{
color:'rgba(255,255,255,.6)',}},
series:[{
name:'浙江',
type:'pie',
clockWise:false,
center:['50%','42%'],
radius:['59%','70%'],
itemStyle: dataStyle,
hoverAnimation:false,
data:[{
value:80,
name:'01'},{
value:20,
name:'invisible',
tooltip:{show:false},
itemStyle: placeHolderStyle
}]},{
name:'上海',
type:'pie',
clockWise:false,
center:['50%','42%'],
radius:['49%','60%'],
itemStyle: dataStyle,
hoverAnimation:false,
data:[{
value:70,
name:'02'},{
value:30,
name:'invisible',
tooltip:{show:false},
itemStyle: placeHolderStyle
}]},{
name:'广东',
type:'pie',
clockWise:false,
hoverAnimation:false,
center:['50%','42%'],
radius:['39%','50%'],
itemStyle: dataStyle,
data:[{
value:65,
name:'03'},{
value:35,
name:'invisible',
tooltip:{show:false},
itemStyle: placeHolderStyle
}]},{
name:'北京',
type:'pie',
clockWise:false,
hoverAnimation:false,
center:['50%','42%'],
radius:['29%','40%'],
itemStyle: dataStyle,
data:[{
value:60,
name:'04'},{
value:40,
name:'invisible',
tooltip:{show:false},
itemStyle: placeHolderStyle
}]},{
name:'深圳',
type:'pie',
clockWise:false,
hoverAnimation:false,
center:['50%','42%'],
radius:['20%','30%'],
itemStyle: dataStyle,
data:[{
value:50,
name:'05'},{
value:50,
name:'invisible',
tooltip:{show:false},
itemStyle: placeHolderStyle
}]},]};// 使用刚指定的配置项和数据显示图表。
myChart.setOption(option);}// 柱状图functioninitChart3(){const myChart =init(document.getElementById('echart5')as HTMLDivElement);let option ={
title:{
text:"地域分布",
subtext:"",
x:"center",
textStyle:{
color:'#ffffff'}},// backgroundColor: '#00265f',
tooltip:{
trigger:'axis',
axisPointer:{
type:'shadow'}},
xAxis:[{
type:'category',
data:['浙江','上海','江苏','广东','北京','深圳','安徽','四川'],
axisLine:{
show:true,
lineStyle:{
color:"rgba(255,255,255,.1)",
width:1,
type:"solid"},},
axisTick:{
show:false,},
axisLabel:{
interval:0,// rotate:50,
show:true,
splitNumber:15,
textStyle:{
color:"rgba(255,255,255,.6)",
fontSize:'12',},},}],
yAxis:[{
type:'value',
axisLabel:{//formatter: '{value} %'
show:true,
textStyle:{
color:"rgba(255,255,255,.6)",
fontSize:'12',},},
axisTick:{
show:false,},
axisLine:{
show:true,
lineStyle:{
color:"rgba(255,255,255,.1 )",
width:1,
type:"solid"},},
splitLine:{
lineStyle:{
color:"rgba(255,255,255,.1)",}}}],
series:[{
type:'bar',
data:[2,3,3,9,15,12,6,4,6,7,4,10],
barWidth:'35%',//柱子宽度// barGap: 1, //柱子之间间距
itemStyle:{
normal:{
color:'#27d08a',
opacity:1,
barBorderRadius:5,}}}]};// 使用刚指定的配置项和数据显示图表。
myChart.setOption(option);}// 折线图functioninitChart4(){const myChart =init(document.getElementById('echart4')as HTMLDivElement);let option ={
title:{
text:"产品对比",
subtext:"",
x:"center",
textStyle:{
color:'#ffffff'}},
tooltip:{
trigger:'axis',
axisPointer:{
lineStyle:{
color:'#dddc6b'}}},
legend:{// top: '0%',
orient:'vertical',
x:'right',//可设定图例在左、右、居中
data:['T-Box','OBD检测设备'],
textStyle:{
color:'rgba(255,255,255,.5)',
fontSize:'12',}},// grid: {// left: '10',// top: '30',// right: '10',// bottom: '10',// containLabel: true// },
xAxis:[{
type:'category',
boundaryGap:false,
axisLabel:{
textStyle:{
color:"rgba(255,255,255,.6)",
fontSize:12,},},
axisLine:{
lineStyle:{
color:'rgba(255,255,255,.2)'}},
data:['01','02','03','04','05','06','07','08','09','11','12','13','14','15','16','17','18','19','20','21','22','23','24']},{
axisPointer:{show:false},
axisLine:{show:false},
position:'bottom',
offset:20,}],
yAxis:[{
type:'value',
axisTick:{show:false},
axisLine:{
lineStyle:{
color:'rgba(255,255,255,.1)'}},
axisLabel:{
textStyle:{
color:"rgba(255,255,255,.6)",
fontSize:12,},},
splitLine:{
lineStyle:{
color:'rgba(255,255,255,.1)'}}}],
series:[{
name:'T-Box',
type:'line',
smooth:true,symbol:'circle',
symbolSize:5,
showSymbol:false,
lineStyle:{
normal:{
color:'#0184d5',
width:2}},
areaStyle:{
normal:{
color:newecharts.graphic.LinearGradient(0,0,0,1,[{
offset:0,
color:'rgba(1, 132, 213, 0.4)'},{
offset:0.8,
color:'rgba(1, 132, 213, 0.1)'}],false),
shadowColor:'rgba(0, 0, 0, 0.1)',}},
itemStyle:{
normal:{
color:'#0184d5',
borderColor:'rgba(221, 220, 107, .1)',
borderWidth:12}},
data:[3,4,3,4,3,4,3,6,2,4,2,4,3,4,3,4,3,4,3,6,2,4,2,4]},{
name:'OBD检测设备',
type:'line',
smooth:true,symbol:'circle',
symbolSize:5,
showSymbol:false,
lineStyle:{
normal:{
color:'#00d887',
width:2}},
areaStyle:{
normal:{
color:newecharts.graphic.LinearGradient(0,0,0,1,[{
offset:0,
color:'rgba(0, 216, 135, 0.4)'},{
offset:0.8,
color:'rgba(0, 216, 135, 0.1)'}],false),
shadowColor:'rgba(0, 0, 0, 0.1)',}},
itemStyle:{
normal:{
color:'#00d887',
borderColor:'rgba(221, 220, 107, .1)',
borderWidth:12}},
data:[5,3,5,6,1,5,3,5,6,4,6,4,8,3,5,6,1,5,3,7,2,5,1,4]},]};// 使用刚指定的配置项和数据显示图表。
myChart.setOption(option);}// 行业分布functioninitChart5(){const myChart =init(document.getElementById('echart1')as HTMLDivElement);let option ={
title:{
text:"行业分布",
subtext:"",
x:"center",
textStyle:{
color:'#ffffff'}},// backgroundColor: '#00265f',
tooltip:{
trigger:'axis',
axisPointer:{
type:'shadow'}},// grid: {// left: '0%',// top: '10px',// right: '0%',// bottom: '4%',// containLabel: true// },
xAxis:[{
type:'category',
data:['商超门店','教育培训','房地产','生活服务','汽车销售','旅游酒店','五金建材'],
axisLine:{
show:true,
lineStyle:{
color:"rgba(255,255,255,.1)",
width:1,
type:"solid"},},
axisTick:{
show:false,},
axisLabel:{
interval:0,// rotate:50,
show:true,
splitNumber:15,
textStyle:{
color:"rgba(255,255,255,.6)",
fontSize:'12',},},}],
yAxis:[{
type:'value',
axisLabel:{//formatter: '{value} %'
show:true,
textStyle:{
color:"rgba(255,255,255,.6)",
fontSize:'12',},},
axisTick:{
show:false,},
axisLine:{
show:true,
lineStyle:{
color:"rgba(255,255,255,.1 )",
width:1,
type:"solid"},},
splitLine:{
lineStyle:{
color:"rgba(255,255,255,.1)",}}}],
series:[{
type:'bar',
data:[200,300,300,900,1500,1200,600],
barWidth:'35%',//柱子宽度// barGap: 1, //柱子之间间距
itemStyle:{
normal:{
color:'#2f89cf',
opacity:1,
barBorderRadius:5,}}}]};// 使用刚指定的配置项和数据显示图表。
myChart.setOption(option);}// 返回首页const router =useRouter();functionbackIndex(){// console.log('关闭');
router.push('/')}</script><style scoped lang='scss'>// 背景.screen-bg {
width:100%;
height:100%;.light {
width: 40px;
height: 30px;
position: absolute;
top: 37px;
right: 50px;
z-index:99999;
transform:translate(-50%,-50%);/* width: fit-content; */
text-align: center;
line-height: 30px;
color: #ffffff;
font-size: 20px;
text-transform: uppercase;
transition:0.5s;
letter-spacing: 4px;
cursor: pointer;
overflow: hidden;}.light:hover {
background-color: #ffffff;
color: #050801;
box-shadow:00 5px #ffffff,00 25px #ffffff,00 50px #ffffff,00 200px #ffffff;}.light div {
position: absolute;}.light div:nth-child(1){
width:100%;
height: 2px;
top:0;
left:-100%;
background: linear-gradient(to right, transparent, #ffffff);
animation: animate1 1s linear infinite;}.light div:nth-child(2){
width: 2px;
height:100%;
top:-100%;
right:0;
background: linear-gradient(to bottom, transparent, #ffffff);
animation: animate2 1s linear infinite;
animation-delay:0.25s;}.light div:nth-child(3){
width:100%;
height: 2px;
bottom:0;
right:-100%;
background: linear-gradient(to left, transparent, #ffffff);
animation: animate3 1s linear infinite;
animation-delay:0.5s;}.light div:nth-child(4){
width: 2px;
height:100%;
bottom:-100%;
left:0;
background: linear-gradient(to top, transparent, #ffffff);
animation: animate4 1s linear infinite;
animation-delay:0.75s;}@keyframes animate1 {0%{
left:-100%;}50%,100%{
left:100%;}}@keyframes animate2 {0%{
top:-100%;}50%,100%{
top:100%;}}@keyframes animate3 {0%{
right:-100%;}50%,100%{
right:100%;}}@keyframes animate4 {0%{
bottom:-100%;}50%,100%{
bottom:100%;}}// 中心容器.container {
position: fixed;
top:50%;
left:50%;
z-index:999;
display: flex;
flex-direction: column;
overflow: hidden;
transition: all 0.3s;
transform-origin: left top;/*!* 设置一个最小的宽度 *!*/
min-width: 1800px;/* 设置一个最大的宽度 */
max-width: 1800px;
margin:0 auto;
padding-top: 10px;.header {
position: relative;/*height: 5.2rem;*/
height: 77px;
margin-bottom: 10px;
background-image:url('@/assets/dataScreen/pic-12.png');
background-repeat: no-repeat;
background-size:100%100%;.date {
position: absolute;
left: 100px;
top:55%;
transform:translateY(-50%);
font-family: FZHei-B01S, Arial, sans-serif;
font-size: 20px;
color:rgb(255,255,255);
font-weight: normal;
justify-content: center;
text-align: center;}.title {
position: absolute;
left:50%;
top:50%;
transform:translate(-50%,-50%);
font-family: FZHei-B01S, Arial, sans-serif;
font-size: 30px;
color:rgb(255,255,255);
font-weight: normal;
justify-content: center;
text-align: center;}}.body {
height:100%;/*background: greenyellow;*/
display: flex;
justify-content: space-between;}}.mapBox {
width:100%;
height:100%;
color: #ffffff;
display: flex;
align-items: center;
justify-content: center;.imgItem1 {
width:90%;
height:80%;
position: absolute;
animation: rotate 10s linear infinite;}.imgItem2 {/*width: 90%;*//*height: 80%;*/
position: absolute;
animation: rotate2 10s linear infinite;}@keyframes rotate {100%{
transform:rotate(360deg);}}@keyframes rotate2 {100%{
transform:rotate(-360deg);}}}::v-deep .dv-border-box-1.border-box-content{
display: flex !important;
align-items: center !important;}</style>
六.地图数据工具:
推荐大家使用阿里云的数据可视化平台后续会整理一期这个平台的使用方法。
数据可视化平台后
七.留在最后:
感谢大家对我的支持; 如果我的博文可以帮到大家,记得点个关注一键三连哦;
乾坤未定,你我皆是黑马!!
本文转载自: https://blog.csdn.net/JingDuo0909/article/details/129441974
版权归原作者 忆凡_ 所有, 如有侵权,请联系我们删除。
版权归原作者 忆凡_ 所有, 如有侵权,请联系我们删除。