
前言
和高德地图,百度地图,腾讯地图,Arcgis一样,OpenLayers是一个用于开发WebGIS客户端的JavaScript包。它有自带的api在线说明官方文档:https://openlayers.org/。也有中文api网站:http://linwei.xyz/ol3-primer/ch01/index.html。
openLayers依赖包npm安装: npm install ol --save
openLayers依赖包yarn安装: yarn add ol --save
一、openLayers实现电子图层离线加载
安装完成openLayers依赖之后首先要进行地图容器以及底图的绘制。底图是热力图等特效图层的基本承载。
现以vue框架为例:
<template>
  <div>
    <div id="map" class="map"></div>  // 底图根据id加载与div上
  </div>
</template>
<script>
   import "ol/ol.css";
   // 官方地图源
  import OSM from "ol/source/OSM.js";
  import { Map, View } from "ol";
  import { defaults as defaultControls } from "ol/control";
  import {Tile as TileLayer} from "ol/layer";
  import DragPan from 'ol/interaction/DragPan'//先在项目中引用此包
  export default {
    data() {
      return {
        map: null,
      };
    },
    created() {},
    mounted() {
      this.initMap();
    },
    methods: {
      // 初始化地图
      initMap() {
        // 地图底图源使用OSM,当然也可以用其他风格的源
        const raster = new TileLayer({
          source: new OSM(),
        });
        this.map = new Map({
          target: "map",
          controls: defaultControls({
            zoom: false, // 隐藏缩放按钮,false为隐藏,true为显示
          }).extend([]),
          layers: [
            raster
          ],
          view: new View({
              // 除了EPSG:4326坐标系还有EPSG:3857,统一即可
            projection: "EPSG:4326",
            center: [11.964483155944814,13.87500286102295],
            zoom: 0,
            // maxZoom: 19,
            // minZoom: 5,
          }),
        });
        // 禁止地图拖拽
        this.disablePanMove();
        // 禁用鼠标滚轮事件
        this.map.getView().setMinZoom(0);
        this.map.getView().setMaxZoom(0);
      },
      // 禁用地图拖拽时间
      disablePanMove(){
        let pan = null;
        this.map.getInteractions().forEach(element => {
          if (element instanceof DragPan) {
            pan = element
          }
        });
        pan.setActive(false); //false禁止拖拽,true允许拖拽
      }
    },
  };
</script>
<style lang="less" scoped>
  .map{
    width: 100%;
    height:600px;
  }
</style>
地图效果:
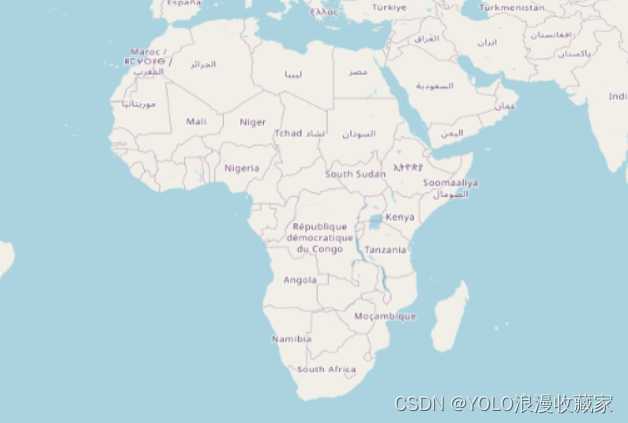
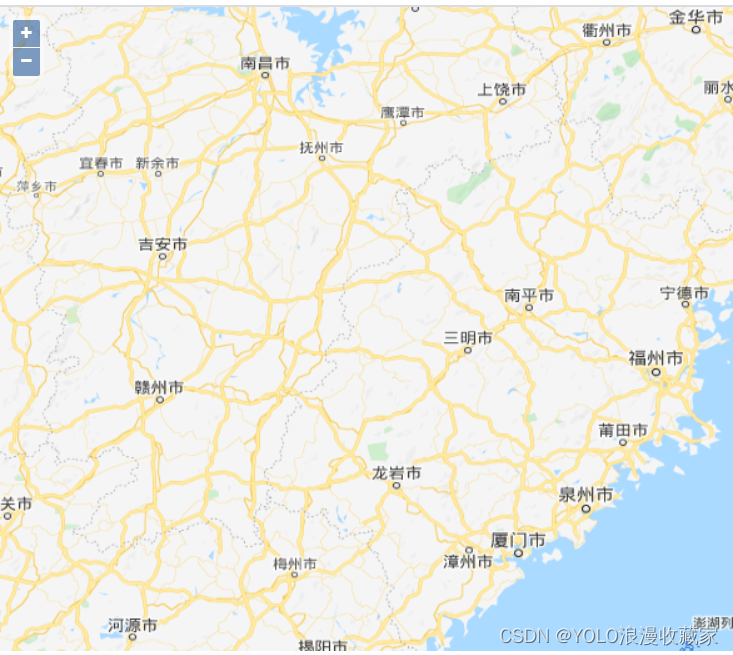
以上是在线地图加载的全部示例代码,实际上电子地图源除了使用官方地图源还可以使用其他地图源:http://map.geoq.cn/ArcGIS/rest/services/ChinaOnlineStreetPurplishBlue/MapServer/tile/{z}/{y}/{x}
const raster = new TileLayer({
    source: new XYZ({
      url:
     "http://map.geoq.cn/ArcGIS/rest/services/ChinaOnlineStreetPurplishBlue/MapServer/tile/{z}/{y}/{x}",
     }),
 });
呈现效果:

使用其他源时候需要将引入的osm官方源替换为可以自动获取当前展示位置xyz的依赖:
import OSM from "ol/source/OSM.js";
替换为:
import XYZ from "ol/source/XYZ";
以上都是在线的时候,当运行环境为内网,无法连接外部互联网的时候呢?
这个时候需要进行离线地图加载操作了。首先下载离线地图下载器,在这里推荐一款免安装地图图片下载器:
https://download.csdn.net/download/qq_39958056/87450369?spm=1001.2014.3001.5503

下载以后的样式:
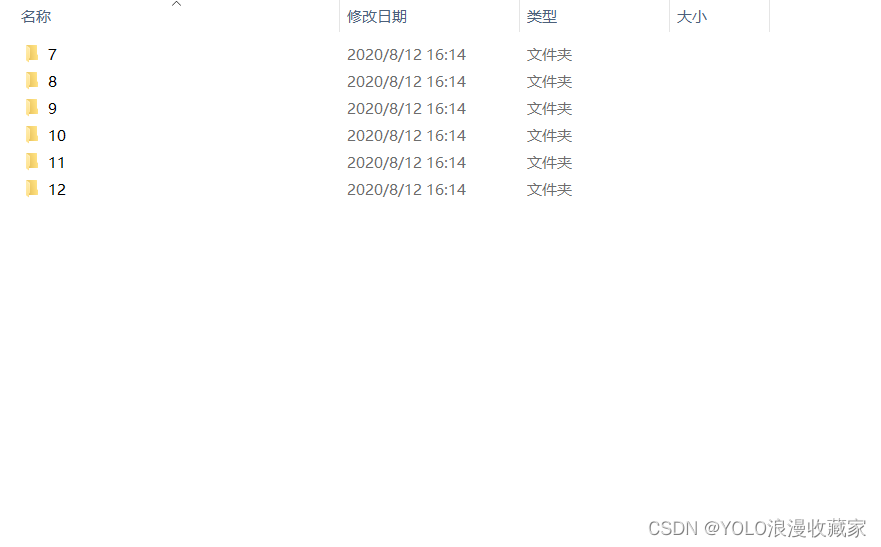
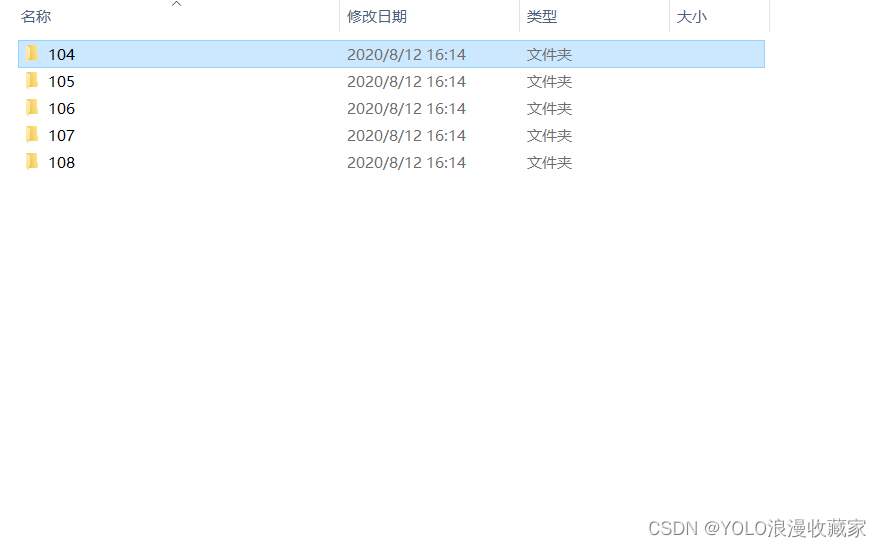

将这些数据有static静态目录的放在static静态目录下,没有的放在public 目录下:
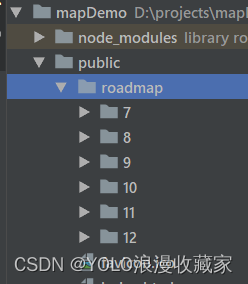
这时候只需要把电子地图的源替换为放在public目录下的存放底图图片的文件夹即可:
const raster = new TileLayer({
  source: new XYZ({
    url:'/roadmap/{z}/{x}/{y}.png',//本例中地图瓦片保存在public目录下的roadmap文件夹目录下
    }),
});
展示效果:
离线地图加载成功!
二、openLayers实现热力图层绘制及加载
添加热力图所需要引用依赖:
import {Map, View, Feature} from "ol";
import "ol/ol.css";
import VectorLayer from "ol/layer/Vector";
import XYZ from "ol/source/XYZ";
import {Heatmap as HeatmapLayer, Tile as TileLayer} from 'ol/layer.js'
import VectorSource from 'ol/source/Vector.js'
绘制底图方法:
initMap() {
  const raster = new TileLayer({
    source: new XYZ({
      url:'/roadmap/{z}/{x}/{y}.png',//本例中地图瓦片保存在当前静态资源目录下
    }),
  });
  this.map = new Map({
    target: 'map',
    // 在layers中添加自己所需要的图层,这里不做添加,只添加热力图层
    layers: [
      raster
    ],
    view: new View({
      projection: "EPSG:4326",
      // EPSG:3857
      center: [120.92898835156248, 23.6828209384589], // 中心点
      zoom: 7, // 地图放大倍数
      minZoom: 7 // 地图最小倍数
    }),
  });
}
添加热力图方法:
initMap() {
  const raster = new TileLayer({
    source: new XYZ({
      url:'/roadmap/{z}/{x}/{y}.png',//本例中地图瓦片保存在当前静态资源目录下
    }),
  });
  this.map = new Map({
    target: 'map',
    // 在layers中添加自己所需要的图层,这里不做添加,只添加热力图层
    layers: [
      raster
    ],
    view: new View({
      projection: "EPSG:4326",
      // EPSG:3857
      center: [120.92898835156248, 23.6828209384589], // 中心点
      zoom: 7, // 地图放大倍数
      minZoom: 7 // 地图最小倍数
    }),
  });
}
addHeatArea(heatData) {
  // 创建一个热力图层
  let vector = new HeatmapLayer({
    // 矢量数据源
    source: new VectorSource({
      features: (new GeoJSON()).readFeatures(heatData, {
        dataProjection: 'EPSG:4326',
        featureProjection: 'EPSG:4326'
      }),
    }),
    blur: 20, // 模糊尺寸
    radius: 20 // 热点半径
  });
  this.map.addLayer(vector); // 将热力图添加在地图上
},
热力图假数据:
// 热力图假数据,照这个形式来进行传输就行
heatData: {
  type: 'FeatureCollection',
  features: [
    {
      type: 'Point', 'coordinates': [
        120.36293,
        23.53477
      ], count: 100
    },
    {type: 'Point', 'coordinates': [120.45631, 23.76611], count: 19},
    {type: 'Point', 'coordinates': [120.78590, 23.51464], count: 419},
    {type: 'Point', 'coordinates': [121.58241, 25.06584], count: 319},
    {type: 'Point', 'coordinates': [120.3903, 22.73204], count: 719},
    {type: 'Point', 'coordinates': [121.09901, 22.80292], count: 519},
    {type: 'Point', 'coordinates': [120.22011, 23.10624], count: 319},
    {type: 'Point', 'coordinates': [120.67604, 24.26258], count: 139},
    {type: 'Point', 'coordinates': [121.56593, 24.01208], count: 129},
  ]
},
呈现效果:

三、openLayers实现行政区划边界绘制
进行行政区划绘制所需要引用依赖:
import {Map, View, Feature} from "ol";
import {Style, Stroke, Fill} from "ol/style";
import {Polygon, MultiPolygon} from "ol/geom"
import "ol/ol.css";
import VectorLayer from "ol/layer/Vector";
import XYZ from "ol/source/XYZ";
import {Tile as TileLayer} from 'ol/layer.js'
import VectorSource from 'ol/source/Vector.js'
import GeoJSON from 'ol/format/GeoJSON'
底图绘制参见上文。
行政区划绘制方法:
// 设置区域
addArea(geo) {
  let features = [];
  geo.forEach((g) => {
    let lineData = g.geometry;
    let routeFeature = "";
    if (lineData.type === "MultiPolygon") {
      routeFeature = new Feature({
        geometry: new MultiPolygon(lineData.coordinates),
      });
    } else if (lineData.type === "Polygon") {
      routeFeature = new Feature({
        geometry: new Polygon(lineData.coordinates),
      });
    }
    routeFeature.setStyle(
      new Style({
        fill: new Fill({
          color: "#4e98f444", //填充颜色
        }),
        stroke: new Stroke({
          width: 1, //边界宽度
          color: [71, 137, 227, 1], //边界颜色
        }),
      })
    );
    features.push(routeFeature);
  });
  // 设置图层
  this.routeLayer = new VectorLayer({
    source: new VectorSource({
      features: features,
    }),
  });
  // 添加图层
  this.map.addLayer(this.routeLayer);
},
实现效果:

边界json数据格式示例:
{
  "type": "FeatureCollection",
  "features": [
    {
      "type": "Feature",
      "properties": {
        "adcode": 110101,
        "name": "东城区",
        "center": [
          116.418757,
          39.917544
        ],
        "centroid": [
          116.416739,
          39.912912
        ],
        "childrenNum": 0,
        "level": "district",
        "acroutes": [
          100000,
          110000
        ],
        "parent": {
          "adcode": 110000
        }
      },
      "geometry": {
        "type": "MultiPolygon",
        // 边界坐标数据,数据过多不一一展示
        "coordinates": [
          [
            [
              [
                116.387664,
                39.960923
              ],
              [
                116.38948,
                39.961038
              ]
            ]
          ]
        ]
      }
    }
  ]
}
想获取行政区边界数据可以在此网站获取:
http://datav.aliyun.com/tools/atlas/#&lat=35.24561909420681&lng=104.2822265625&zoom=4
四、openLayers实现地图标点
进行地图标点需要引用依赖:
import {Map, View, Feature} from "ol";
import {Style, Icon, Text, Fill} from "ol/style";
import {Point} from "ol/geom"
import "ol/ol.css";
import VectorLayer from "ol/layer/Vector";
import XYZ from "ol/source/XYZ";
import {Tile as TileLayer} from 'ol/layer.js'
import VectorSource from 'ol/source/Vector.js'
import pointImg from '../assets/point.png'
底图绘制参见上文。
openLayers打点方法:
addIconMarker(data) {
    let features = []; // 标点列表存放路径
    data.map((item)=>{
      const marker = new Feature({
        name:item.name, // 标点的附属属性可以以该形式放在此处,如type:item.type
        geometry: new Point(item.location)
      });
      marker.setStyle(new Style({
          image: new Icon({
            anchor: [0.5, 1],
            scale: 0.05, // 图片放缩程度
            src: pointImg // 标点图片路径
         }),
         // 设置图片下面显示字体的样式和内容
         text: new Text({
            text: item.name,// 添加文字描述
            font: '14px font-size', // 设置字体大小
            fill: new Fill({// 设置字体颜色
              color: [71, 137, 227, 1]
            }),
            offsetY: 10// 设置文字偏移量
          })
      })
    );
   })
  const vectorLayer = new VectorLayer({
    source: new VectorSource({
      features: features,
    })
  });
  this.map.addLayer(vectorLayer);
}
打点假json数据格式示例:
pointData: [
  {
    name: '台北',
    location: [121.50,25.03]
  },
  {
    name: '高雄',
    location: [120.28,22.62]
  },
  {
    name: '台南',
    location: [120.20,23.00]
  },
  {
    name: '台中',
    location: [120.67,24.15]
  },
  {
    name: '基隆',
    location: [121.73,25.13]
  },
  {
    name: '花莲',
    location: [121.60,23.98]
  },
  {
    name: '桃园',
    location: [121.30,24.97]
  },
  {
    name: '新竹',
    location: [120.95,24.82]
  },
  {
    name: '嘉义',
    location: [120.43,23.48]
  },
]
实现效果:

图标点击事件确定:
底层逻辑:鼠标点击地图先触发地图的点击事件,把该点击事件用方法forEachFeatureAtPixel进行判断,如果是点击的图标则会返回图标以及其属性,若是点击的图片的其他地方(非标点)则会返回undefined。
该地图点击事件放于mounted()里面也可以放进initMap,也就是创建地图底图方法里面;
// 地图点击触发事件
this.map.on("click", e=>{
    // 判断是不是移动到图标之上
    const feature = this.map.forEachFeatureAtPixel(e.pixel,feature=>{
        return feature;
    });
    // 如果移动到图标上就继续进行下一步操作
    if(feature){
        // 获取到上面预先设置的属性
        console.info(feature.values_.name);
    }
});
五、openLayers实现文字标注
实现文字标注和打点同理,只不过不需要加载图片。
但是注意,所有的不管是带点的文字标识还是不带点的,只能以字符串形式呈现,不能使用字符串夹杂number形式。
进行文字标注需要引用依赖:
import {Map, View, Feature} from "ol";
import {Style, Text, Fill} from "ol/style";
import {Point} from "ol/geom"
import "ol/ol.css";
import VectorLayer from "ol/layer/Vector"; // 矢量地图
import XYZ from "ol/source/XYZ";
import {Tile as TileLayer} from 'ol/layer.js' // 电子地图
import VectorSource from 'ol/source/Vector.js' // 矢量地图源
底图绘制参见上文。
openLayers打点方法:
addTextMarker(data) {
    let features = []; // 文字标点列表存放路径
    data.map((item)=>{
      const marker = new Feature({
        name:item.name, // 标点的附属属性可以以该形式放在此处,如type:item.type
        geometry: new Point(item.location)
      });
      marker.setStyle(new Style({
         // 进行文字标点的字体的样式和内容
         text: new Text({
            text: item.name,// 添加文字描述
            font: '14px font-size', // 设置字体大小
            fill: new Fill({// 设置字体颜色
              color: [71, 137, 227, 1]
            }),
            offsetY: 0// 设置文字偏移量
          })
      })
    );
   })
  const vectorLayer = new VectorLayer({
    source: new VectorSource({
      features: features,
    })
  });
  this.map.addLayer(vectorLayer);
}
打点假json数据格式示例:
pointData: [
  {
    name: '台北',
    location: [121.50,25.03]
  },
  {
    name: '高雄',
    location: [120.28,22.62]
  },
  {
    name: '台南',
    location: [120.20,23.00]
  },
  {
    name: '台中',
    location: [120.67,24.15]
  },
  {
    name: '基隆',
    location: [121.73,25.13]
  },
  {
    name: '花莲',
    location: [121.60,23.98]
  },
  {
    name: '桃园',
    location: [121.30,24.97]
  },
  {
    name: '新竹',
    location: [120.95,24.82]
  },
  {
    name: '嘉义',
    location: [120.43,23.48]
  },
]
实现效果:

六、openLayers实现地图弹窗
实现地图弹窗的依赖引入:
import {Map, View, Feature, Overlay} from "ol"; // 比绘制底图多引入了一个Overlay
import "ol/ol.css";
import VectorLayer from "ol/layer/Vector";
import XYZ from "ol/source/XYZ";
import {Tile as TileLayer} from 'ol/layer.js'
import VectorSource from 'ol/source/Vector.js'
加载地图弹窗的dom结构:
<template>
  <div>
    <div id="map" class="map"></div>  // 底图根据id加载与div上
    <div ref="popOut">/*div中可以放置弹窗内容*/</div>
  </div>
</template>
地图弹窗的创建和加载要放在创建底图的方法里面:
initMap() {
  // 电子地图实例创建
  const raster = new TileLayer({
      source: new XYZ({
      url:'/roadmap/{z}/{x}/{y}.png',//本例中地图瓦片保存在当前静态目录下
    }),
  });
  // 弹窗实例的创建
  this.overLayer = new Overlay({
    element:this.$refs.popOut, // 弹窗所加载到dom结构
    autoPan:true, // 若弹窗在底图边缘,底图会移动
    // 底图移动动画
    autoPanAnimation:{
      duration:250
    }
  });
  this.map = new Map({
    target: 'map', // 地图实例所加载上的dom结构
    // 在layers中添加自己所需要的图层
    layers: [raster],
    overlays:[this.overLayer], // 弹窗图层添加
    view: new View({
      projection: "EPSG:4326", // 视图所使用的坐标系
      // EPSG:3857
      center: [120.92898835156248, 23.6828209384589], // 中心点
      zoom: 7, // 地图放大倍数
      minZoom: 7 // 地图最小倍数
    }),
  });
  // 地图点击触发事件
  this.map.on("click", e=>{
    // 判断是不是移动到图标之上
    const feature = this.map.forEachFeatureAtPixel(e.pixel,feature=>{
      return feature;
    });
    // 如果移动到图标上就继续进行下一步操作
    if(feature){
      // 设定弹窗位置
      this.overLayer.setPosition(e.coordinate);
      // 获取到上面预先设置的属性,可以根据获取预先设置的属性来改变弹窗内容
      console.info(feature.values_.name);
    }else{
      // 取消弹窗显示
      this.overLayer.setPosition(undefined);
    }
  });
},
不光如此,还得有实现地图打点的方法,地图打点方法参见上文。
实现地图弹窗的所有代码:
<template>
  <div >
    <div id="map" class="map"></div>  // 底图根据id加载与div上
    <div ref="popOut" class="pop">/*div中可以放置弹窗内容*/</div>
  </div>
</template>
<script>
  import {Map, View, Feature,Overlay} from "ol";
  import {Style, Icon, Text, Fill} from "ol/style";
  import {Point} from "ol/geom";
  import "ol/ol.css";
  import VectorLayer from "ol/layer/Vector"; // 矢量图层
  import OSM from "ol/source/OSM.js"; // 官方电子地图源
  import {Tile as TileLayer} from 'ol/layer.js' // 电子地图
  import VectorSource from 'ol/source/Vector.js' // 矢量地图源
  import pointImg from '../assets/point.png' // 打点图片
  export default {
    name: 'mapDemo',
    data() {
      return {
        pointImg,
        map: null,
        overLayer:null,
        // 点数据
        pointData: [
          {
            name: '台北',
            location: [121.50,25.03]
          },
          {
            name: '高雄',
            location: [120.28,22.62]
          },
          {
            name: '台南',
            location: [120.20,23.00]
          },
          {
            name: '台中',
            location: [120.67,24.15]
          },
          {
            name: '基隆',
            location: [121.73,25.13]
          },
          {
            name: '花莲',
            location: [121.60,23.98]
          },
          {
            name: '桃园',
            location: [121.30,24.97]
          },
          {
            name: '新竹',
            location: [120.95,24.82]
          },
          {
            name: '嘉义',
            location: [120.43,23.48]
          },
        ],
      }
    },
    methods: {
      initMap() {
        // 电子地图实例创建
        const raster = new TileLayer({
              source: new XYZ({
              url:'/roadmap/{z}/{x}/{y}.png',//本例中地图瓦片保存在当前静态目录下
          }),
        });
        // 弹窗实例的创建
        this.overLayer = new Overlay({
          element:this.$refs.popOut, // 弹窗所加载到dom结构
          autoPan:true, // 若弹窗在底图边缘,底图会移动
          // 底图移动动画
          autoPanAnimation:{
            duration:250
          }
        });
        this.map = new Map({
          target: 'map', // 地图实例所加载上的dom结构
          // 在layers中添加自己所需要的图层
          layers: [raster],
          overlays:[this.overLayer], // 弹窗图层添加
          view: new View({
            projection: "EPSG:4326", // 视图所使用的坐标系
            // EPSG:3857
            center: [120.92898835156248, 23.6828209384589], // 中心点
            zoom: 7, // 地图放大倍数
            minZoom: 7 // 地图最小倍数
          }),
        });
        // 地图点击触发事件
        this.map.on("click", e=>{
          // 判断是不是移动到图标之上
          const feature = this.map.forEachFeatureAtPixel(e.pixel,feature=>{
            return feature;
          });
          // 如果移动到图标上就继续进行下一步操作
          if(feature){
            // 设定弹窗位置
            this.overLayer.setPosition(e.coordinate);
            // 获取到上面预先设置的属性,可以根据获取预先设置的属性来改变弹窗内容
            console.info(feature.values_.name);
          }else{
            // 取消弹窗显示
            this.overLayer.setPosition(undefined);
          }
        });
      },
      // 地图打点方法
      addIconMarker(data) {
        let features = []; // 标点列表存放路径
        data.map((item)=>{
          const marker = new Feature({
            name:item.name, // 标点的附属属性可以以该形式放在此处,如type:item.type
            geometry: new Point(item.location)
          });
          marker.setStyle(new Style({
              image: new Icon({
                anchor: [0.5, 1],
                scale: 0.05, // 图片放缩程度
                src: pointImg // 标点图片路径
              }),
              // 设置图片下面显示字体的样式和内容
              text: new Text({
                text: item.name,// 添加文字描述
                font: '14px font-size', // 设置字体大小
                fill: new Fill({// 设置字体颜色
                  color: [71, 137, 227, 1]
                }),
                offsetY: 10// 设置文字偏移量
              })
            })
          );
          features.push(marker)
        });
        const vectorLayer = new VectorLayer({
          source: new VectorSource({
            features: features,
          })
        });
        this.map.addLayer(vectorLayer);
      }
    },
    mounted() {
      this.initMap();
      this.addIconMarker(this.pointData)
    }
  }
</script>
<style lang="scss" scoped>
  .map {
    width: 771px;
    height: 474px;
  }
  .pop{
    width: 200px;
    height: 80px;
    background-color: white;
  }
</style>
实现效果:

点击点后控制台输出数据:

此时弹窗是左上角贴近点击的点,如果想让弹窗显示在点的正上方只需要设置一下弹窗的css样式即可:
.pop{
  width: 200px;
  height: 80px;
  position:absolute;
  left:-100px;
  bottom:5px;
  background-color: white;
}

七、openLayers实现地图绘线
进行地图绘线绘制所需要引用依赖:
import {Map, View, Feature} from "ol";
import {Style, Stroke, Fill} from "ol/style";
import {LineString} from "ol/geom"
import "ol/ol.css";
import VectorLayer from "ol/layer/Vector";
import XYZ from "ol/source/XYZ";
import {Tile as TileLayer} from 'ol/layer.js'
import VectorSource from 'ol/source/Vector.js'
底图绘制参见上文。
openLayers地图绘制多条线段方法:
drawLine(coordinates) {
    // coordinates:坐标数据
    if(coordinates && coordinates.length>0){
       let features = []; // 线条样式存放路径
        coordinates.map(item =>{
            if(item.length >1 ){
                let feature = new Feature({
                    geometry:new LineString(item)
                });
                features.push(feature)
            }
        });
      let vectorLayer = new VectorLayer({
        source: new VectorSource({
            features:features,
        }),
        style: new Style({
          // 线段颜色
          stroke: new Stroke({
            color: "blue",
            width: 5
          })
        })
      });
      this.map.addLayer(vectorLayer);
    }
},
地图绘线假json数据格式示例:
linePointData:[
    [
      [120.45631, 23.76611], // 起点坐标
      [120.78590, 23.51464] // 终点坐标,其他坐标可放进起终点坐标之间
    ],
    [
      [120.45631, 23.76611],
      [120.78590, 23.51464]
    ],
]
实现效果:

八、openLayers常见地图实例
https://openlayers.org/en/master/examples/ openlayers地图官方实例网站
http://openlayers.org/en/master/examples/epsg-4326.html -- 标尺
http://openlayers.org/en/master/examples/export-map.html -- 截图
http://openlayers.org/en/master/examples/export-pdf.html -- 导出PDF
http://openlayers.org/en/master/examples/extent-interaction.html -- 国界线
http://openlayers.org/en/master/examples/feature-animation.html -- 动态弹圆圈
http://openlayers.org/en/master/examples/feature-move-animation.html -- 圆点按路线跑动
http://openlayers.org/en/master/examples/flight-animation.html -- 散射图
http://openlayers.org/en/master/examples/full-screen-source.html -- 全屏地图
http://openlayers.org/en/master/examples/full-screen.html -- 全屏地图2
http://openlayers.org/en/master/examples/geojson.html -- 画几何图形
http://openlayers.org/en/master/examples/geolocation-orientation.html -- 定位 不能定位
http://openlayers.org/en/master/examples/geolocation.html -- 定位2 可以定位到
http://openlayers.org/en/master/examples/getfeatureinfo-image.html -- 获取鼠标点击位置的详细信息
http://openlayers.org/en/master/examples/getfeatureinfo-tile.html -- 获取鼠标点击位置的详细信息(瓦片层)
http://openlayers.org/en/master/examples/graticule.html -- 有经纬线的地图
http://openlayers.org/en/master/examples/heatmap-earthquakes.html -- 热力能量图
http://openlayers.org/en/master/examples/hit-tolerance.html -- 误差
http://openlayers.org/en/master/examples/icon-color.html -- 图块地图
http://openlayers.org/en/master/examples/icon.html -- 图块地图(打标记)
http://openlayers.org/en/master/examples/icon-negative.html -- 地点标记
http://openlayers.org/en/master/examples/image-filter.html -- 绿色植被
http://openlayers.org/en/master/examples/image-vector-layer.html -- 点选国家,边界线画出来
http://openlayers.org/en/master/examples/kml-earthquakes.html -- 地震带
http://openlayers.org/en/master/examples/kml-timezones.html -- 时间轴地图
http://openlayers.org/en/master/examples/layer-clipping.html -- 图形裁剪地图
http://openlayers.org/en/master/examples/layer-extent.html -- 标记位置
http://openlayers.org/en/master/examples/layer-spy.html -- 放大镜效果
http://openlayers.org/en/master/examples/layer-swipe.html -- 明亮 阴影面地图
http://openlayers.org/en/master/examples/layer-z-index.html -- z坐标轴
http://openlayers.org/en/master/examples/line-arrows.html -- 画带箭头的折线图(双击鼠标停止划线)
http://openlayers.org/en/master/examples/lazy-source.html -- 填充和置空地图
http://openlayers.org/en/master/examples/localized-openstreetmap.html -- 街道图
http://openlayers.org/en/master/examples/measure.html -- 测量直线距离
http://openlayers.org/en/master/examples/modify-features.html -- 点击shift键,拉动鼠标,放大地图
http://openlayers.org/en/master/examples/mouse-position.html -- 获取鼠标在地图上的位置
http://openlayers.org/en/master/examples/moveend.html -- 获取地图上下左右的位置
http://openlayers.org/en/master/examples/overlay.html -- 弹窗显示鼠标点击位置的坐标位置
http://openlayers.org/en/master/examples/popup.html -- 弹窗显示鼠标点击位置的坐标位置
http://openlayers.org/en/master/examples/overviewmap-custom.html -- 小窗口显示小地图
http://openlayers.org/en/master/examples/overviewmap.html -- 小窗口显示小地图
http://openlayers.org/en/master/examples/preload.html -- 双DIV显示地图(不同尺寸)
http://openlayers.org/en/master/examples/reprojection.html -- 切换地图参数
http://openlayers.org/en/master/examples/reusable-source.html -- 切片覆盖,换切片
http://openlayers.org/en/master/examples/sea-level.html -- 水位
http://openlayers.org/en/master/examples/select-features.html -- 鼠标点击方式
http://openlayers.org/en/master/examples/shaded-relief.html -- 光线角度
http://openlayers.org/en/master/examples/side-by-side.html -- 双DIV显示
http://openlayers.org/en/master/examples/snap.html -- 标记地图方式切换
http://openlayers.org/en/master/examples/ -- 地图切换到另一个DIV显示
http://openlayers.org/en/master/examples/tile-load-events.html --监听点击,有条状态线
http://openlayers.org/en/master/examples/tileutfgrid.html -- 鼠标滑过,显示国旗
http://openlayers.org/en/master/examples/tilejson.html -- tilejson 例子
http://openlayers.org/en/master/examples/topolis.html -- 画点,并用线条连接起来
http://openlayers.org/en/master/examples/translate-features.html -- 切换国家
http://openlayers.org/en/master/examples/vector-esri-edit.html -- 地图上划线
http://openlayers.org/en/master/examples/vector-labels.html -- 改变 地图参数
http://openlayers.org/en/master/examples/vector-layer.html -- 地图画边线
http://openlayers.org/en/master/examples/vector-osm.html -- 三维地图
http://openlayers.org/en/master/examples/vector-wfs.html -- wfs地图
http://openlayers.org/en/master/examples/wms-capabilities.html -- wms 性能分析
http://openlayers.org/en/master/examples/zoomslider.html --滑动条,改变大小
版权归原作者 YOLO浪漫收藏家 所有, 如有侵权,请联系我们删除。