
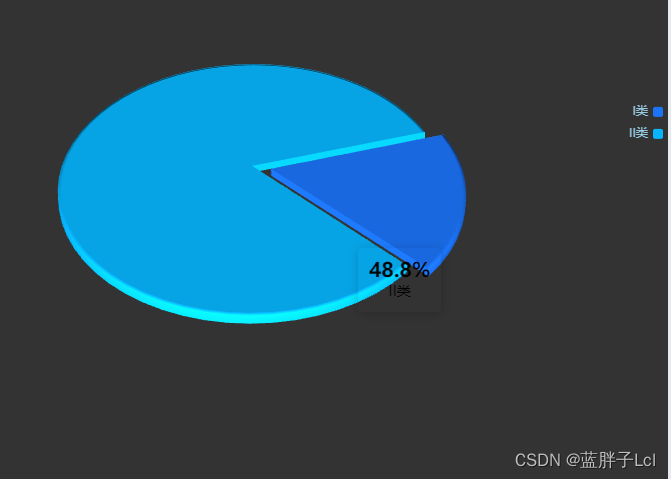
效果图
代码
const  optionData=[{name:'I类',value:10.2,itemStyle:{// color: '#1c74f8cc',color:'#1C74F8',},},{name:'II类',value:48.8,itemStyle:{// color: '#07b5ffcc',color:'#07B5FF',},},]
 option ={}functioninit(){// 构建3d饼状图// 传入数据生成 option

      option =getPie3D(optionData,0.8);

      console.log(option)// 是否需要label指引线,如果要就添加一个透明的2d饼状图并调整角度使得labelLine和3d的饼状图对齐,并再次setOption
      option.series.push({name:'pie2d',// type: 'pie',labelLine:{length:10,length2:10,},startAngle:-30,// 起始角度,支持范围[0, 360]。clockwise:false,// 饼图的扇区是否是顺时针排布。上述这两项配置主要是为了对齐3d的样式radius:['20%','50%'],center:['50%','50%'],data: optionData,itemStyle:{opacity:0,},});
      myChart.setOption(option);bindListen();}// 生成模拟 3D 饼图的配置项functiongetPie3D(pieData, internalDiameterRatio){const series =[];// 总和let sumValue =0;let startValue =0;let endValue =0;const legendData =[];// const k = typeof internalDiameterRatio !== 'undefined'//   ? (1 - internalDiameterRatio) / (1 + internalDiameterRatio)//   : 1 / 3;const k =1// 为每一个饼图数据,生成一个 series-surface 配置for(let i =0; i < pieData.length; i +=1){
        sumValue += pieData[i].value;const seriesItem ={name:typeof pieData[i].name ==='undefined'?`series${i}`: pieData[i].name,type:'surface',parametric:true,wireframe:{show:false,},pieData: pieData[i],pieStatus:{selected:false,hovered:false,
            k,},};if(typeof pieData[i].itemStyle !=='undefined'){const{ itemStyle }= pieData[i];// eslint-disable-next-line no-unused-expressionstypeof pieData[i].itemStyle.color !=='undefined'?(itemStyle.color = pieData[i].itemStyle.color):null;// eslint-disable-next-line no-unused-expressionstypeof pieData[i].itemStyle.opacity !=='undefined'?(itemStyle.opacity = pieData[i].itemStyle.opacity):null;

          seriesItem.itemStyle = itemStyle;}
        series.push(seriesItem);}// 使用上一次遍历时,计算出的数据和 sumValue,调用 getParametricEquation 函数,// 向每个 series-surface 传入不同的参数方程 series-surface.parametricEquation,也就是实现每一个扇形。for(let i =0; i < series.length; i +=1){
        endValue = startValue + series[i].pieData.value;

        series[i].pieData.startRatio = startValue / sumValue;
        series[i].pieData.endRatio = endValue / sumValue;
        series[i].parametricEquation =getParametricEquation(
          series[i].pieData.startRatio,
          series[i].pieData.endRatio,false,false,
          k,

          series[i].pieData.value ,);

        startValue = endValue;

        legendData.push(series[i].name);}// 准备待返回的配置项,把准备好的 legendData、series 传入。const option ={animation:true,legend:{orient:'vertical',data: legendData,textStyle:{color:'rgba(150,202,223)',fontSize:12,},itemWidth:10,itemHeight:10,icon:'roundRect',left:'right',top:'30%',// 居右显示},tooltip:{trigger:'item',backgroundColor:'#ffffff00',borderColor:'#ffffff00',// position: ['37%', '25%'], // tooltip固定位置formatter:(params)=>{if(params.seriesName !=='mouseoutSeries'){return`<div>
              <p style="font-size:20px;color:#000;font-weight:bold;margin:0">${
                option.series[params.seriesIndex].pieData.value}%</p>
                            <p style="color:#000;text-align:center;margin:0">${
                params.seriesName
              }</p></div>`;}return'';},},labelLine:{show:true,lineStyle:{color:'#7BC0CB',},},label:{show:true,position:'outside',formatter:'{b} \n{c} {d}%',},backgroundColor:'#333',// x,y,z调整大小的xAxis3D:{min:-1,max:1,},yAxis3D:{min:-1,max:1,},zAxis3D:{min:-1,max:1,},grid3D:{show:false,boxHeight:2,// 饼环的高度top:'-10%',left:'5%',viewControl:{// 3d效果可以放大、旋转等,请自己去查看官方配置alpha:40,//z轴旋转角度beta:45,//x轴旋转角度rotateSensitivity:0,// 旋转zoomSensitivity:0,// 缩放panSensitivity:0,// 平移autoRotate:false,// 旋转distance:500,// 整视角到主体的距离,类似调整zoom},// 后处理特效可以为画面添加高光、景深、环境光遮蔽(SSAO)、调色等效果。可以让整个画面更富有质感。postEffect:{// 配置这项会出现锯齿,请自己去查看官方配置有办法解决enable:false,bloom:{enable:true,bloomIntensity:0.1,},SSAO:{enable:true,quality:'medium',radius:1,},// temporalSuperSampling: {//   enable: true,// },},},
        series,};return option;}// 获取3d丙图的最高扇区的高度functiongetHeight3D(series, height){
      series.sort((a, b)=>(b.pieData.value - a.pieData.value));return height *25/ series[0].pieData.value;}// 生成扇形的曲面参数方程,用于 series-surface.parametricEquationfunctiongetParametricEquation(startRatio, endRatio, isSelected, isHovered, k, h){// 计算const midRatio =(startRatio + endRatio)/2;const startRadian = startRatio * Math.PI*2;const endRadian = endRatio * Math.PI*2;const midRadian = midRatio * Math.PI*2;// 如果只有一个扇形,则不实现选中效果。if(startRatio ===0&& endRatio ===1){// eslint-disable-next-line no-param-reassign
        isSelected =false;}// 通过扇形内径/外径的值,换算出辅助参数 k(默认值 1/3)// eslint-disable-next-line no-param-reassign
      k =typeof k !=='undefined'? k :1/3;// 计算选中效果分别在 x 轴、y 轴方向上的位移(未选中,则位移均为 0)// const offsetX = isSelected ? 0 : Math.cos(midRadian) * 0.2 ;// const offsetY = isSelected ? 0 : Math.sin(midRadian) * 0.2;const offsetX = isHovered ? Math.cos(midRadian)*0.2: Math.cos(midRadian)*0.1;const offsetY = isHovered ? Math.sin(midRadian)*0.2: Math.sin(midRadian)*0.1;// 计算高亮效果的放大比例(未高亮,则比例为 1)const hoverRate = isHovered ?1.01:1;// 返回曲面参数方程return{u:{min:-Math.PI,max: Math.PI*3,step: Math.PI/32,},v:{min:0,max: Math.PI*2,step: Math.PI/20,},x(u, v){if(u < startRadian){return offsetX + Math.cos(startRadian)*(1+ Math.cos(v)* k)* hoverRate;}if(u > endRadian){return offsetX + Math.cos(endRadian)*(1+ Math.cos(v)* k)* hoverRate;}return offsetX + Math.cos(u)*(1+ Math.cos(v)* k)* hoverRate;},y(u, v){if(u < startRadian){return offsetY + Math.sin(startRadian)*(1+ Math.cos(v)* k)* hoverRate;}if(u > endRadian){return offsetY + Math.sin(endRadian)*(1+ Math.cos(v)* k)* hoverRate;}return offsetY + Math.sin(u)*(1+ Math.cos(v)* k)* hoverRate;},z(u, v){if(u <-Math.PI*0.5){return Math.sin(u);}if(u > Math.PI*2.5){return Math.sin(u)* h *0.1;}return Math.sin(v)>0?1* h *0.1:-1;},};}functionfomatFloat(num, n){let f =parseFloat(num);// eslint-disable-next-line no-restricted-globalsif(isNaN(f)){returnfalse;}// eslint-disable-next-line no-restricted-properties
      f = Math.round(num * Math.pow(10, n))/ Math.pow(10, n);// n 幂let s = f.toString();let rs = s.indexOf('.');// 判定如果是整数,增加小数点再补0if(rs <0){
        rs = s.length;
        s +='.';}while(s.length <= rs + n){
        s +='0';}return s;}functionbindListen(){// 监听鼠标事件,实现饼图选中效果(单选),近似实现高亮(放大)效果。const that =this;let selectedIndex ='';let hoveredIndex ='';// 监听点击事件,实现选中效果(单选)
      myChart.on('click',(params)=>{// 从 option.series 中读取重新渲染扇形所需的参数,将是否选中取反。const isSelected =!that.option.series[params.seriesIndex].pieStatus.selected;const isHovered = that.option.series[params.seriesIndex].pieStatus.hovered;const{ k }= that.option.series[params.seriesIndex].pieStatus;const{ startRatio }= that.option.series[params.seriesIndex].pieData;const{ endRatio }= that.option.series[params.seriesIndex].pieData;// 如果之前选中过其他扇形,将其取消选中(对 option 更新)if(selectedIndex !==''&& selectedIndex !== params.seriesIndex){
          that.option.series[selectedIndex].parametricEquation = that.getParametricEquation(that.option.series[
            selectedIndex].pieData
            .startRatio, that.option.series[selectedIndex].pieData.endRatio,false,false, k, that.option.series[
            selectedIndex].pieData
            .value);
          that.option.series[selectedIndex].pieStatus.selected =false;}// 对当前点击的扇形,执行选中/取消选中操作(对 option 更新)
        that.option.series[params.seriesIndex].parametricEquation = that.getParametricEquation(startRatio, endRatio,
          isSelected,
          isHovered, k,80);// 高亮时扇形的高度
        that.option.series[params.seriesIndex].pieStatus.selected = isSelected;// 如果本次是选中操作,记录上次选中的扇形对应的系列号 seriesIndex// eslint-disable-next-line no-unused-expressions
        isSelected ? selectedIndex = params.seriesIndex :null;// 使用更新后的 option,渲染图表
        myChart.setOption(that.option);});// 监听 mouseover,近似实现高亮(放大)效果
      myChart.on('mouseover',(params)=>{// 准备重新渲染扇形所需的参数let isSelected;let isHovered;let startRatio;let endRatio;let k;// 如果触发 mouseover 的扇形当前已高亮,则不做操作if(hoveredIndex === params.seriesIndex){// 否则进行高亮及必要的取消高亮操作}else{// 如果当前有高亮的扇形,取消其高亮状态(对 option 更新)if(hoveredIndex !==''){// 从 option.series 中读取重新渲染扇形所需的参数,将是否高亮设置为 false。
            isSelected = that.option.series[hoveredIndex].pieStatus.selected;
            isHovered =false;// eslint-disable-next-line prefer-destructuring
            startRatio = that.option.series[hoveredIndex].pieData.startRatio;// eslint-disable-next-line prefer-destructuring
            endRatio = that.option.series[hoveredIndex].pieData.endRatio;// eslint-disable-next-line prefer-destructuring
            k = that.option.series[hoveredIndex].pieStatus.k;// 对当前点击的扇形,执行取消高亮操作(对 option 更新)
            that.option.series[hoveredIndex].parametricEquation = that.getParametricEquation(startRatio, endRatio,
              isSelected,
              isHovered, k,35);// 35 为取消高亮时扇形的高度
            that.option.series[hoveredIndex].pieStatus.hovered = isHovered;// 将此前记录的上次选中的扇形对应的系列号 seriesIndex 清空
            hoveredIndex ='';}// 如果触发 mouseover 的扇形不是透明圆环,将其高亮(对 option 更新)if(params.seriesName !=='mouseoutSeries'&& params.seriesName !=='pie2d'){// 从 option.series 中读取重新渲染扇形所需的参数,将是否高亮设置为 true。
            isSelected = that.option.series[params.seriesIndex].pieStatus.selected;
            isHovered =true;// eslint-disable-next-line prefer-destructuring
            startRatio = that.option.series[params.seriesIndex].pieData.startRatio;// eslint-disable-next-line prefer-destructuring
            endRatio = that.option.series[params.seriesIndex].pieData.endRatio;// eslint-disable-next-line prefer-destructuring
            k = that.option.series[params.seriesIndex].pieStatus.k;// 对当前点击的扇形,执行高亮操作(对 option 更新)
            that.option.series[params.seriesIndex].parametricEquation = that.getParametricEquation(startRatio, endRatio,
              isSelected, isHovered, k,80);// 高亮时扇形的高度
            that.option.series[params.seriesIndex].pieStatus.hovered = isHovered;// 记录上次高亮的扇形对应的系列号 seriesIndex
            hoveredIndex = params.seriesIndex;}// 使用更新后的 option,渲染图表
          myChart.setOption(that.option);}});// 修正取消高亮失败的 bug
      myChart.on('globalout',()=>{// 准备重新渲染扇形所需的参数let isSelected;let isHovered;let startRatio;let endRatio;let k;if(hoveredIndex !==''){// 从 option.series 中读取重新渲染扇形所需的参数,将是否高亮设置为 true。
          isSelected = that.option.series[hoveredIndex].pieStatus.selected;
          isHovered =false;// eslint-disable-next-line prefer-destructuring
          k = that.option.series[hoveredIndex].pieStatus.k;// eslint-disable-next-line prefer-destructuring
          startRatio = that.option.series[hoveredIndex].pieData.startRatio;// eslint-disable-next-line prefer-destructuring
          endRatio = that.option.series[hoveredIndex].pieData.endRatio;// 对当前点击的扇形,执行取消高亮操作(对 option 更新)
          that.option.series[hoveredIndex].parametricEquation = that.getParametricEquation(startRatio, endRatio,
            isSelected,
            isHovered, k,35);// 取消高亮时扇形的高度
          that.option.series[hoveredIndex].pieStatus.hovered = isHovered;// 将此前记录的上次选中的扇形对应的系列号 seriesIndex 清空
          hoveredIndex ='';}// 使用更新后的 option,渲染图表
        myChart.setOption(that.option);});}init()````
本文转载自: https://blog.csdn.net/weixin_43483746/article/details/129578260
版权归原作者 蓝胖子Lcl 所有, 如有侵权,请联系我们删除。
版权归原作者 蓝胖子Lcl 所有, 如有侵权,请联系我们删除。