
✍️ 作者简介: 前端新手学习中。
💂 作者主页: 在主页中查看更多前端教学,可接大学生前端作业单。
🎓 专栏分享:css重难点教学 Node.js教学 从头开始学习 ajax学习
js学习
目录
初始SVG
SVG是一种图形文件格式,它的英文全称为Scalable Vector Graphics,意思为可缩放的矢量图形。它是基于XML(Extensible Markup Language),由World Wide Web Consortium(W3C)联盟进行开发的。
图片格式一般都是像素处理的,图片放大会模糊失真,svg格式属于是对图片的形状描述,所以它本质上是文本文件,体积较小,并且不管放大多少倍都不会模糊失真。使用时直接在img标签中写入svg格式的图片即可。
矩形,圆形和椭圆型
如何使用svg绘制特殊形状,svg标签中中有一些预定义的属性标签。
svg画布宽高默认值是300 x 150(单位px)
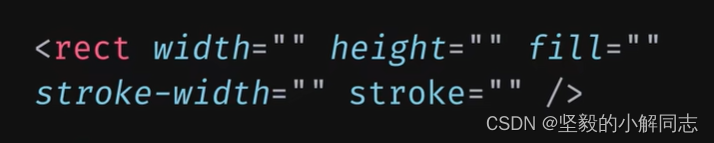
矩形
<body>
<svg>
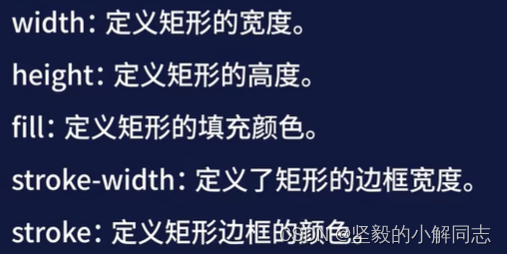
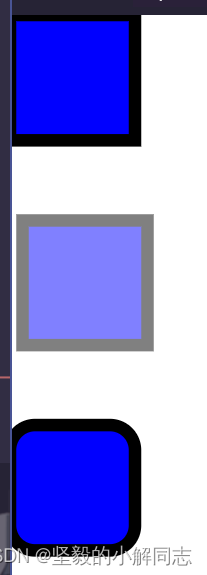
<rect width="100" height="100" fill="blue" stroke-width="10" stroke="black" />
</svg>
<svg>
<!-- opacity 透明度 xy坐标 画布左上角参考点-->
<rect x="10" y="10" width="100" height="100" fill="blue" stroke-width="10" stroke="black" opacity="0.5" />
</svg>
<svg>
<!-- rx ry分别为圆的x轴和y轴半径长度 -->
<rect rx="20" ry="20" y='20' width="100" height="100" fill="blue" stroke-width="10" stroke="black" />
</svg>
</body>
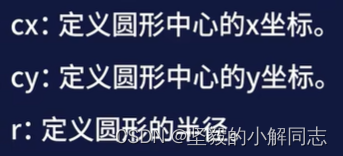
圆形
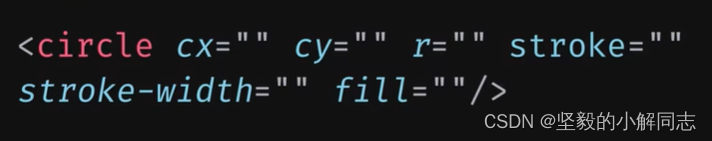
 <svg width="300" height="300">
        <circle cx="20" cy="20" r="10" stroke="red" stroke-width="3" />
    </svg>

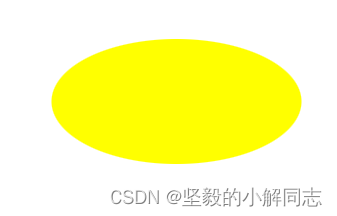
椭圆形
  <svg width="300" height="300">
        <ellipse cx="150" cy="50" rx="100" ry="50" fill="yellow" />
    </svg>
绘制线条 多边形 连续线条
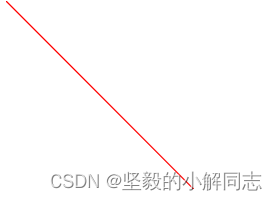
线条
<svg>
        <!-- x1 y1起点 x2 y2终点 -->
        <line x1="0" y1="0" x2="150" y2="150" stroke="red" />
    </svg>
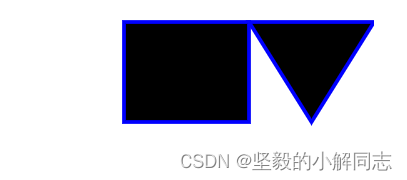
多边形
  <svg width="300" height="300">
        <!-- points 填写多个连接点点 -->
        <polygon points="300,20 200,20 250,100 " stroke="blue" stroke-width="3" />
        <polygon points="200,20 100,20 100,100 200,100" stroke="blue" stroke-width="3" />

    </svg>
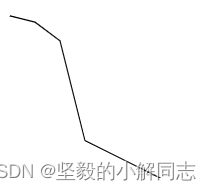
连续线条
  <svg>
        <polyline points="20,20 40,25 60,40 80,120 120,140 200,180" fill="none" stroke="black" />
    </svg>
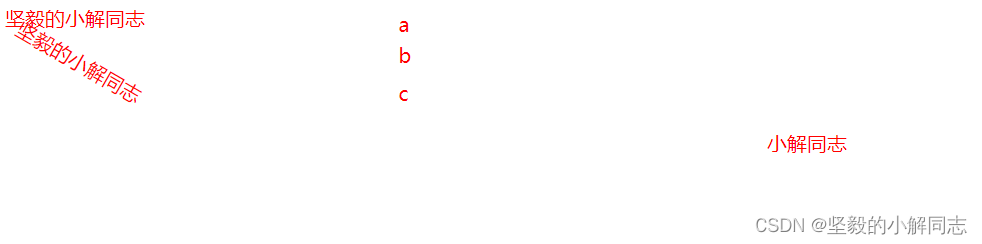
绘制文本
<body>
    <svg width="300" height="300">
        <text x="0" y="15" fill="red">
            坚毅的小解同志
        </text>
        <!-- rotate  旋转角度   旋转中心点 默认为0,0 -->
        <text x="0" y="30" fill="red" transform="rotate(30 20,40)">
            坚毅的小解同志
        </text>
    </svg>
    <svg width="300" height="300">
        <!-- 添加tspan子标签添加不同格式和样式 -->
        <text x="10" y="20" fill="red">
            a
            <tspan x="10" y="45">b</tspan>
            <tspan x="10" y="75">c</tspan>
        </text>
    </svg>
    <!-- 固定的命名空间 -->
    <svg xmlns:xlink="http://www.w3.org/1999/xlink" width="200" height="200">
        <!-- 超链接添加 xml-->
        <a xlink:href="https://blog.csdn.net/m0_62360527?type=blog">
            <text y="15" fill='red'>小解同志</text>
        </a>
    </svg>
</body>
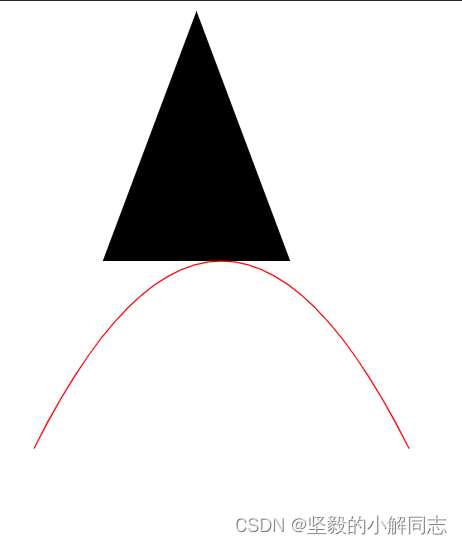
绘制路径
<body>
    <svg width="800" height="800">

        <!-- d表示绘画  M就是类似canvas里面的moveto L就是lineto
        注意  大写字母表示绝对定位 小写的话 就是相对定位-->
        <path d="M 150,0 L 75,200 L 225,200" />
        <!-- 贝塞尔曲线 M是起点
        q里面 是控制点 和终点 -->
        <path d="M 20 350 q 150 -300 300,0" fill="none" stroke="red" />
    </svg>
</body>
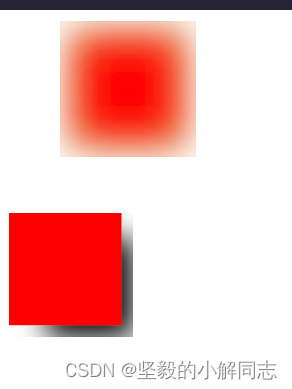
阴影和模糊
<body>
    <!-- 高斯模糊 -->
    <svg>
        <defs>
            <filter id="f1">
                <!-- 值越大越模糊 -->
                <feGaussianBlur stdDeviation="15" />
            </filter>
        </defs>
        <!-- id 属性 -->
        <rect filter="url(#f1)" x='50' y="10" width="90" height="90" stroke="green" stroke-width="3" fill="red" />
    </svg>
    <!-- 阴影效果 -->
    <Svg>
        <defs>
            <filter id="f2">
                <feOffset in="SourceAlpha" dx="30" dy="20" />
                <feGaussianBlur stdDeviation="11" />
                <feBlend in="SourceGraphic" />

            </filter>
        </defs>
        <rect width="90" height="90" fill="red" filter="url(#f2)" />
    </Svg>
</body>
本文转载自: https://blog.csdn.net/m0_62360527/article/details/128620866
版权归原作者 坚毅的小解同志 所有, 如有侵权,请联系我们删除。
版权归原作者 坚毅的小解同志 所有, 如有侵权,请联系我们删除。