
💰前言
个人主页:KinHKin(五年前端)的博客_CSDN博客-vue,css,中秋活动领域博主
在线演示: KinHKin
刚结束了一个vue3项目的前端改造,从一个页面改造成路由系统切换的功能,产品美名曰:UI改版。我们都知道产品的好坏,取决于产品的设计,设计的变动,不一定是业务方的变动,但是一定是产品的需求变动,有时候大费周折在原来的基础上需要重新设计前端布局,组件的传值,条件的判断,主题色的修改,如果想要在自己的受控范围内,这就需要得益于前期的组件抽象,样式变量,这样能达到改一处代码,全局都受益的结果。对于参数的传递,我推荐使用vue3的最新版pania状态管理工具,使用方便,逻辑简单,复用性高。这里需要举个简单的例子:
先来看效果图:
👍🏻实现过程
主要echarts的柱状图和饼图配合点击事件进行数据传值,饼图数据渲染。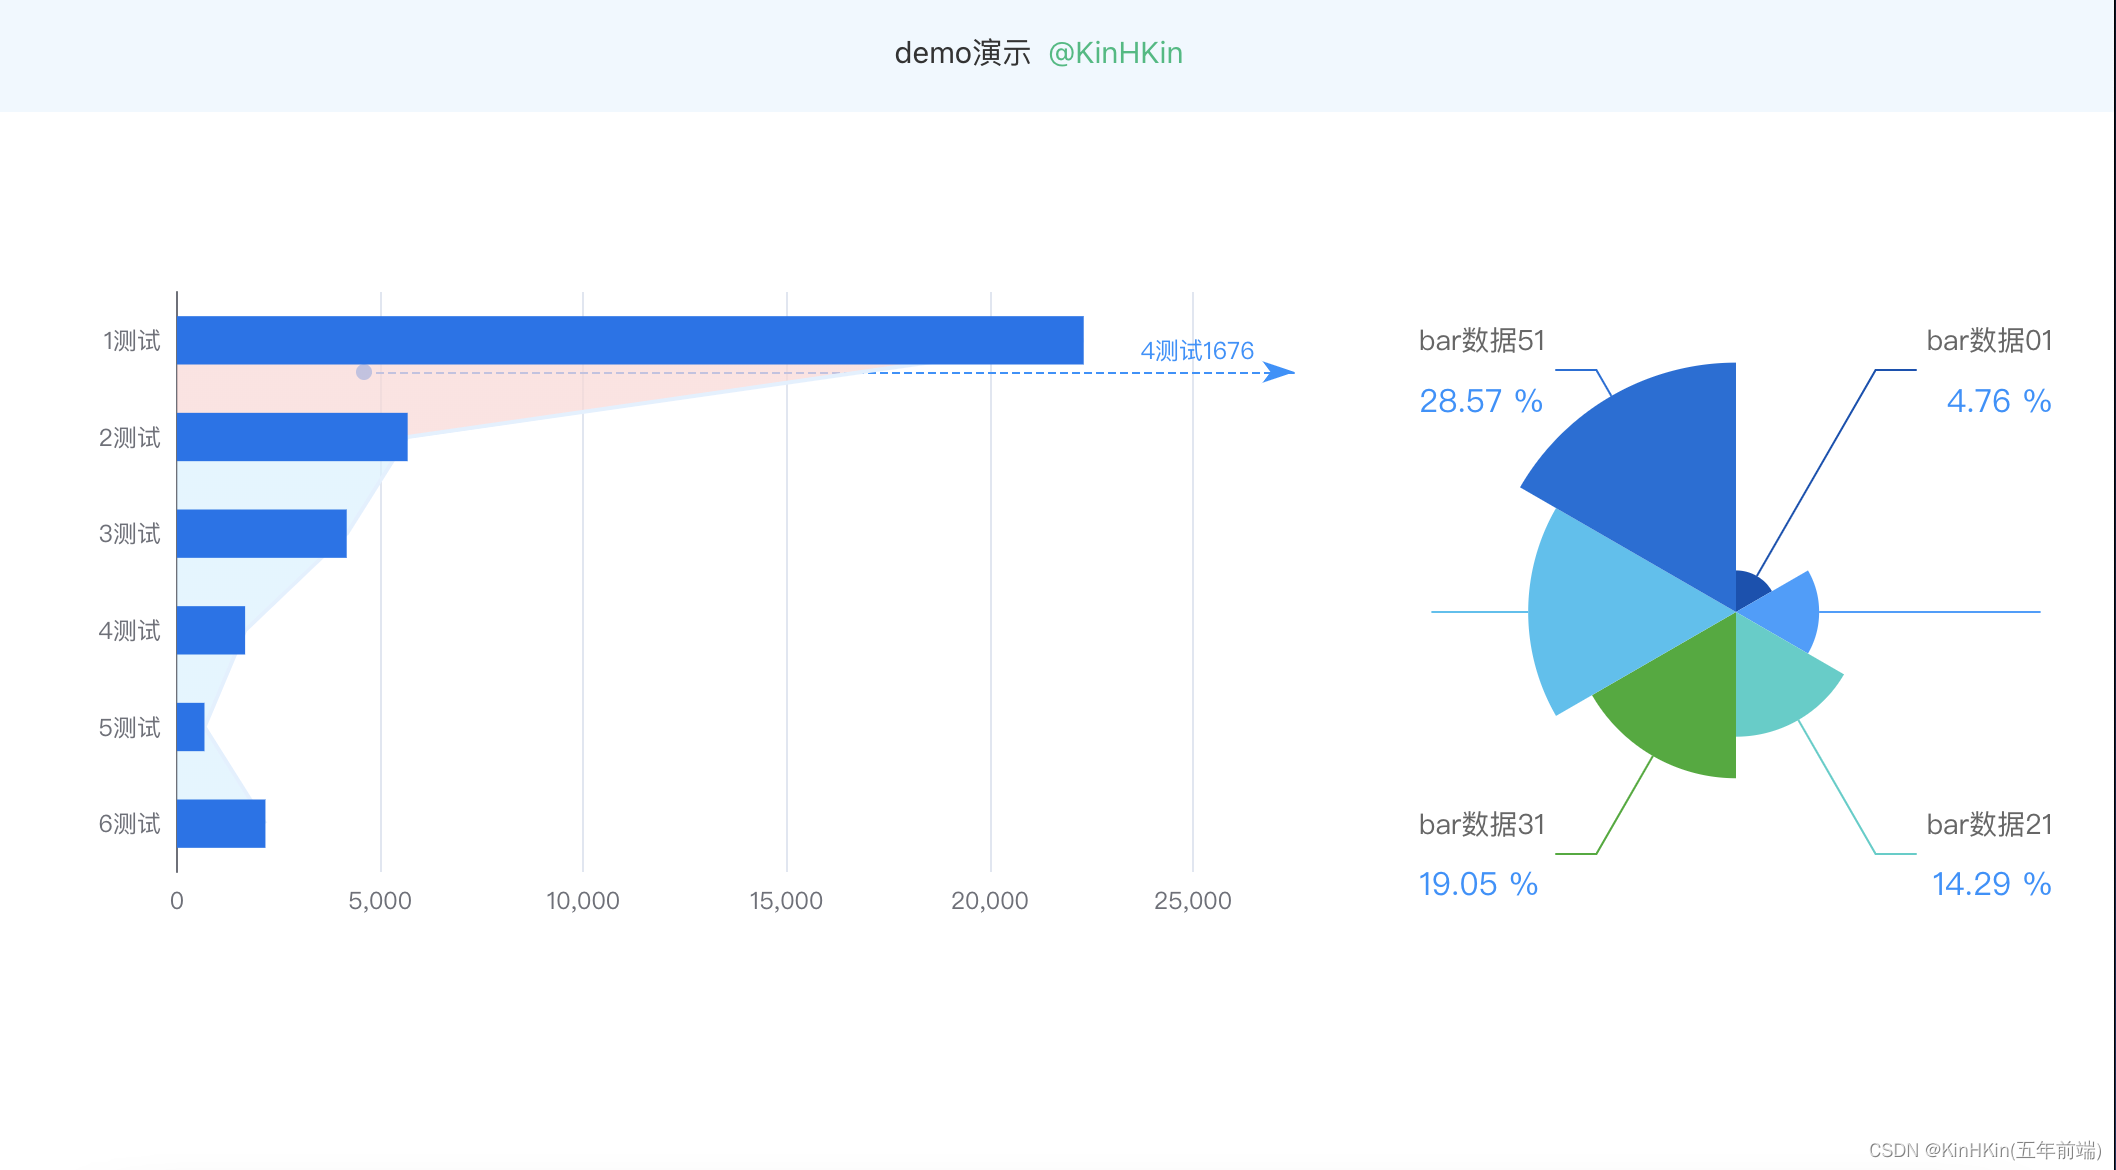
📊 柱状图思路
- 全局引入echarts
- 模拟柱状图数据
- 定义关键三个函数:drawPieCharts,BarClick,defaultClick
- 初始化数据
整体函数预览:
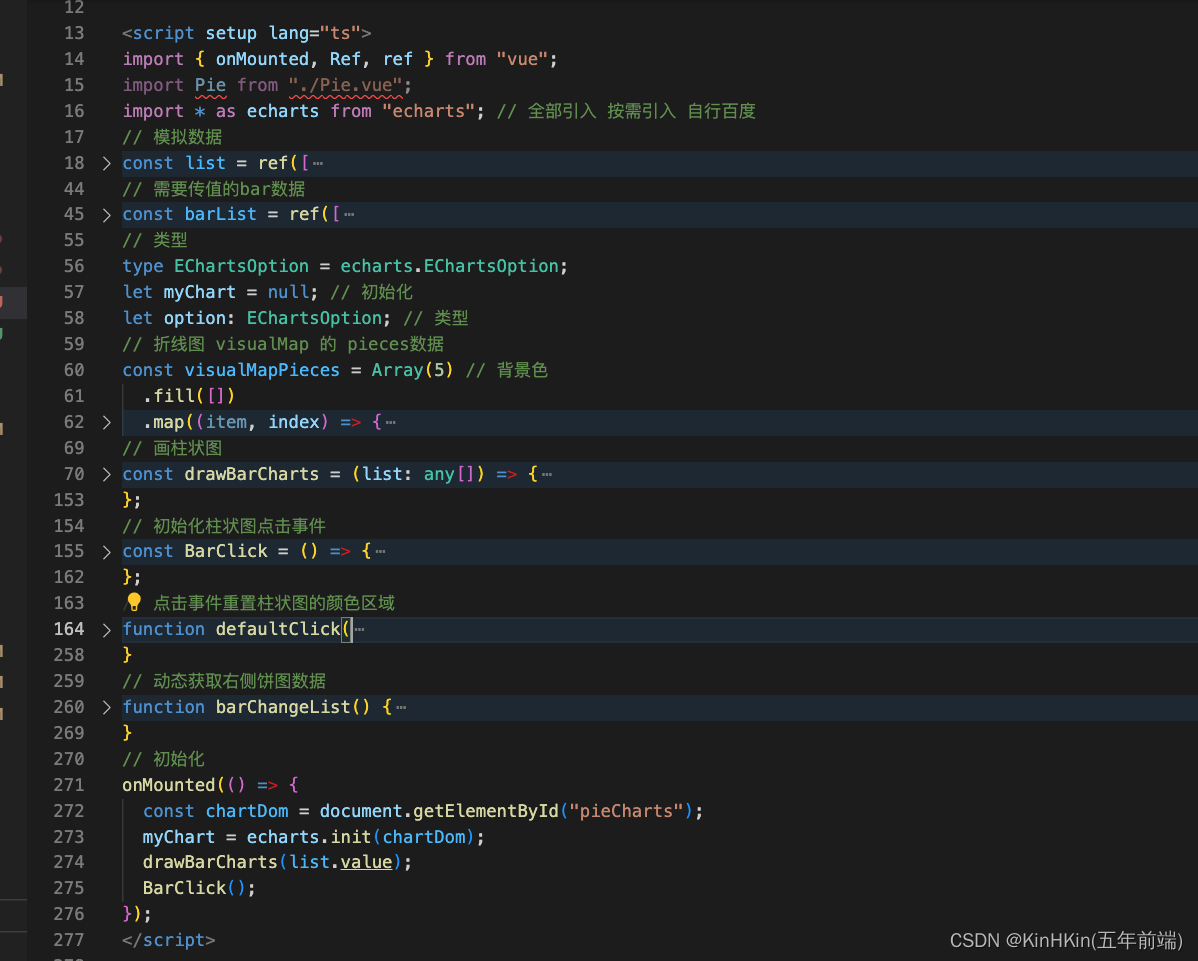
1.初始化数据
获取dom元素,echarts初始化图表,drawPieCharts来画柱状图,BarClick来初始化柱状图的点击事件。
// 初始化
onMounted(() => {
  const chartDom = document.getElementById("pieCharts");
  myChart = echarts.init(chartDom);
  drawBarCharts(list.value);
  BarClick();
});
2.画柱状图
这里面就是普通的echarts画柱状图的方法,需要注意的是visualMap画区域颜色,markLine来默认画出第一条线
// 画柱状图
const drawBarCharts = (list: any[]) => {
  // drawPieChart("skip", "");
  if (option) {
    myChart.dispose(); //释放图表
  }
  // 折线图 默认配置
  option = {
    grid: {
      top: 40,
    },
    yAxis: {
      type: "category",
      axisTick: {
        show: false,
      },
      data: list.map((i) => i.name).reverse(),
    },

    xAxis: {
      type: "value",
    },
    visualMap: {
      type: "piecewise",
      show: false,
      dimension: 1,
      seriesIndex: 1,
      pieces: [
        {
          gt: 4,
          lt: 5,
          color: "#FFD6D4",
        },
      ],
    },
    series: [
      {
        name: "",
        data: list.map((i) => i.total).reverse(),
        type: "bar",
        barWidth: "50%",
        color: "#0072ED",
        zlevel: 2,
      },
      {
        name: "line",
        type: "line",
        areaStyle: {
          // color: '#D6F1FF'
        },
        lineStyle: {
          color: "#E2F0FF",
        },
        data: list.map((i) => i.total).reverse(),
        zlevel: 1,
        symbol: "none",
        markLine: {
          silent: true,
          data: [
            [
              {
                lineStyle: { color: "#1890FF", type: "dashed", width: 2 },
                x: "10%",
                y: "22%",
              },
              {
                label: {
                  color: "#1890FF",
                  padding: [0, 15, 0, 0], // 重点在这里,这个地方就是定位
                  position: "insideEndTop",
                  formatter: `${list[1].name + "    " + list[1].total}`, // 默认第二个
                },
                lineStyle: { color: "#1890FF", type: "dashed", width: 2 },
                x: "98%",
                y: "22%",
              },
            ],
          ],
        },
      },
    ],
  };
  // 折线图 点击事件
  option && myChart.setOption(option);
};
3.初始化柱状图点击事件BarClick
使用实例化的myChart 和 getZr方法 作用于line上面来调用defaultClick事件
// 初始化柱状图点击事件
const BarClick = () => {
  // 折线图 点击事件
  myChart.getZr().on("click", "series.line", (params) => {
    defaultClick(params, option, myChart, visualMapPieces, list.value);
    console.log(params, "params");
    barChangeList();
  });
};
4.defaultClick事件
用于重绘区域颜色和线上数据,改变bie的数据,根据Y轴的值 预估区间,来获取对应的数组的index。
注意:这里面是估算,不是精确数据。
// 点击事件重置柱状图的颜色区域
function defaultClick(
  params: { target: any; offsetY: number; offsetX: any },
  option: echarts.EChartsOption,
  myChart: {
    setOption: (arg0: {
      visualMap: {
        type: string;
        show: boolean;
        dimension: number;
        seriesIndex: number;
        pieces: any;
      };
      series: any;
    }) => void;
  },
  visualMapPieces: any[],
  list: Ref<{ name: string; total: string }[]> | { total: any }[]
) {
  // 折线图 点击事件
  console.log(params, "params");
  if (!params.target) {
    return;
  }
  let areaIndex = 0; // 值域:[0, 4]的正整数
  // 根据Y轴的值 预估区间
  if (params.offsetY >= 78 && params.offsetY < 125) {
    areaIndex = 4;
  } else if (params.offsetY >= 125 && params.offsetY < 148) {
    areaIndex = 3;
  } else if (params.offsetY >= 148 && params.offsetY < 197) {
    areaIndex = 2;
  } else if (params.offsetY >= 197 && params.offsetY < 270) {
    areaIndex = 1;
  } else if (params.offsetY >= 270 && params.offsetY < 296) {
    areaIndex = 0;
  } else {
    areaIndex = null;
  }
  if (areaIndex === null) return; // 控制第四个区域不能点击
  myChart.setOption({
    visualMap: {
      type: "piecewise",
      show: false,
      dimension: 1,
      seriesIndex: 1,
      pieces: visualMapPieces.map((item, index) => {
        // 根据点击区域,修改折线图区域的颜色
        return index === areaIndex
          ? {
              agt: index,
              lt: index + 1,
              color: "#FFD6D4",
            }
          : { ...item };
      }),
    },
    series: option.series.map((item, index) => {
      // 根据点击区域 画指示线
      return item.name === "line"
        ? {
            ...item,
            markLine: {
              silent: true,
              lineStyle: {
                type: "dashed",
                color: "#1890FF",
              },
              data: [
                [
                  {
                    lineStyle: { color: "#1890FF", type: "dashed", width: 1 },
                    x: params.offsetX,
                    y: params.offsetY,
                  },
                  {
                    label: {
                      color: "#1890FF",
                      padding: [0, 15, 0, 0], // 重点在这里,这个地方就是定位
                      position: "insideEndTop",
                      formatter: `${
                        list[areaIndex - 1 < 0 ? 0 : areaIndex - 1].name
                      }${list[areaIndex - 1 < 0 ? 0 : areaIndex - 1].total}`,
                    },
                    lineStyle: { color: "#1890FF", type: "dashed", width: 1 },
                    x: "98%",
                    y: params.offsetY,
                  },
                ],
              ],
            },
          }
        : { ...item };
    }),
  });
}
🆚饼图思路
饼图思路很简单,接受一个props.list 用于数据驱动,需要注意的是饼图要绑定一个key,用于变化数据时候更新。还有在销毁组件里面重新实例化echarts图表对象。
if (option) {
myChart.dispose(); //释放图表
myChart = null;
let chartDom = document.getElementById("barCharts");
myChart = echarts.init(chartDom);
}
代码如下:
<!--功能说明: KinHKin 饼图-->
<template>
  <div class="route-watch-bar" id="barCharts" :key="keyOnly"></div>
</template>

<script setup lang="ts">
import { onMounted, ref } from "vue";
import * as echarts from "echarts";
import { watch } from "vue";
type EChartsOption = echarts.EChartsOption;
const keyOnly = new Date().getTime();
let myChart = null;
let option: EChartsOption;
const props = defineProps({
  list: Array,
});

const drawBarCharts = () => {
  if (option) {
    myChart.dispose(); //释放图表
    myChart = null;
    let chartDom = document.getElementById("barCharts");
    myChart = echarts.init(chartDom);
  }

  option = {
    color: ["#0050B3", "#339DFF", "#36CFC9", "#2BAD2B", "#37C1F0", "#096DD9"],
    grid: {
      top: "50%",
      right: "90%",
      left: "40%",
    },
    tooltip: {
      trigger: "item",
      formatter: "{b} <br/>{d}%",
    },
    series: [
      {
        name: "",
        type: "pie",
        radius: "74%",
        roseType: "area",
        data: props.list,
        label: {
          alignTo: "edge",
          formatter: "{name|{b}}\n\n{value|{d} %}",
          minMargin: 5,
          edgeDistance: 10,
          lineHeight: 15,
          rich: {
            name: {
              fontSize: 14,
              color: "#666",
            },
            value: {
              fontSize: 16,
              color: "#1890FF",
            },
          },
        },

        emphasis: {
          itemStyle: {
            shadowBlur: 10,
            shadowOffsetX: 0,
            shadowColor: "rgba(0, 0, 0, 0.5)",
          },
        },
      },
    ],
  };

  option && myChart.setOption(option);
};
const init = () => {
  let chartDom = document.getElementById("barCharts");
  myChart = echarts.init(chartDom);
  drawBarCharts();
};
onMounted(() => {
  init();
});
watch(
  () => props.list,
  () => {
    init();
  },
  {
    deep: true,
  }
);
</script>

<style lang="less" scoped>
.route-watch-bar {
  width: 100%;
  height: 400px;
}
</style>
❤️总结
echarts图表在大数据可视化中间非常实用,图表之间联动效果更具直观性,同时需要掌握echarts的配置,属性,熟练应用功能,要具备抽象思维,封装组件思维,数据驱动页面思维,把基础的功能组件做好,后续的维护和扩展性才会更加方便,码字不易,希望多多支持哈~❤️❤️❤️
版权归原作者 KinHKin(五年前端) 所有, 如有侵权,请联系我们删除。