
一、理论基础
1、运行队列与平均负载
Linux进程,要么是可运行状态,要么是阻塞状态。可运行不一定是正在运行,可能是正在等待进程调度。阻塞可能是在等待IO设备数据,也可能是在等待系统调用返回。可运行进程的队列越长,处于等待状态的进程就越多。
在一定的时间内,可运行进程个数的平均值,包括正在运行的进程,即平均负载,这个时间一般为1分钟、5分钟、15分钟。理想情况下,平均负载不超过CPU核心数的70%。
2、上下文切换
单核CPU一次只能运行一个进程或线程,超线程除外,看上去多个任务在同时运行,其实是Linux内核在不同的进程间切换,公平地分配CPU时间片,这便是上下文切换。上下文切换,需要移动跟踪进程的大量信息,开销很大。
内核调度,会周期性地中断正在运行的进程,切换其它进程,引起上下文切换。如果上下文切换明显多于定时器中断,那么可能是IO请求或长时间的系统调用造成的,在这种操作不能立即完成的情况下,为了提高CPU效率,内核也会调度进程,发生上下文切换。
3、中断
硬件设备有事件需要内核处理时,会触发中断,即硬中断。如果有相应的已注册的中断处理程序,就会处理这个中断,否则将忽略。中断处理程序运行时的优先级很高,速度也很快。如果不需要高优先级时,会启动下半部,交给软中断处理程序。
4、CPU使用率
CPU状态,包括idle空闲状态、执行user用户代码的用户态、执行system系统代码的内核态、执行低优先级用户代码的友好用户态、iowait状态、irq硬中断状态、softirq软中断状态。
CPU使用率即CPU各个状态占总时间的百分比,常用来作为衡量系统性能的一个指标。理想情况下,系统CPU使用率不超过70%。
5、时间
应用程序在运行时,消耗在系统调用即内核上的时间为系统时间,消耗在依赖库和程序代码上的时间为用户时间。
分析CPU性能问题时,往往需要细化到主要是哪个函数或哪行代码在消耗CPU时间。
二、测试分析工具
1、proc
通过/proc/cpuinfo文件可以查看cpu相关信息,如下图所示。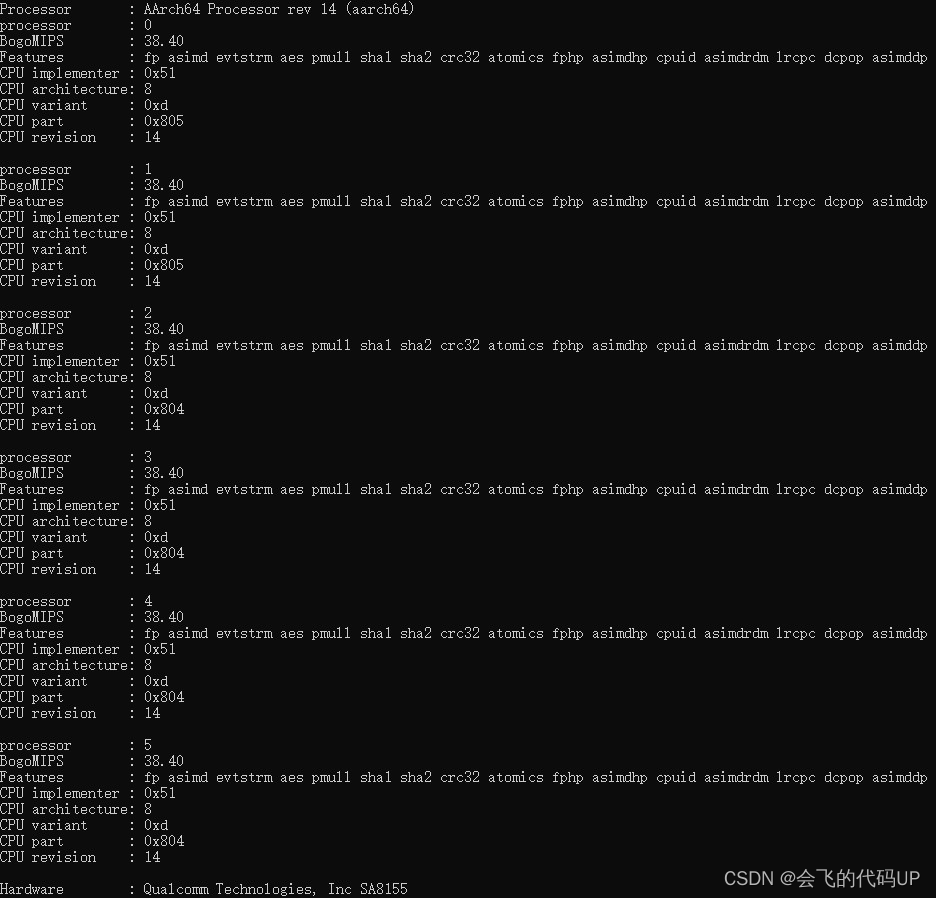
通过/proc/loadavg文件可以查看平均负载,如下图所示,各个字段从左往右依次是1分钟平均负载、5分钟平均负载、15分钟平均负载、正在运行的进程个数/进程总个数,最近一次运行的进程号。
通过/proc/interrupts文件可以查看硬中断信息,如下图所示,各个字段从左往右依次是逻辑中断号、中断在各个CPU上发生的次数、中断所属父设备名称、硬件中断号、中断触发方式、中断名称。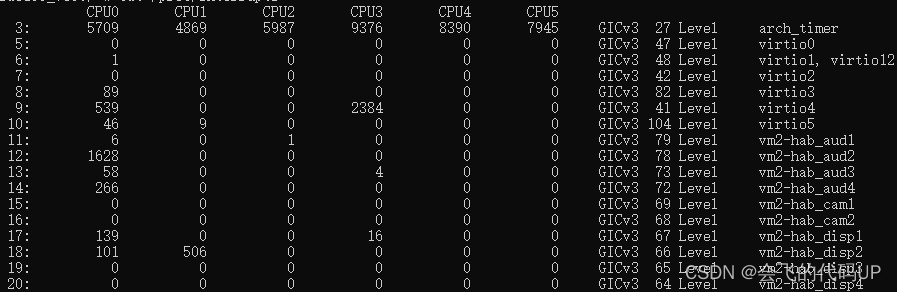
另外,后面还包括了一些IPI中断和Err数据,如下图所示。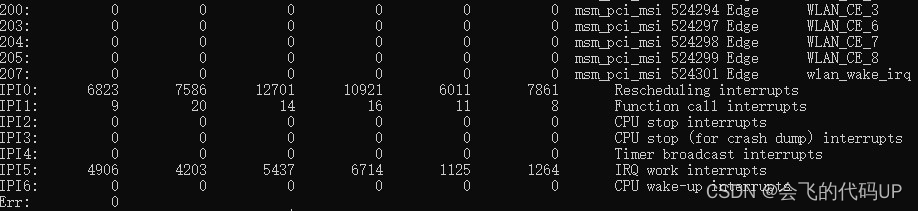
通过/proc/softirqs文件可以查看软中断信息,如下图所示,第一列表示不同的软中断类型。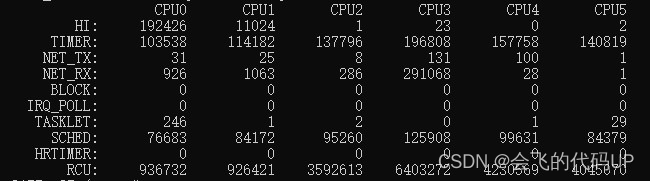
通过/proc/uptime文件可以查看系统启动到现在的时间、系统空闲时间,后者比前者多的原因是考虑到多核CPU的情况,如下图所示。
2、uptime
usage: uptime [-ps]
Tell the current time, how long the system has been running, the number
of users, and the system load averages for the past 1, 5 and 15 minutes.
-p      Pretty (human-readable) uptime
-s      Since when has the system been up?
如下图所示,是uptime的默认输出。
3、time
time,可以测量一个命令执行的时间,包括实际时间、系统时间和用户时间。
time命令包括shell内置的time命令和系统自带的/system/bin/time命令,后者有更详细的输出。
usage: time [-pv] COMMAND [ARGS...]
Run command line and report real, user, and system time elapsed in seconds.
(real = clock on the wall, user = cpu used by command's code,
system = cpu used by OS on behalf of command.)
-p      posix mode (default)
-v      verbose mode
如下图所示,是系统自带的/system/bin/time命令加-v参数的输出。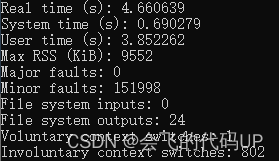
4、top
usage: top [-Hbq] [-k FIELD,] [-o FIELD,] [-s SORT] [-n NUMBER] [-m LINES] [-d SECONDS] [-p PID,] [-u USER,]
Show process activity in real time.
-H      Show threads
-k      Fallback sort FIELDS (default -S,-%CPU,-ETIME,-PID)
-o      Show FIELDS (def PID,USER,PR,NI,VIRT,RES,SHR,S,%CPU,%MEM,TIME+,CMDLINE)
-O      Add FIELDS (replacing PR,NI,VIRT,RES,SHR,S from default)
-s      Sort by field number (1-X, default 9)
-b      Batch mode (no tty)
-d      Delay SECONDS between each cycle (default 3)
-m      Maximum number of tasks to show
-n      Exit after NUMBER iterations
-p      Show these PIDs
-u      Show these USERs
-q      Quiet (no header lines)
Cursor LEFT/RIGHT to change sort, UP/DOWN move list, space to force
update, R to reverse sort, Q to exit.
如下图所示,是top命令的默认输出,既可以看到CPU使用率整体上的情况,也可以看到各个进程按CPU使用率降序排列。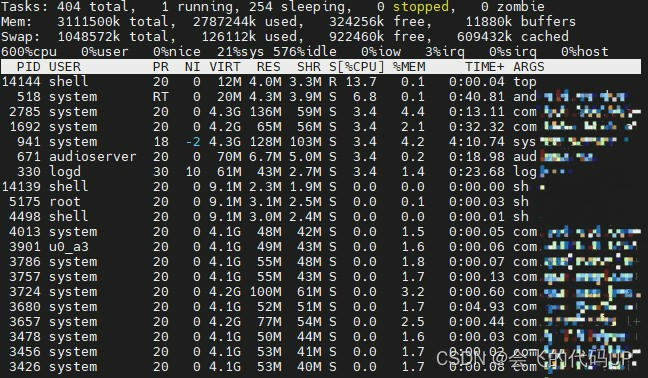
5、ps
usage: ps [-AadefLlnwZ] [-gG GROUP,] [-k FIELD,] [-o FIELD,] [-p PID,] [-t TTY,] [-uU USER,]
List processes.
Which processes to show (selections may be comma separated lists):
-A      All processes
-a      Processes with terminals that aren't session leaders
-d      All processes that aren't session leaders
-e      Same as -A
-g      Belonging to GROUPs
-G      Belonging to real GROUPs (before sgid)
-p      PIDs (--pid)
-P      Parent PIDs (--ppid)
-s      In session IDs
-t      Attached to selected TTYs
-T      Show threads
-u      Owned by USERs
-U      Owned by real USERs (before suid)
Output modifiers:
-k      Sort FIELDs in +increasing or -decreasting order (--sort)
-M      Measure field widths (expanding as necessary)
-n      Show numeric USER and GROUP
-w      Wide output (don't truncate fields)
Which FIELDs to show. (Default = -o PID,TTY,TIME,CMD)
-f      Full listing (-o USER:12=UID,PID,PPID,C,STIME,TTY,TIME,ARGS=CMD)
-l      Long listing (-o F,S,UID,PID,PPID,C,PRI,NI,ADDR,SZ,WCHAN,TTY,TIME,CMD)
-o      Output FIELDs instead of defaults, each with optional :size and =title
-O      Add FIELDS to defaults
-Z      Include LABEL
Command line -o fields:
ARGS     CMDLINE minus initial path     CMD  Command (thread) name (stat[2])
CMDLINE  Command line (argv[])          COMM Command filename (/proc/$PID/exe)
COMMAND  Command file (/proc/$PID/exe)  NAME Process name (argv[0] of $PID)
Process attribute -o FIELDs:
ADDR  Instruction pointer               BIT   Is this process 32 or 64 bits
CPU   Which processor running on        ETIME   Elapsed time since PID start
F     Flags (1=FORKNOEXEC 4=SUPERPRIV)  GID     Group id
GROUP Group name                        LABEL   Security label
MAJFL Major page faults                 MINFL   Minor page faults
NI    Niceness (lower is faster)
PCPU  Percentage of CPU time used       PCY     Android scheduling policy
PGID  Process Group ID
PID   Process ID                        PPID    Parent Process ID
PRI   Priority (higher is faster)       PSR     Processor last executed on
RGID  Real (before sgid) group ID       RGROUP  Real (before sgid) group name
RSS   Resident Set Size (pages in use)  RTPRIO  Realtime priority
RUID  Real (before suid) user ID        RUSER   Real (before suid) user name
S     Process state:
R (running) S (sleeping) D (device I/O) T (stopped)  t (traced)
Z (zombie)  X (deader)   x (dead)       K (wakekill) W (waking)
SCHED Scheduling policy (0=other, 1=fifo, 2=rr, 3=batch, 4=iso, 5=idle)
STAT  Process state (S) plus:
< high priority          N low priority L locked memory
s session leader         + foreground   l multithreaded
STIME Start time of process in hh:mm (size :19 shows yyyy-mm-dd hh:mm:ss)
SZ    Memory Size (4k pages needed to completely swap out process)
TCNT  Thread count                      TID     Thread ID
TIME  CPU time consumed                 TTY     Controlling terminal
UID   User id                           USER    User name
VSZ   Virtual memory size (1k units)    %VSZ    VSZ as % of physical memory
WCHAN What are we waiting in kernel for
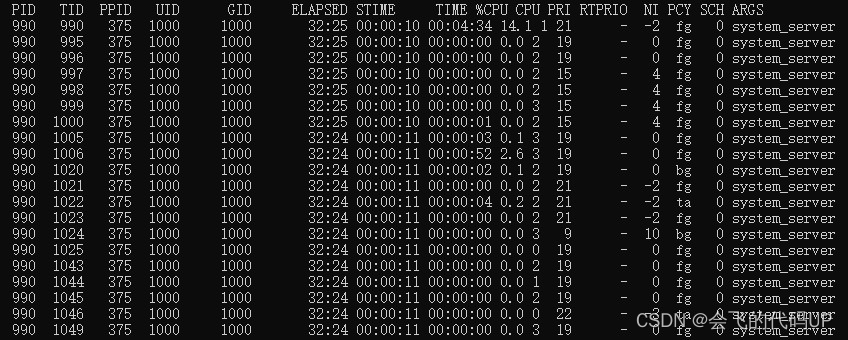
如下图所示,是这个CPU相关的ps命令的输出。
ps -p `pidof system_server` -T -o PID -o TID -o PPID -o UID -o GID -o ETIME -o STIME -o TIME -o PCPU -o CPU -o PRI -o RTPRIO -o NI -o PCY -o SCHED -o ARGS
6、vmstat
usage: vmstat [-n] [DELAY [COUNT]]
Print virtual memory statistics, repeating each DELAY seconds, COUNT times.
(With no DELAY, prints one line. With no COUNT, repeats until killed.)
Show processes running and blocked, kilobytes swapped, free, buffered, and
cached, kilobytes swapped in and out per second, file disk blocks input and
output per second, interrupts and context switches per second, percent
of CPU time spent running user code, system code, idle, and awaiting I/O.
First line is since system started, later lines are since last line.
-n      Display the header only once
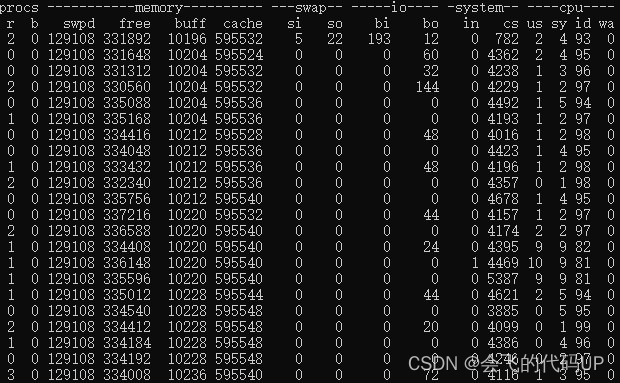
如下图所示,是DELAY为1的采样数据。正常情况下,procs下的r不超过CPU个数,system下的cs不超过in,cpu下的us、sy、id、wa加起来共100。其中,us包括用户态和友好用户态,sy包括内核态、硬中断和软中断。可以看出,system下的in和cs字段明显异常,应该是vmstat工具本身的问题。
7、mpstat
mpstat - Report processors related statistics.
Usage: mpstat [ options ] [ <interval> [ <count> ] ]
Options are:
[ -A ] [ -n ] [ -T ] [ -u ] [ -V ]
[ -I { SUM | CPU | SCPU | ALL } ] [ -N { <node_list> | ALL } ]
[ --dec={ 0 | 1 | 2 } ] [ -o JSON ] [ -P { <cpu_list> | ALL } ]
The mpstat command writes to standard output activities for each
available processor, processor 0 being the first one.  Global
average activities among all processors are also reported.  The
mpstat command can be used on both SMP and UP machines, but in
the latter, only global average activities will be printed. If no
activity has been selected, then the default report is the CPU
utilization report.
The interval parameter specifies the amount of time in seconds
between each report.  A value of 0 (or no parameters at all)
indicates that processors statistics are to be reported for the
time since system startup (boot). The count parameter can be
specified in conjunction with the interval parameter if this one
is not set to zero. The value of count determines the number of
reports generated at interval seconds apart. If the interval
parameter is specified without the count parameter, the mpstat
command generates reports continuously.
mpstat详细用法请参考下面的链接。
https://man7.org/linux/man-pages/man1/mpstat.1.html
如下图所示,是mpstat INTERVAL为1、COUNT为5的数据。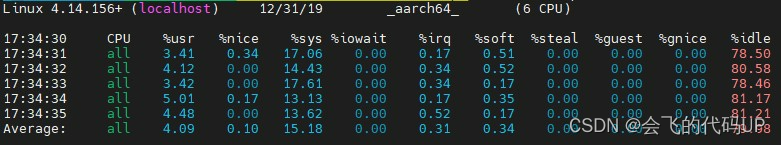
8、pidstat
pidstat - Report statistics for Linux tasks.
Usage: pidstat [ options ] [ <interval> [ <count> ] ] [ -e <program> <args> ]
Options are:
[ -d ] [ -H ] [ -h ] [ -I ] [ -l ] [ -R ] [ -r ] [ -s ] [ -t ] [ -U [ <username> ] ]
[ -u ] [ -V ] [ -v ] [ -w ] [ -C <command> ] [ -G <process_name> ]
[ -p { <pid> [,...] | SELF | ALL } ] [ -T { TASK | CHILD | ALL } ]
[ --dec={ 0 | 1 | 2 } ] [ --human ]
The pidstat command is used for monitoring individual tasks
currently being managed by the Linux kernel.  It writes to
standard output activities for every task selected with option -p
or for every task managed by the Linux kernel if option -p ALL
has been used. Not selecting any tasks is equivalent to
specifying -p ALL but only active tasks (tasks with non-zero
statistics values) will appear in the report.
The pidstat command can also be used for monitoring the child
processes of selected tasks.  Read about option -T below.
The interval parameter specifies the amount of time in seconds
between each report.  A value of 0 (or no parameters at all)
indicates that tasks statistics are to be reported for the time
since system startup (boot). The count parameter can be specified
in conjunction with the interval parameter if this one is not set
to zero. The value of count determines the number of reports
generated at interval seconds apart. If the interval parameter is
specified without the count parameter, the pidstat command
generates reports continuously.
You can select information about specific task activities using
flags.  Not specifying any flags selects only CPU activity.
pidstat详细用法请参考下面的链接。
https://man7.org/linux/man-pages/man1/pidstat.1.html
如下图所示,是pidstat的默认输出。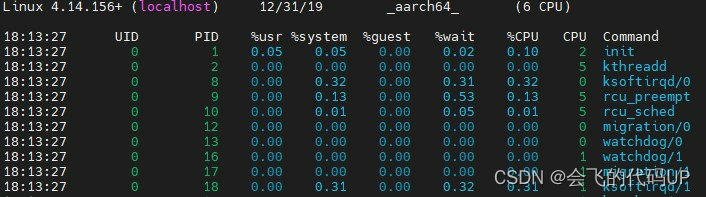
9、strace
strace,主要用于跟踪系统调用。
strace本身有一定的开销,实际使用时,其统计的系统调用次数比时间更可靠。
usage: strace [-CdffhiqrtttTvVwxxy] [-I n] [-e expr]...
[-a column] [-o file] [-s strsize] [-P path]...
-p pid... / [-D] [-E var=val]... [-u username] PROG [ARGS]
or: strace -c[dfw] [-I n] [-e expr]... [-O overhead] [-S sortby]
-p pid... / [-D] [-E var=val]... [-u username] PROG [ARGS]
Output format:
-a column      alignment COLUMN for printing syscall results (default 40)
-i             print instruction pointer at time of syscall
-o file        send trace output to FILE instead of stderr
-q             suppress messages about attaching, detaching, etc.
-r             print relative timestamp
-s strsize     limit length of print strings to STRSIZE chars (default 32)
-t             print absolute timestamp
-tt            print absolute timestamp with usecs
-T             print time spent in each syscall
-x             print non-ascii strings in hex
-xx            print all strings in hex
-y             print paths associated with file descriptor arguments
-yy            print protocol specific information associated with socket file descriptors
Statistics:
-c             count time, calls, and errors for each syscall and report summary
-C             like -c but also print regular output
-O overhead    set overhead for tracing syscalls to OVERHEAD usecs
-S sortby      sort syscall counts by: time, calls, name, nothing (default time)
-w             summarise syscall latency (default is system time)
Filtering:
-e expr        a qualifying expression: option=[!]all or option=[!]val1[,val2]...
options:    trace, abbrev, verbose, raw, signal, read, write, fault
-P path        trace accesses to path
Tracing:
-b execve      detach on execve syscall
-D             run tracer process as a detached grandchild, not as parent
-f             follow forks
-ff            follow forks with output into separate files
-I interruptible
1:          no signals are blocked
2:          fatal signals are blocked while decoding syscall (default)
3:          fatal signals are always blocked (default if '-o FILE PROG')
4:          fatal signals and SIGTSTP (^Z) are always blocked
(useful to make 'strace -o FILE PROG' not stop on ^Z)
Startup:
-E var         remove var from the environment for command
-E var=val     put var=val in the environment for command
-p pid         trace process with process id PID, may be repeated
-u username    run command as username handling setuid and/or setgid
Miscellaneous:
-d             enable debug output to stderr
-v             verbose mode: print unabbreviated argv, stat, termios, etc. args
-h             print help message
-V             print version
strace详细用法请参考下面的链接。
https://man7.org/linux/man-pages/man1/strace.1.html
如下图所示,是“strace -c ls”的结果。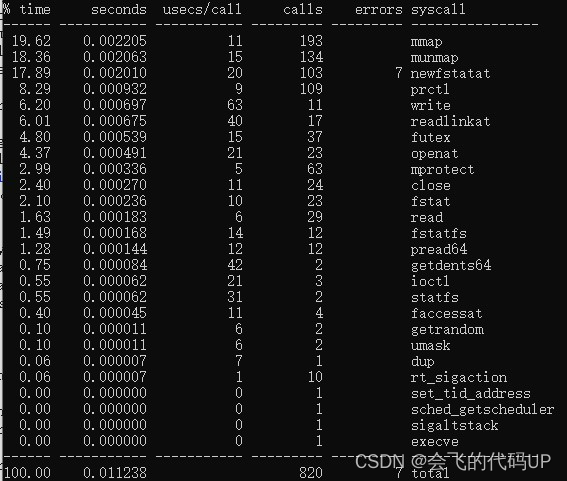
10、Android dumpsys
Android中,常用的抓取CPU数据的一个命令是dumpsys cpuinfo,如下图所示。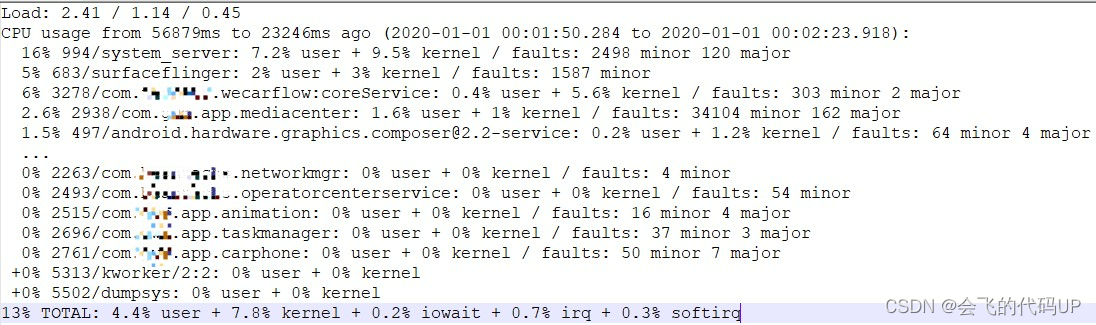
源码位置:
android/frameworks/native/cmds/dumpsys
android/frameworks/base/services/core/java/com/android/server/am/ActivityManagerService.java
android/frameworks/base/core/java/com/android/internal/os/ProcessCpuTracker.java
11、Android profiler
Android Studio的profiler可以分析CPU活动和跟踪记录,在与应用交互时实时检查应用的CPU使用率和线程活动,也可以检查记录的方法轨迹、函数轨迹和系统轨迹的详情。具体包括:Sample Java Methods、Trace Java Methods、Sample C/C++ Functions、Trace System Calls。
如下图所示,是记录方法轨迹后的CPU性能分析器。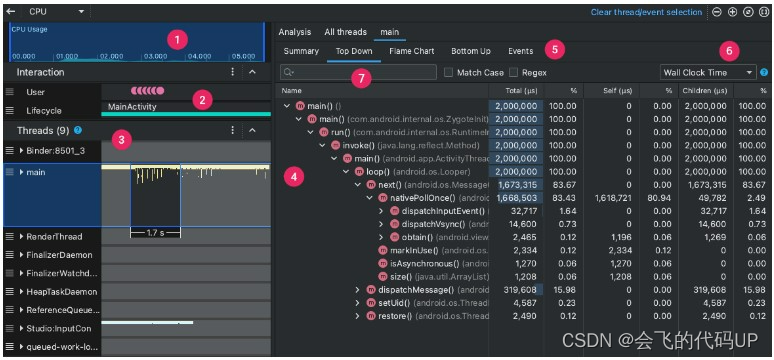
详细用法请参考下面的链接。
https://developer.android.google.cn/studio/profile/cpu-profiler
12、Android simpleperf
simpleperf是图形化工具Android Studio profiler对应的CPU性能分析命令行工具。
Usage: simpleperf [common options] subcommand [args_for_subcommand]
common options:
-h/--help     Print this help information.
--log <severity> Set the minimum severity of logging. Possible severities
include verbose, debug, warning, info, error, fatal.
Default is info.
--version     Print version of simpleperf.
subcommands:
debug-unwind        Debug/test offline unwinding.
dump                dump perf record file
help                print help information for simpleperf
kmem                collect kernel memory allocation information
list                list available event types
record              record sampling info in perf.data
report              report sampling information in perf.data
report-sample       report raw sample information in perf.data
stat                gather performance counter information
源码位置:android/system/extras/simpleperf
说明文档:android/system/extras/simpleperf/doc/README.md
详细用法请参考下面的链接。
https://developer.android.google.cn/ndk/guides/simpleperf
13、Android perfetto
在Android设备上,perfetto可以收集性能跟踪数据,数据源包括ftrace收集的内核信息,atrace收集的服务和应用中的用户空间注释,以及heapprofd收集的服务和应用的本地内存使用情况信息。
源码位置:android/external/perfetto
详细用法请参考下面的链接。
https://developer.android.google.cn/studio/command-line/perfetto
perfetto是一个开源项目,官网链接如下。
https://perfetto.dev/
14、Android systrace
Android SDK中的platform-tools有个systrace,可以收集和检查Android设备上在系统一级运行的所有进程的时间信息。
详细用法请参考下面的链接。
https://developer.android.google.cn/topic/performance/tracing/command-line
15、Android developer
Android开发者选项,有个System Tracing,类似于systrace命令行工具。
详细用法请参考下面的链接。
https://developer.android.google.cn/topic/performance/tracing/on-device
16、Android dmtracedump
Android SDK中的platform-tools有个dmtracedump,是一种用于从跟踪日志文件生成图形化调用堆栈图的工具。
详细用法请参考下面的链接。
https://developer.android.google.cn/studio/command-line/dmtracedump
17、Android retrace
R8 retrace这款工具用于从经过混淆处理的堆栈轨迹获取原始堆栈轨迹。
详细用法请参考下面的链接。
https://developer.android.google.cn/studio/command-line/retrace
三、其它工具
ld
ltrace/ldd/objdump
sysstat/sar
gperf
oprofile
procinfo
四、调优
1、普通
一般情况下,优化程序内部会导致CPU使用率高的问题代码。
2、优先级、调度策略
调整进程、线程优先级,以及调度策略,包括下面几个方面。
Niceness:nice范围从-20到19,共40个值,值越小,优先级越高。
Priority:优先级范围从0到139,共140个值,值越小,优先级越高。其中0到99共100个值为实时进程,100到139共40个值为非实时进程,后者与nice范围对应。不同的命令行工具,例如ps和top,内部有不同的优先级转换算法,看到的优先级可能是不同的。
Scheduling Policy:fifo、rr、deadline、normal/other、batch、idle。
Android Scheduling Policy:top-app、foreground、system-background、background、restricted。
3、cpuset
通过cpuset设置不同类型的进程跑在不同的cpu上,系统在启动中、启动后资源使用情况不同,可以在不同阶段动态调整为不同的cpuset策略。
例:
进程类型为top-app。
writepid /dev/cpuset/top-app/tasks
top-app类型的进程跑在cpu0到cpu7上。
write /dev/cpuset/top-app/cpus 0-7
4、cpu affinity
affinity即所谓的进程绑核,绑定进程在哪些核上运行,可以通过taskset来设置。
5、cpufreq
调频策略包括:Performance、Powersave、Userspace、Ondemand、Conservative。
详细用法请参考下面的链接。
https://www.kernel.org/doc/Documentation/cpu-freq/
版权归原作者 会飞的代码UP 所有, 如有侵权,请联系我们删除。