
说到JMeter后端监听器,大家接触比较多的是Influxdb监听器InfluxdbBackendListenerClient,可以将测试报告实时推送到Influxdb,然后用Grafana展示。但是这种方式在大并发情况下,会因为吞吐量过大,Influxdb本身的性能瓶颈,无法支撑(Influxdb崩溃是常有的事),所以使用Kafka监听器就很有必要了,Kafka作为消息队列中间件,可以起到缓冲器的作用。
本篇文章包括如下五个部分内容:
1、Kafka后端监听器原理介绍
参考 JMeter中的后端监听器_HenryXiao8080的博客
2、下载和使用
提供监听器源码路径
3、通过后端监听器收集测试结果
介始如何通过telegraf收集kafka结果数据
4、通过Grafana进行结果展示
介绍如何通过修改telegraf的配置,获取支持grafana展现的数据
5、Kafka监听器插件扩展开发
介绍如何通过二次开发,扩展监听不同的性能指标
6、有关influxdb2.x的应用介绍
通过kafka监听器可以向influxdb2推送数据
一、Kafka后端监听器原理介绍
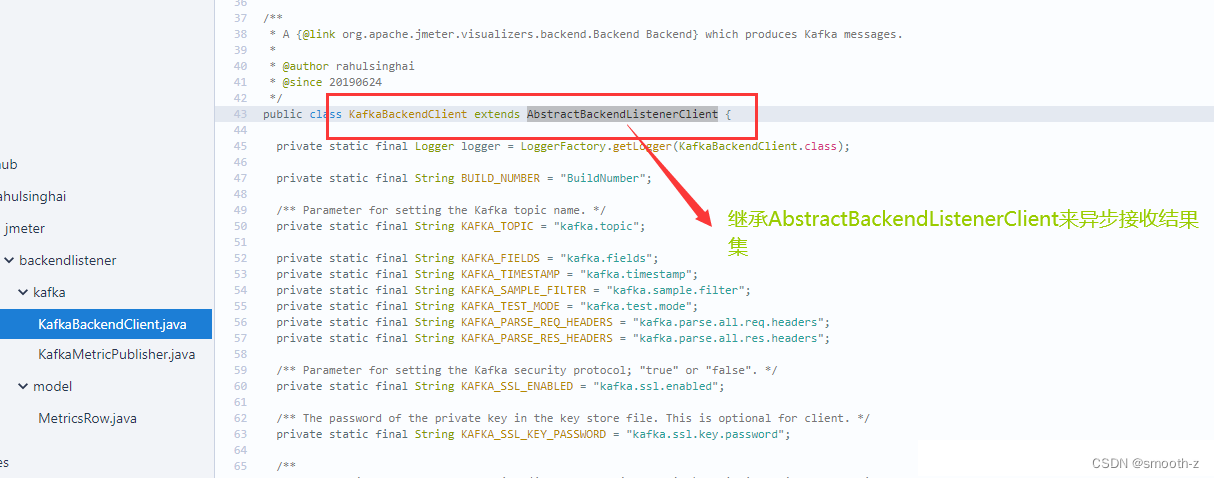
jmeter-backend-listener-kafka其实就是通过继承JMeter的AbstractBackendListenerClient来将异步获取到的测试结果集SampleResult进行相应处理(与JMeter原生自带的influxdb、graphite后端监听器原理一样),然后将元数据上报至kakfa,这样你就可以通过消费kafka Topic异步来接收测试结果集:
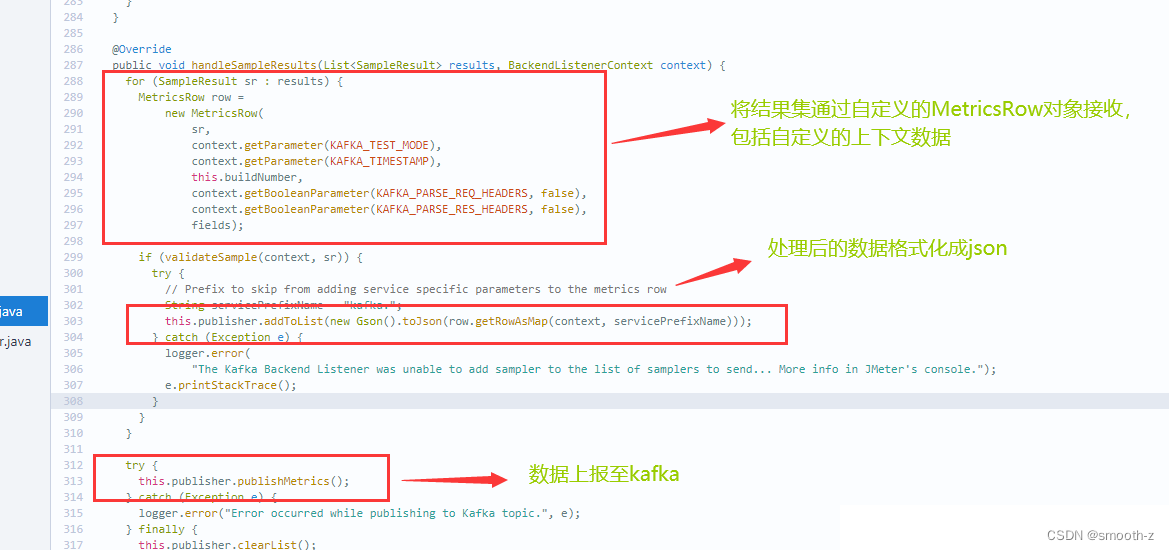
通过实现的handleSampleResults方法来处理数据并上报至kafka:
二、下载和使用Kafka后端监听器
我们可以从两个地方下载源码或releases的jar包,如下:
原始开源路径:https://github.com/rahulsinghai/jmeter-backend-listener-kafka
Metersphere路径:https://github.com/metersphere/jmeter-backend-listener-kafka
把jar包jmeter.backendlistener.kafka-1.0.4.jar放到Jmeter的lib\ext后重启JMeter即可支持:
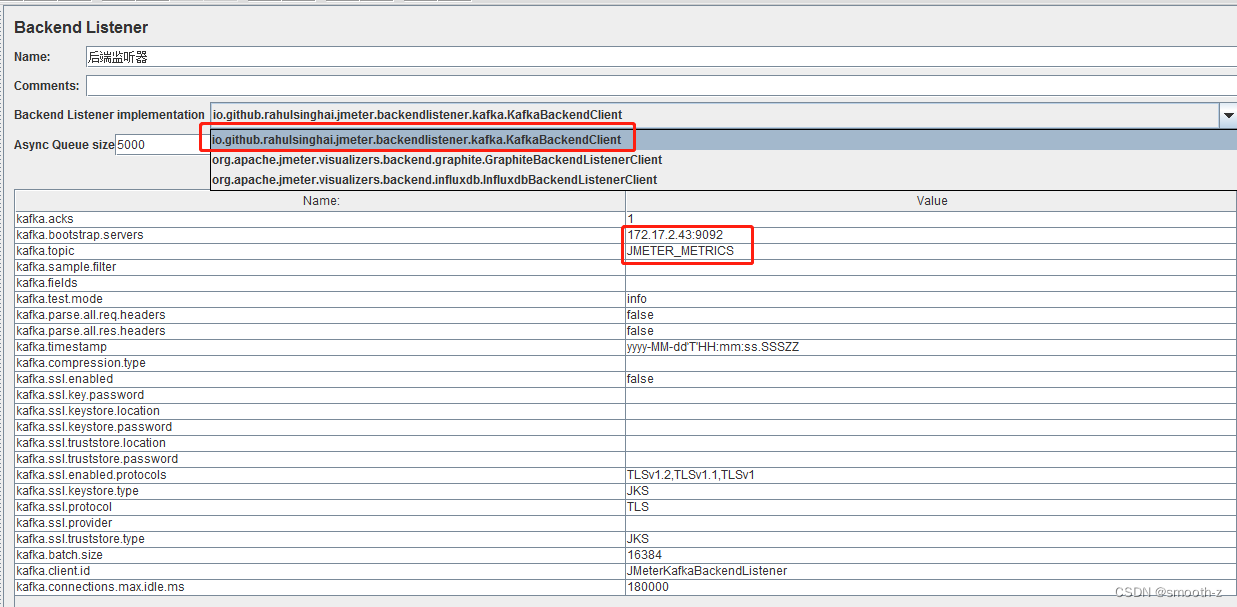
为了快速部署验证环境,我这次用Docker装了Kafka和Zookeeper集群,装了influxdb和Grafana,其中Kafka路径和端口如上图所标示,测试前请确保Kafka服务和端口是连通的。
三、通过后端监听器收集测试结果
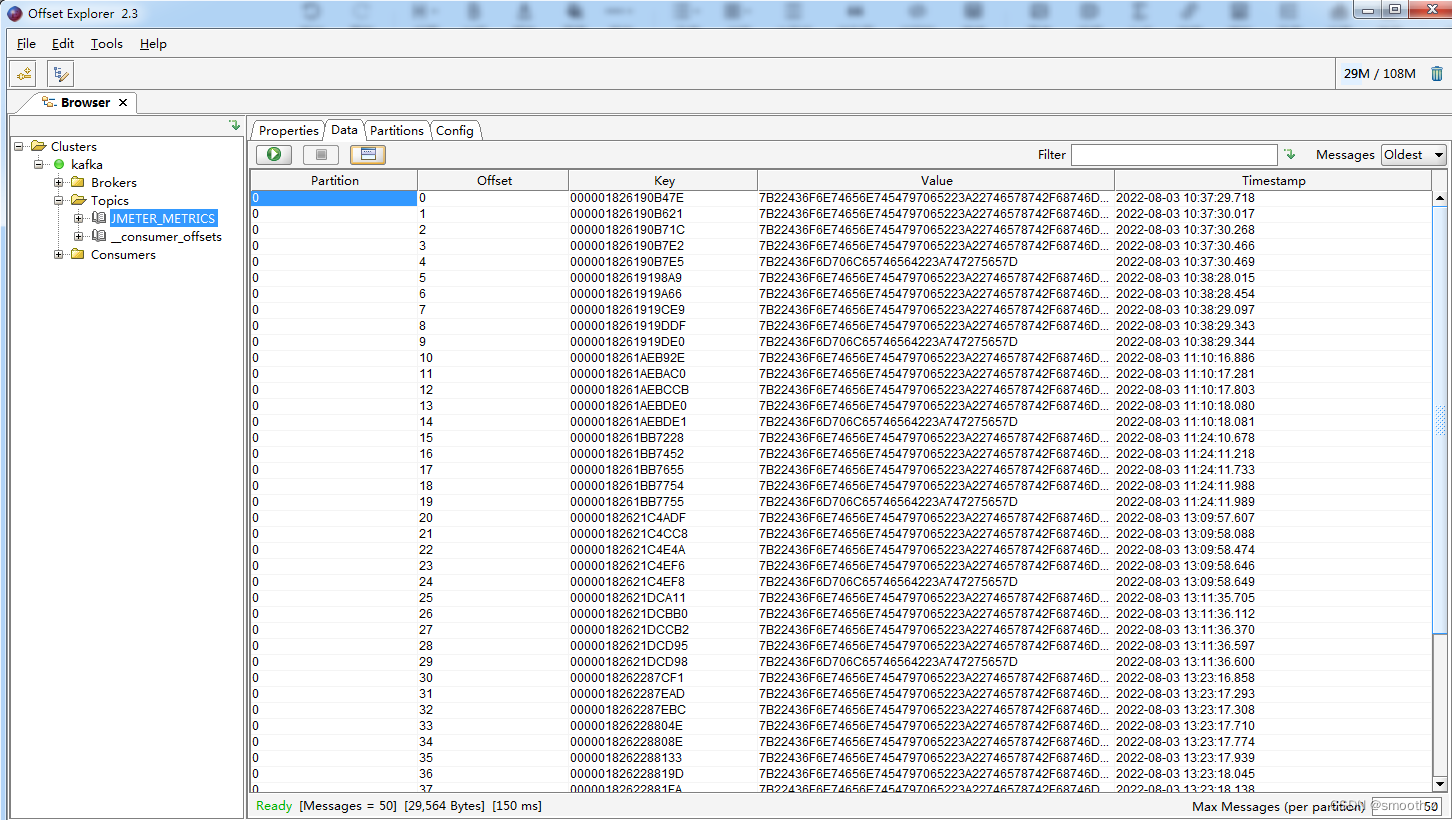
我们按上图配置好后端监听器,并执行JMeter测试,然后用Offset Explorer连接kafka可以查看到我们监听器收集到的报告数据:
由于存储的是编码后的Key-value格式,我们可以用Telegraf消费消息,往influxdb存储消息,来看收到的是什么消息(当然,你也可以采用别的方式)。
Telegraf的配置如下:
首先配置Output(主要是influxdb的url和database):
###############################################################################
#                            OUTPUT PLUGINS                                   #
###############################################################################

# Configuration for sending metrics to InfluxDB
[[outputs.influxdb]]
  ## The full HTTP or UDP URL for your InfluxDB instance.
  ##
  ## Multiple URLs can be specified for a single cluster, only ONE of the
  ## urls will be written to each interval.
  # urls = ["unix:///var/run/influxdb.sock"]
  # urls = ["udp://127.0.0.1:8089"]
  urls = ["http://172.17.2.130:8086"]

  ## The target database for metrics; will be created as needed.
  ## For UDP url endpoint database needs to be configured on server side.
  database = "kafka"
然后配置Input(为了方便查看只配置kafka,把默认其他的CPU、disk等注释掉,以免干扰):
# # Read metrics from Kafka topic(s)
 [[inputs.kafka_consumer]]
#   ## kafka servers
   brokers = ["172.17.2.43:9092"]
#   ## topic(s) to consume
   topics = ["JMETER_METRICS"]
#   ## Add topic as tag if topic_tag is not empty
   topic_tag = "JMETER_METRICS"
#   ## the name of the consumer group
   consumer_group = "telegraf_metrics_consumers"
#   ## Offset (must be either "oldest" or "newest")
   offset = "oldest"
#   ## Data format to consume.
#   ## Each data format has its own unique set of configuration options, read
#   ## more about them here:
#   ## https://github.com/influxdata/telegraf/blob/master/docs/DATA_FORMATS_INPUT.md
   data_format = "value"
   data_type = "string"
启动telegraf,看同步数据的日志是否正常:
2022-08-04T00:29:48Z I! Starting Telegraf 1.10.2
2022-08-04T00:29:48Z I! Loaded inputs: kafka_consumer
2022-08-04T00:29:48Z I! Loaded aggregators:
2022-08-04T00:29:48Z I! Loaded processors:
2022-08-04T00:29:48Z I! Loaded outputs: influxdb
2022-08-04T00:29:48Z I! Tags enabled: host=172.17.2.43
2022-08-04T00:29:48Z I! [agent] Config: Interval:10s, Quiet:false, Hostname:"172.17.2.43", Flush Interval:10s
2022-08-04T00:29:48Z I! Started the kafka consumer service, brokers: [172.17.2.43:9092], topics: [JMETER_METRICS]
同步正常,我们就用InfluxDB Studio连接influxdb查看收集到的数据:
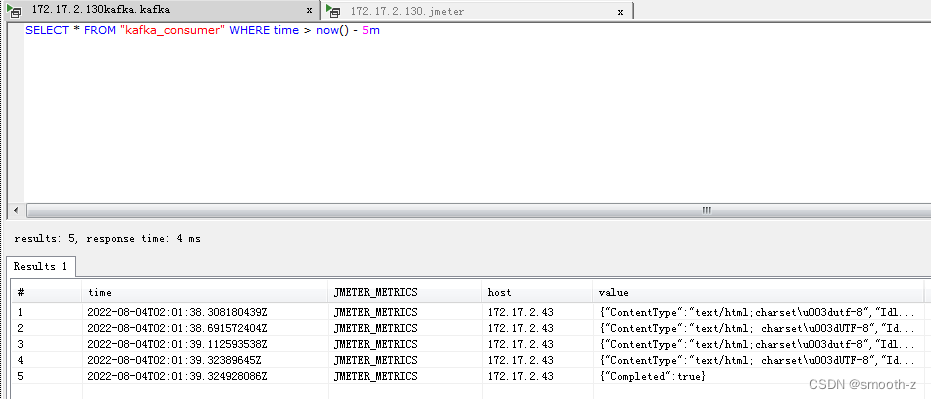
查看value值,可以看到收集到的测试结果内容,value值如下:
{
\"ContentType\":\"text/html; charset\\u003dUTF-8\",
\"IdleTime\":0,
\"ElapsedTime\":\"2022-08-04T00:00:01.000+0800\",
\"ErrorCount\":0,
\"Timestamp\":\"2022-08-04T10:01:22.259+0800\",
\"URL\":\"https://mp.weixin.qq.com/s/dWBD8ZNYnzuao5ca3gMi3Q\",
\"SampleStartTime\":\"2022-08-04T10:01:22.259+0800\",
\"Success\":true,
\"Bytes\":64438,
\"SentBytes\":689,
\"AllThreads\":1,
\"TestElement.name\":\"Thread-11\",
\"DataType\":\"text\",
\"ResponseTime\":396,
\"SampleCount\":1,
\"FailureMessage\":\"\",
\"ConnectTime\":176,
\"ResponseCode\":\"200\",
\"TestStartTime\":1659578481614,
\"AssertionResults\":[
],
\"Latency\":342,
\"InjectorHostname\":\"ZGH-PC\",
\"GrpThreads\":1,
\"SampleEndTime\":\"2022-08-04T10:01:22.655+0800\",
\"BodySize\":61665,
\"ThreadName\":\"threadGroup 1-1\",
\"SampleLabel\":\"chrome-192.168.1.246\"
}
其实我们看kafka监听器的源码/jmeter/backendlistener/model/MetricsRow.java,也能知道收集的测试结果数据格式:
public Map<String, Object> getRowAsMap(BackendListenerContext context, String servicePrefixName)
      throws UnknownHostException {
    SimpleDateFormat sdf = new SimpleDateFormat(this.kafkaTimestamp);

    // add all the default SampleResult parameters
    addFilteredMetricToMetricsMap("AllThreads", this.sampleResult.getAllThreads());
    addFilteredMetricToMetricsMap("BodySize", this.sampleResult.getBodySizeAsLong());
    addFilteredMetricToMetricsMap("Bytes", this.sampleResult.getBytesAsLong());
    addFilteredMetricToMetricsMap("SentBytes", this.sampleResult.getSentBytes());
    addFilteredMetricToMetricsMap("ConnectTime", this.sampleResult.getConnectTime());
    addFilteredMetricToMetricsMap("ContentType", this.sampleResult.getContentType());
    addFilteredMetricToMetricsMap("DataType", this.sampleResult.getDataType());
    addFilteredMetricToMetricsMap("ErrorCount", this.sampleResult.getErrorCount());
    addFilteredMetricToMetricsMap("GrpThreads", this.sampleResult.getGroupThreads());
    addFilteredMetricToMetricsMap("IdleTime", this.sampleResult.getIdleTime());
    addFilteredMetricToMetricsMap("Latency", this.sampleResult.getLatency());
    addFilteredMetricToMetricsMap("ResponseTime", this.sampleResult.getTime());
    addFilteredMetricToMetricsMap("SampleCount", this.sampleResult.getSampleCount());
    addFilteredMetricToMetricsMap("SampleLabel", this.sampleResult.getSampleLabel());
    addFilteredMetricToMetricsMap("ThreadName", this.sampleResult.getThreadName());
    addFilteredMetricToMetricsMap("URL", this.sampleResult.getURL());
    addFilteredMetricToMetricsMap("ResponseCode", this.sampleResult.getResponseCode());
    addFilteredMetricToMetricsMap("TestStartTime", JMeterContextService.getTestStartTime());
    addFilteredMetricToMetricsMap(
        "SampleStartTime", sdf.format(new Date(this.sampleResult.getStartTime())));
    addFilteredMetricToMetricsMap(
        "SampleEndTime", sdf.format(new Date(this.sampleResult.getEndTime())));
    addFilteredMetricToMetricsMap(
        "Timestamp", sdf.format(new Date(this.sampleResult.getTimeStamp())));
    addFilteredMetricToMetricsMap("InjectorHostname", InetAddress.getLocalHost().getHostName());

    // Add the details according to the mode that is set
    switch (this.kafkaTestMode) {
      case "debug":
      case "error":
        addDetails();
        break;
      case "info":
        if (!this.sampleResult.isSuccessful()) {
          addDetails();
        }
        break;
      default:
        break;
    }

    addAssertions();
    addElapsedTime(sdf);
    addCustomFields(context, servicePrefixName);
    parseHeadersAsJsonProps(this.allReqHeaders, this.allResHeaders);

    return this.metricsMap;
  }
大家发现这些内容,只要经过计算就可以生成JMeter测试报告,有线程数,有响应时间,有Sample名称数量和成功标识、Bytes等指标。但是缺少TPS,90%响应时间等指标,这些指标可以参考Influxdb监听器自己进行扩展和重计数。
四、通过Grafana进行结果展示
以上的Key Value格式是不利于在Grafana中展现的,我们可以在Telegraf中改变传输格式为json:
# # Read metrics from Kafka topic(s)
 [[inputs.kafka_consumer]]
#   ## kafka servers
   brokers = ["172.17.2.43:9092"]
#   ## topic(s) to consume 可以添加多个测试项目的topic
   topics = ["JMETER_METRICS"]
#   ## Add topic as tag if topic_tag is not empty
   topic_tag = "JMETER_METRICS"
#   ## the name of the consumer group
   consumer_group = "telegraf_metrics_consumers"
#   ## Offset (must be either "oldest" or "newest")
   offset = "oldest"
#   ## Data format to consume.
#   ## Each data format has its own unique set of configuration options, read
#   ## more about them here:
#   ## https://github.com/influxdata/telegraf/blob/master/docs/DATA_FORMATS_INPUT.md
   data_format = "json"
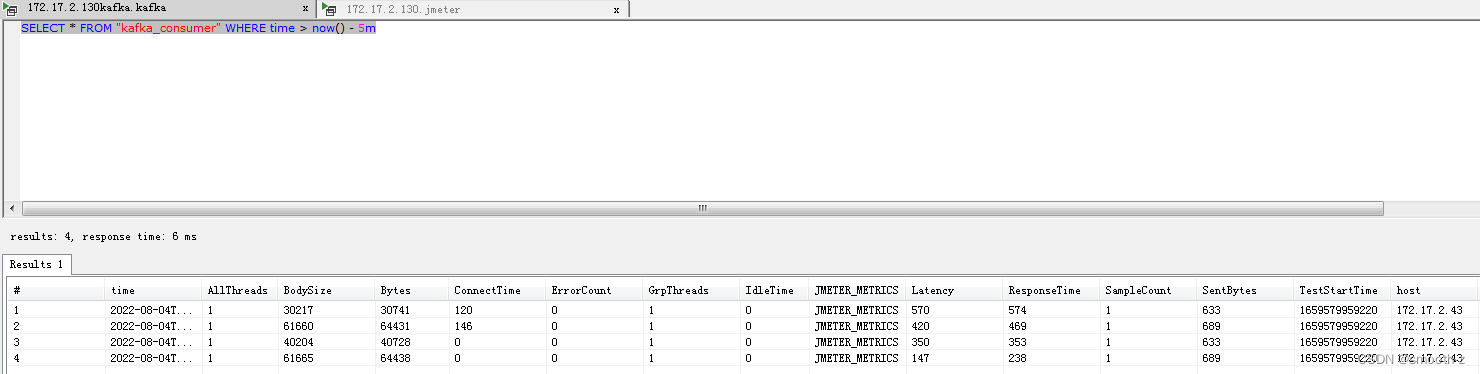
再次测试,这时候发现能够在influxdb中按不同字段显示指标值了:
但是展示的字段不全,到telegraf官网查看配置说明,发现可以添加显示字段:

修改telegraf.conf配置,在data_format配置下添加缺少的字段,同时把SampleLabel添加为tag Key(也可以按需要添加多个):
#   ## Data format to consume.
#   ## Each data format has its own unique set of configuration options, read
#   ## more about them here:
#   ## https://github.com/influxdata/telegraf/blob/master/docs/DATA_FORMATS_INPUT.md
     data_format = "json"
     tag_keys = ["SampleLabel"]
     json_string_fields=["Success", "ThreadName", "SampleLabel", "Timestamp", "URL", "FailureMessage", "ResponseCode", "AssertionResults", "InjectorHostname", "SampleStartTime", "SampleEndTime"]
再次测试,查看inluxdb中同步的结果数据,发现能看到更多的字段了:
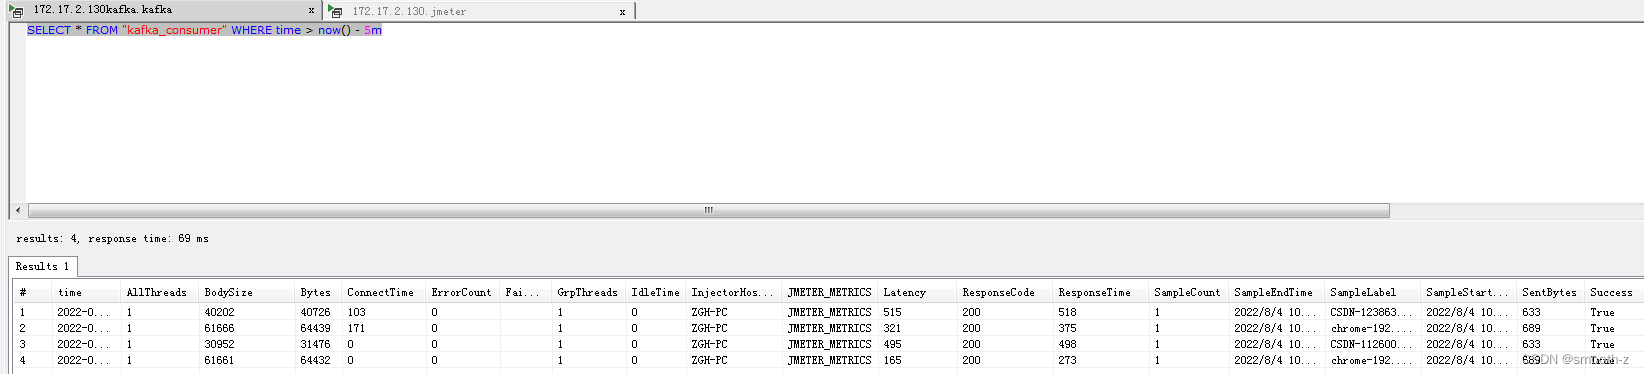
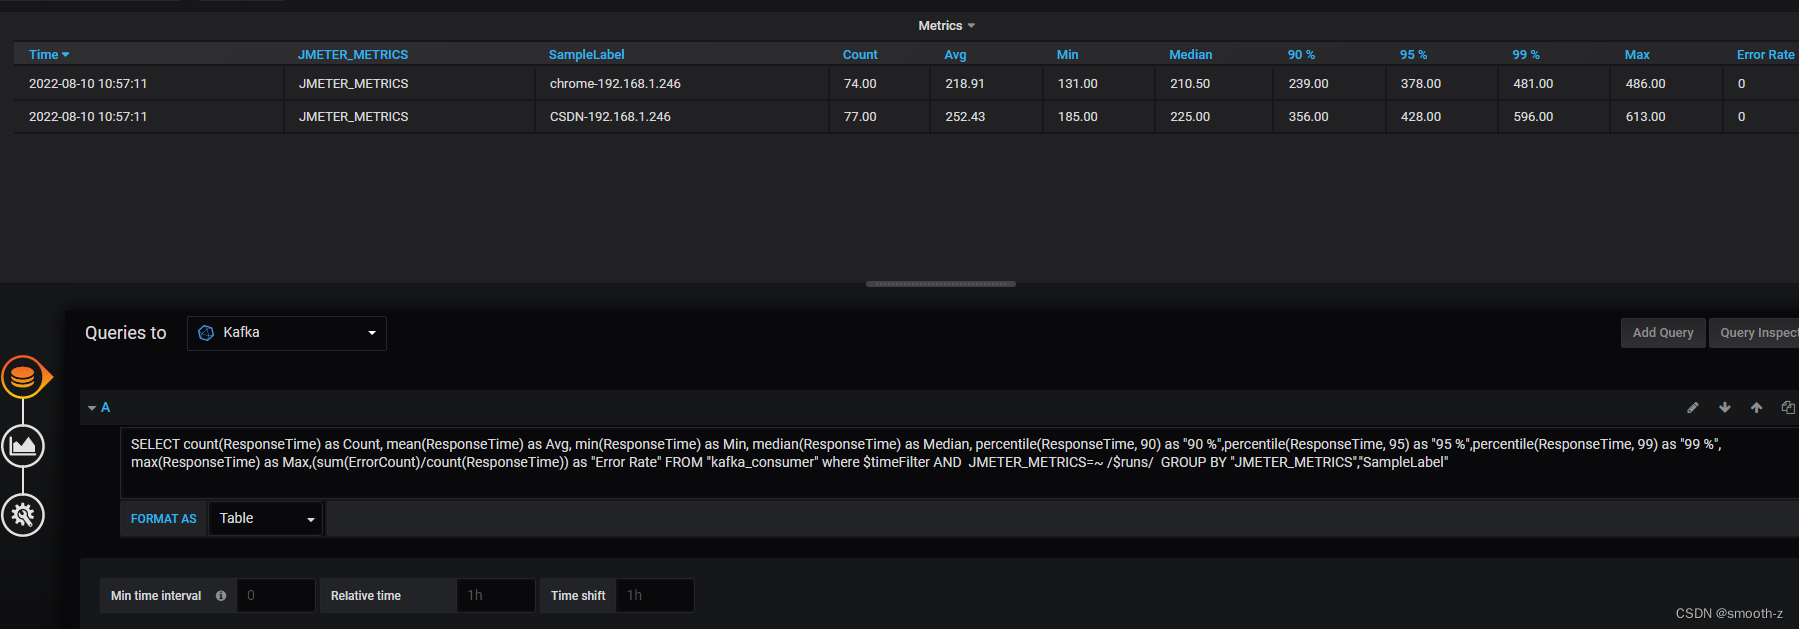
有了这些字段,我们就可以在grafana中配置展示:
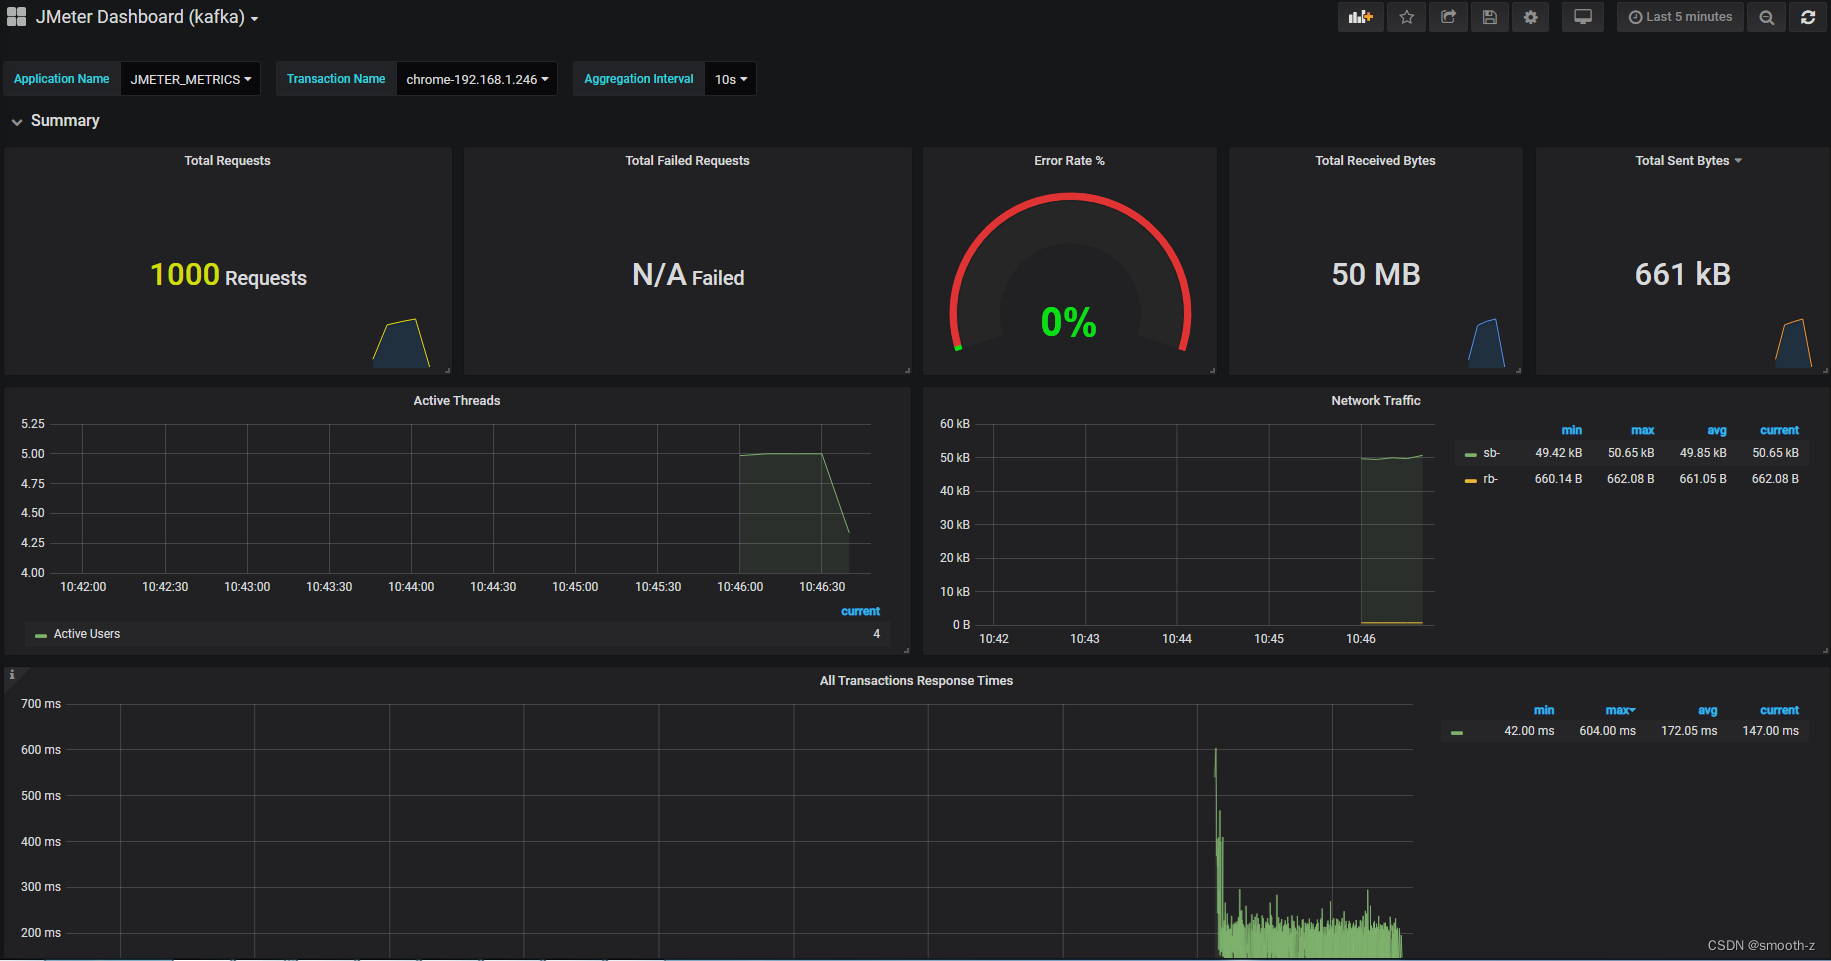
五、Kafka监听器插件扩展开发
通过上面的演示,我们发现不能像influxdb后端监听器那样收集到【点击率hits】等常规的性能指标,那么我们可以参考Influxdb后端监听器的源码对Kafka监听器进行改造,同过由上面提到的监听器原理可以知道,监听器是通过handleSampleResults方法来处理数据并上报至kafka或influxdb,那么我们就从这个函数着手,这个函数所属于KafkaBackendClient.java类文件中:
io.github.rahulsinghai.jmeter.backendlistener.kafka.KafkaBackendClient
我们将handleSampleResults方法修改如下(注释为add的内容):
@Override
  public void handleSampleResults(List<SampleResult> results, BackendListenerContext context) {
    for (SampleResult sr : results) {
      String sampleLabel = sr.getSampleLabel();   // add部分
      SamplerMetric samplerMetric = getSamplerMetric(sampleLabel); // add部分
      /* jmeter 5.1.1之后版本,SamplerMetric支持addCumulated
      Pattern samplersToFilter;
      if (samplersToFilter.matcher(sampleLabel).find()) {
         samplerMetric.add(sr);
      }
      samplerMetric = getSamplerMetric("all");
      samplerMetric.addCumulated(sr);
      */
      samplerMetric.add(sr); // add部分

      MetricsRow row =
          new MetricsRow(
              sr,
              context.getParameter(KAFKA_TEST_MODE),
              context.getParameter(KAFKA_TIMESTAMP),
              this.buildNumber,
              context.getBooleanParameter(KAFKA_PARSE_REQ_HEADERS, false),
              context.getBooleanParameter(KAFKA_PARSE_RES_HEADERS, false),
              fields,
              samplerMetric);  // add参数samplerMetric

      if (validateSample(context, sr)) {
        try {
          // Prefix to skip from adding service specific parameters to the metrics row
          String servicePrefixName = "kafka.";
          this.publisher.addToList(new Gson().toJson(row.getRowAsMap(context, servicePrefixName)));
        } catch (Exception e) {
          logger.error(
              "The Kafka Backend Listener was unable to add sampler to the list of samplers to send... More info in JMeter's console.");
          e.printStackTrace();
        }
      }
    }
我们在这个方法中增加了SamplerMetric的调用(上面标示的add 部分),关于SamplerMetric类中我们可以看到有我们需要的指标计算,可以get到我们所要的指标,如下:
    public int getTotal() {
        return successes+failures;
    }

    public int getSuccesses() {
        return successes;
    }

    public int getFailures() {
        return failures;
    }

    public double getOkMaxTime() {
        return okResponsesStats.getMax();
    }

    public double getOkMinTime() {
        return okResponsesStats.getMin();
    }

    public double getOkMean() {
        return okResponsesStats.getMean();
    }

    public double getOkPercentile(double percentile) {
        return okResponsesStats.getPercentile(percentile);
    }

    public double getKoMaxTime() {
        return koResponsesStats.getMax();
    }

    public double getKoMinTime() {
        return koResponsesStats.getMin();
    }

    public double getKoMean() {
        return koResponsesStats.getMean();
    }

    public double getKoPercentile(double percentile) {
        return koResponsesStats.getPercentile(percentile);
    }

    public double getAllMaxTime() {
        return allResponsesStats.getMax();
    }

    public double getAllMinTime() {
        return allResponsesStats.getMin();
    }

    public double getAllMean() {
        return allResponsesStats.getMean();
    }

    public double getAllPercentile(double percentile) {
        return pctResponseStats.getPercentile(percentile);
    }

    /**
     * Returns hits to server
     * @return the hits
     */
    public int getHits() {
        return hits;
    }

    public Map<ErrorMetric, Integer> getErrors() {
        return errors;
    }

    public long getSentBytes() {
        return sentBytes;
    }

    public long getReceivedBytes() {
        return receivedBytes;
    }
由于我们在MetricsRow方法调用时加了samplerMetric参数,所以需要改一下MetricsRow类的构造函数(add参数):
public MetricsRow(
      SampleResult sr,
      String testMode,
      String timeStamp,
      int buildNumber,
      boolean parseReqHeaders,
      boolean parseResHeaders,
      Set<String> fields,
      SamplerMetric samplerMetric) {  // add参数 samplerMetric
    this.sampleResult = sr;
    this.kafkaTestMode = testMode.trim();
    this.kafkaTimestamp = timeStamp.trim();
    this.ciBuildNumber = buildNumber;
    this.metricsMap = new HashMap<>();
    this.allReqHeaders = parseReqHeaders;
    this.allResHeaders = parseResHeaders;
    this.fields = fields;
    this.samplerMetric = samplerMetric;
  }
然后我们在MetricsRow的getRowAsMap函数中就可以添加SamplerMetric类提供的指标,以下只具例了其中三个指标:
addFilteredMetricToMetricsMap(
            "Hits", this.samplerMetric.getHits());
addFilteredMetricToMetricsMap(
            "TotalRequest", this.samplerMetric.getTotal());
addFilteredMetricToMetricsMap(
            "AllMaxTime", this.samplerMetric.getAllMaxTime());
重新构建 jmeter-backend-listener-kafka 的源代码,生成jar包,替换Jmeter原来的jar包,重新测试,这回我们就可以看到数据库中收集到指标就有Hits了:
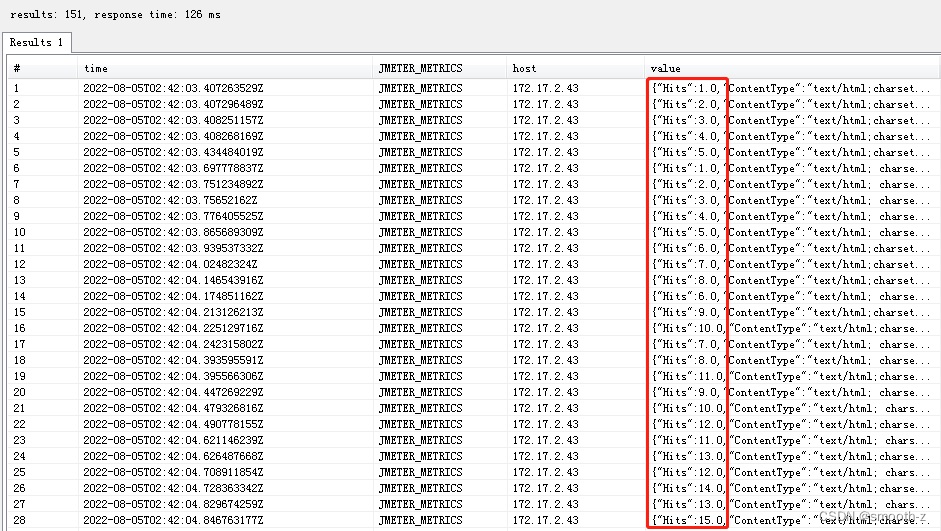
这样添加指标的目的就达到了,如果还需要其他指标,也可以基于这个方式继续在MetricsRow中的getRowAsMap函数中添加各类指标,以上过程其实不难理解,只要懂点Java的并在理解了监听器原理后,参照influxdb监听器的源代码我们就轻松完成Kafka监听器的改造,如果对性能指标的计算原理了解的话,还可以扩展个性化的性能指标计算。
当然,我们完全可以不用去改造jmeter-backend-listener-kafka,只要在外部加个处理程序,对收集到的基础sampler指标值进行重计算,就像JMeter的html报告生成那样,通过计算也能得到想要的性能测试报告。另外还可以像Metersphere那样,加个 data-streaming 读取kafka数据,并重计算后发给mysql保存,最后从mysql读取测试结果数据进行报告展现(其中data-streaming对测试结果数据的计算处理应该也是借鉴了JMeter原生代码)
六、有关influxdb2.x应用介绍
由于influxdb已经推出2.x版本,以上都是基于1.x版本,下一篇文章会提到influxdb2监听器的使用《JMeter关于influxDB 2.x 后端监听器使用》,对于Kafka监听器来说,通过telegraf也可以支持influxdb2的数据格式传输,目前telegraf已经支持influxdb2的数据写入:
[[outputs.influxdb_v2]]
  urls = ["http://localhost:8086"]
  token = "$INFLUX_TOKEN"
  organization = "example-org"
  bucket = "example-bucket"
参考influxdb的官方文档Manually configure Telegraf for InfluxDB v2.0 | InfluxDB OSS 2.0 Documentation
传给influxdb2的数据在influxdb界面上也可以查询的到:
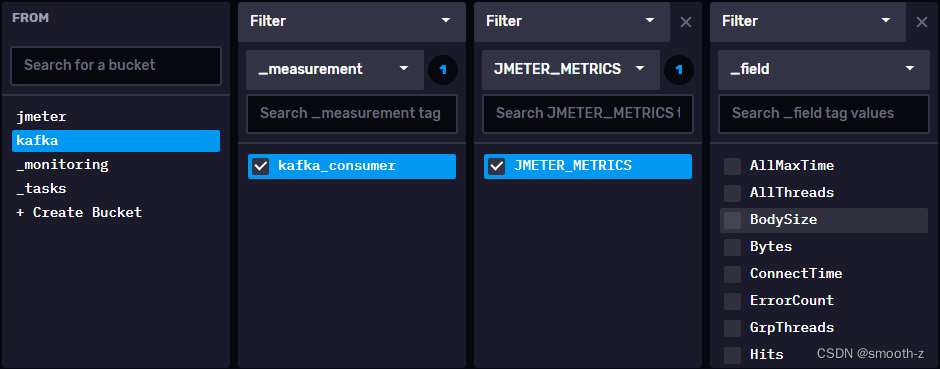
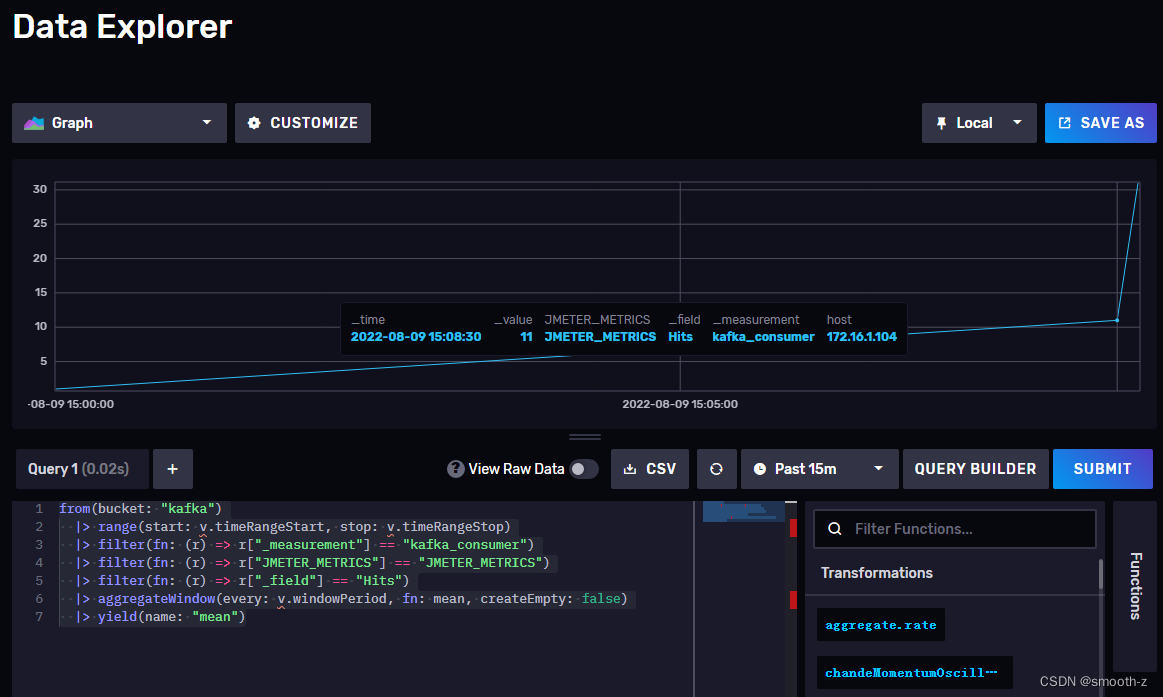
通过InfluxDB 2.x的flux语法可以展示Hits图:
from(bucket: "kafka")
  |> range(start: v.timeRangeStart, stop: v.timeRangeStop)
  |> filter(fn: (r) => r["_measurement"] == "kafka_consumer")
  |> filter(fn: (r) => r["JMETER_METRICS"] == "JMETER_METRICS")
  |> filter(fn: (r) => r["_field"] == "Hits")
  |> aggregateWindow(every: v.windowPeriod, fn: mean, createEmpty: false)
  |> yield(name: "mean")
 目前主要是Grafana官网上提供Jmeter的influxdb2格式模板比较少,希望以后能多一些,因为基于influxdb2.x的Grafana展示效果会比influxdb1.x要好。
版权归原作者 smooth-z 所有, 如有侵权,请联系我们删除。