
1 概述
线上站点普遍是https,因此监控https web站点的证书的过期时间,是一个基础性需求。例如,证书过期会导致tls握手失败,进而导致用户无法正常访问web站点。
blackbox-expoter是一个web服务,它暴露了一个接口,访问这个接口能使得它去访问目标站点,并向客户端响应相关的web站点指标信息。prometheus和black-expoter结合使用,可以监控https web站点的响应时间、证书过期时间等。
2 blackbox-expoter
2.1 指标接口
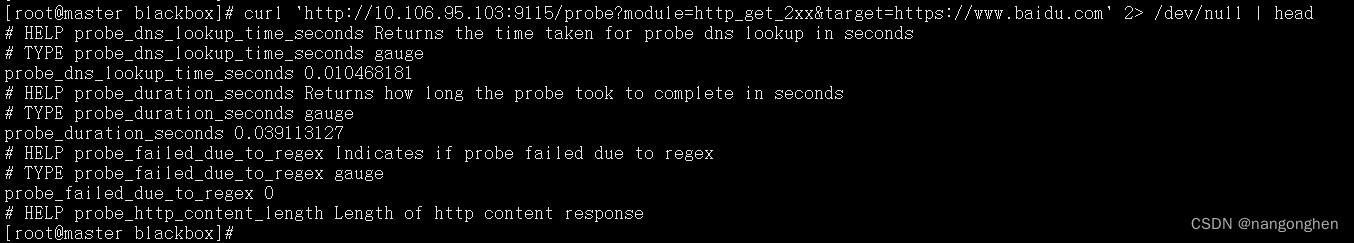
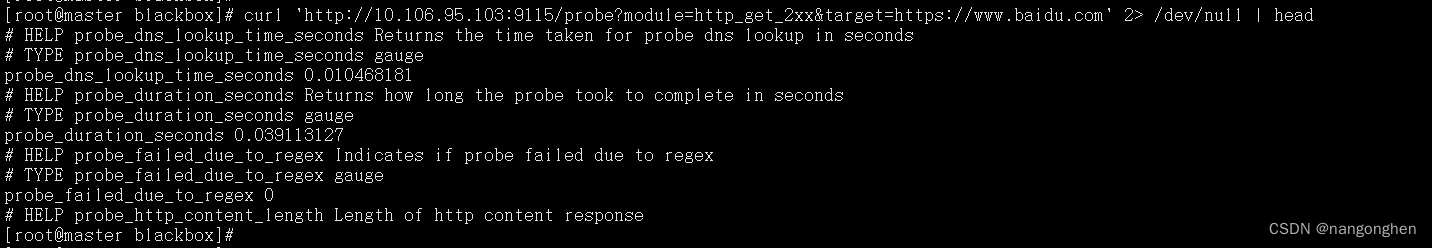
格式:
GET /probe?module=模块名&target=<网址>
例子:
GET /probe?module=http_get_2xx&target=https://www.baidu.com
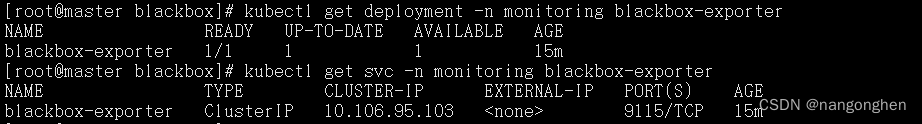
2.2 部署
blackbox-exporter的配置中定义了多种模块,例如ping,http_get_2xx等,模块名称可以自行定义。
apiVersion: v1
kind: Namespace
metadata:
  name: monitoring

---

apiVersion: v1
kind: Service
metadata:
  name: blackbox-exporter
  namespace: monitoring
  labels:
    k8s-app: blackbox-exporter
spec:
  type: ClusterIP
  ports:
  - name: http
    port: 9115
    targetPort: 9115
  selector:
    k8s-app: blackbox-exporter

---

apiVersion: apps/v1
kind: Deployment
metadata:
  name: blackbox-exporter
  namespace: monitoring
  labels:
    k8s-app: blackbox-exporter
spec:
  replicas: 1
  selector:
    matchLabels:
      k8s-app: blackbox-exporter
  template:
    metadata:
      labels:
        k8s-app: blackbox-exporter
    spec:
      containers:
      - name: blackbox-exporter
        image: prom/blackbox-exporter:latest
        args:
        - --config.file=/etc/blackbox_exporter/blackbox.yml
        - --web.listen-address=:9115
        - --log.level=info
        ports:
        - name: http
          containerPort: 9115
        resources:
          limits:
            cpu: 200m
            memory: 256Mi
          requests:
            cpu: 100m
            memory: 50Mi
        livenessProbe:
          tcpSocket:
            port: 9115
          initialDelaySeconds: 5
          timeoutSeconds: 5
          periodSeconds: 10
          successThreshold: 1
          failureThreshold: 3
        readinessProbe:
          tcpSocket:
            port: 9115
          initialDelaySeconds: 5
          timeoutSeconds: 5
          periodSeconds: 10
          successThreshold: 1
          failureThreshold: 3
        volumeMounts:
        - name: config
          mountPath: /etc/blackbox_exporter
      volumes:
      - name: config
        configMap:
          name: blackbox-exporter

---

apiVersion: v1
kind: ConfigMap
metadata:
  name: blackbox-exporter
  namespace: monitoring
  labels:
    app: blackbox-exporter
data:
  blackbox.yml: |-
    modules:
      ## ----------- TCP 检测模块配置 -----------
      tcp_connect:
        prober: tcp
        timeout: 5s
      ## ----------- ICMP 检测配置 -----------
      ping:
        prober: icmp
        timeout: 5s
        icmp:
          preferred_ip_protocol: "ip4"
      ## ----------- HTTP GET 2xx 检测模块配置 -----------
      http_get_2xx:
        prober: http
        timeout: 10s
        http:
          method: GET
          preferred_ip_protocol: "ip4"
          valid_http_versions: ["HTTP/1.1","HTTP/2"]
          valid_status_codes: [200]           # 验证的HTTP状态码,默认为2xx
          no_follow_redirects: false          # 是否不跟随重定向
      ## ----------- HTTP GET 3xx 检测模块配置 -----------
      http_get_3xx:
        prober: http
        timeout: 10s
        http:
          method: GET
          preferred_ip_protocol: "ip4"
          valid_http_versions: ["HTTP/1.1","HTTP/2"]
          valid_status_codes: [301,302,304,305,306,307]  # 验证的HTTP状态码,默认为2xx
          no_follow_redirects: false                     # 是否不跟随重定向
      ## ----------- HTTP POST 监测模块 -----------
      http_post_2xx:
        prober: http
        timeout: 10s
        http:
          method: POST
          preferred_ip_protocol: "ip4"
          valid_http_versions: ["HTTP/1.1", "HTTP/2"]
          #headers:                             # HTTP头设置
          #  Content-Type: application/json
          #body: '{}'                           # 请求体设置
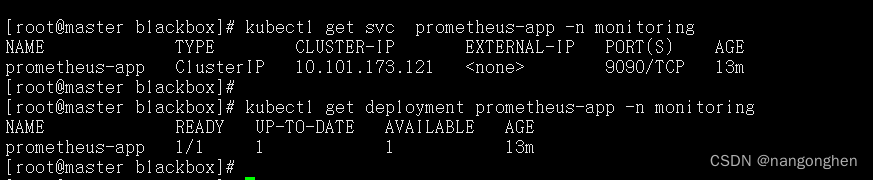
3 部署prometheus
apiVersion: v1
kind: Namespace
metadata:
  name: monitoring

---
apiVersion: v1
kind: ServiceAccount
metadata:
  name: prometheus-app
  namespace: monitoring

---
apiVersion: apps/v1
kind: Deployment
metadata:
  labels:
    app: prometheus-app
  name: prometheus-app
  namespace: monitoring
spec:
  replicas: 1
  selector:
    matchLabels:
      app: prometheus-app
  template:
    metadata:
      labels:
        app: prometheus-app
      name: prometheus-app
    spec:
      containers:
      - args:
        - --config.file=/etc/prometheus/prometheus.yml
        - --storage.tsdb.retention=7d
        - --web.enable-lifecycle
        - --log.level=debug
        image: prom/prometheus:v2.31.0
        imagePullPolicy: IfNotPresent
        name: prometheus
        ports:
        - containerPort: 9090
          name: web
          protocol: TCP
        volumeMounts:
        - mountPath: /etc/prometheus
          name: config-volume
        - mountPath: /etc/prometheus/etc.d
          name: blackbox-web-target
      dnsPolicy: ClusterFirst
      restartPolicy: Always
      serviceAccount: prometheus-app
      serviceAccountName: prometheus-app
      volumes:
      - configMap:
          name: prometheus-app
        name: config-volume
      - configMap:
          name: blackbox-web-target
        name: blackbox-web-target

---

apiVersion: v1
kind: Service
metadata:
  labels:
    app: prometheus-app
    name: prometheus-app
  name: prometheus-app
  namespace: monitoring
spec:
  ports:
  - name: http
    port: 9090
    protocol: TCP
    targetPort: 9090
  selector:
    app: prometheus-app
  sessionAffinity: None
  type: ClusterIP

---

apiVersion: rbac.authorization.k8s.io/v1
kind: ClusterRole
metadata:
  name: prometheus
rules:
- apiGroups:
  - ""
  resources:
  - nodes
  - nodes/proxy
  - services
  - endpoints
  - pods
  verbs:
  - get
  - list
  - watch
- apiGroups:
  - ""
  resources:
  - configmaps
  verbs:
  - get
- nonResourceURLs:
  - /metrics
  verbs:
  - get

---
apiVersion: rbac.authorization.k8s.io/v1
kind: ClusterRoleBinding
metadata:
  annotations:
  name: prometheus
roleRef:
  apiGroup: rbac.authorization.k8s.io
  kind: ClusterRole
  name: prometheus
subjects:
- kind: ServiceAccount
  name: prometheus-app
  namespace: monitoring

---
apiVersion: v1
data:
  prometheus.yml: |-
    global:
      scrape_interval: 15s
    scrape_configs:
    - job_name: blackbox
      metrics_path: /probe
      params:
        module: [http_get_2xx]            #  会变成http的参数:module=http_get_2xx
      file_sd_configs:
      - files:
        - '/etc/prometheus/etc.d/web.yml'           # 被监控的目标站点是写在此文件
        refresh_interval: 30s                         # 30秒热更新一次,不必重启prometheus
      relabel_configs:
      - source_labels: [__address__]
        target_label: __param_target            # 会变成http的参数:target=目标url
      - source_labels: [__param_target]
        target_label: instance
      - target_label: __address__
        replacement: blackbox-exporter.monitoring.svc.cluster.local:9115
kind: ConfigMap
metadata:
  name: prometheus-app
  namespace: monitoring

---
apiVersion: v1
kind: ConfigMap
metadata:
  name: blackbox-web-target
  namespace: monitoring
  labels:
    app: blackbox-exporter
data:
  web.yml: |-
    ---
    - targets:
      - https://www.baidu.com         # 被监控的站点
      labels:
        env: prod
        app: baidu-web
        project: baidu
        desc: desc for baidu web
    - targets:
      - https://blog.csdn.net           # 被监控的站点
      labels:
        env: prod
        app: csdn-web
        project: csdn
        desc: desc for csdn
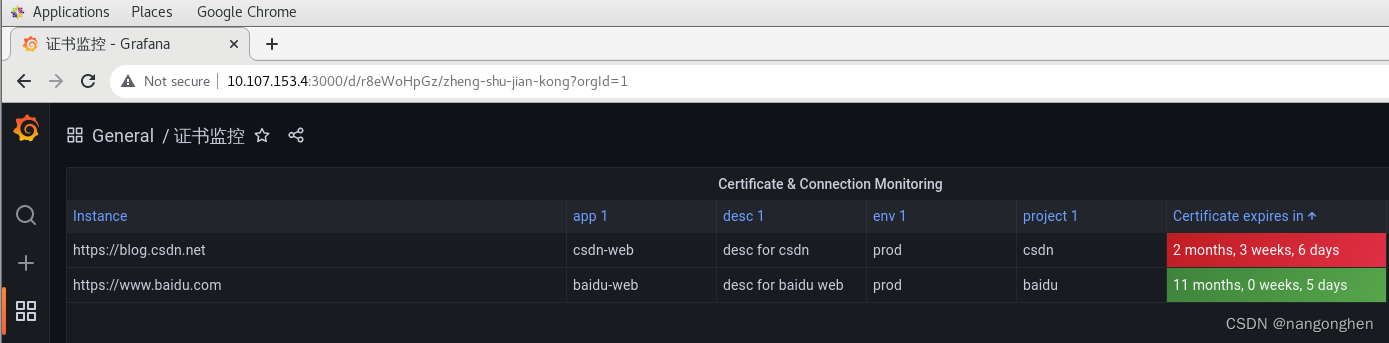
4 promethues界面效果
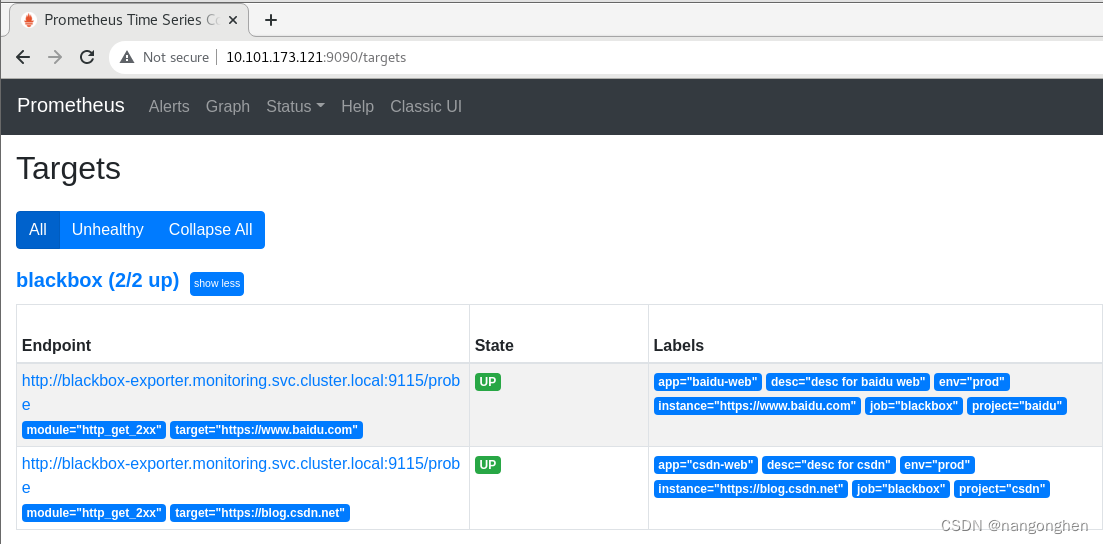
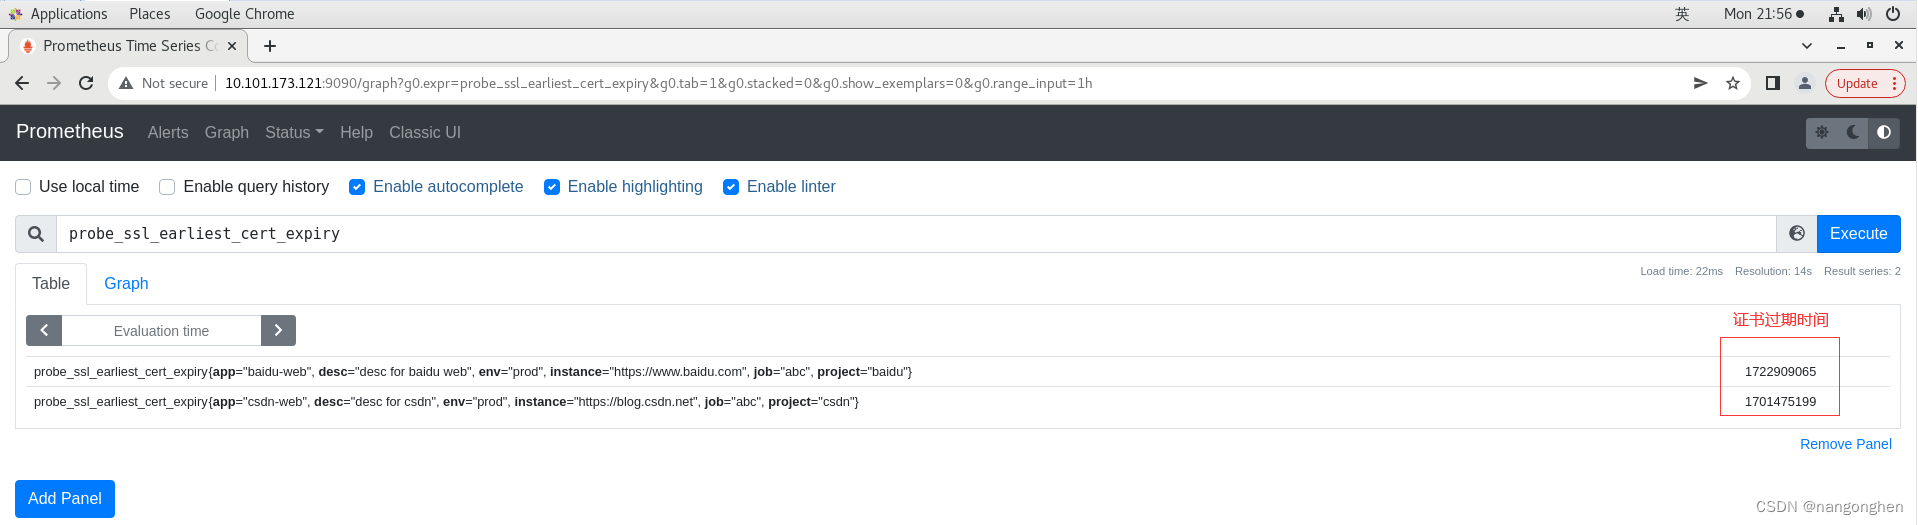
指标probe_ssl_earliest_cert_expiry表示证书的过期时间的时间戳,那么以下公式表示多少秒后证书过期:
probe_ssl_earliest_cert_expiry - time()
5 grafana
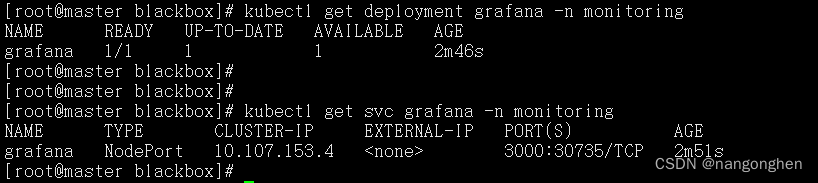
5.1 部署
apiVersion: apps/v1
kind: Deployment
metadata:
  name: grafana
  namespace: monitoring
  labels:
    app: grafana
spec:
  replicas: 1
  selector:
    matchLabels:
      app: grafana
  template:
    metadata:
      labels:
        app: grafana
    spec:
      containers:
        - name: grafana
          image: grafana/grafana
          resources:
            limits:
              memory: "128Mi"
              cpu: "50m"
          readinessProbe:
            httpGet:
              path: /api/health
              port: 3000
            initialDelaySeconds: 15
            periodSeconds: 10
          livenessProbe:
            tcpSocket:
              port: 3000
            initialDelaySeconds: 15
            periodSeconds: 10
          ports:
            - containerPort: 3000
---
apiVersion: v1
kind: Service
metadata:
  name: grafana
  namespace: monitoring
spec:
  selector:
    app: grafana
  type: NodePort
  ports:
  - protocol: TCP
    port: 3000
5.2 配置数据源
添加prometheus数据源,prometheus实例在kubernetes中的service名称为prometheus-app,因此使用http://prometheus-app:9090作为地址即可。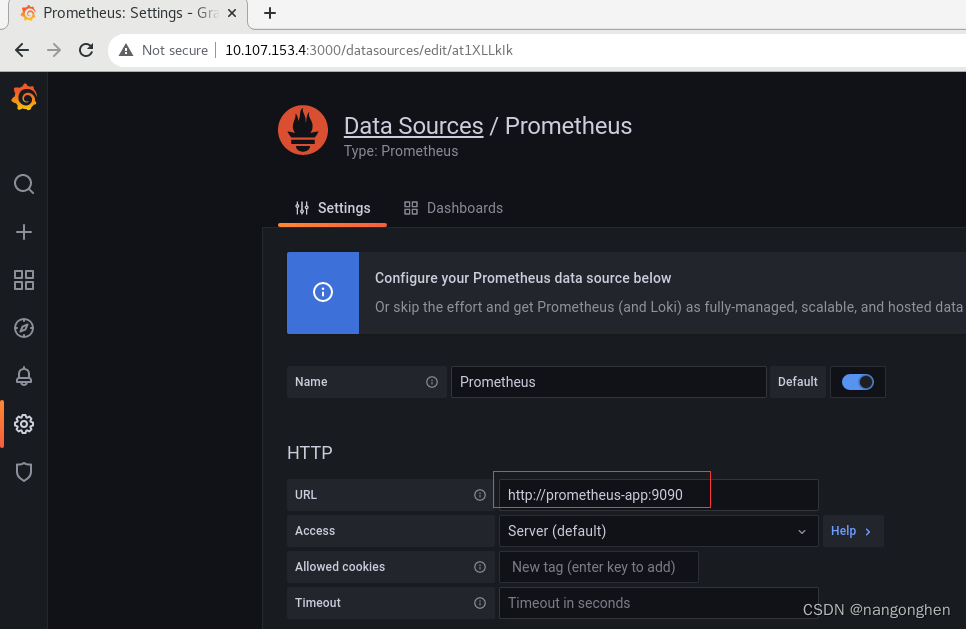
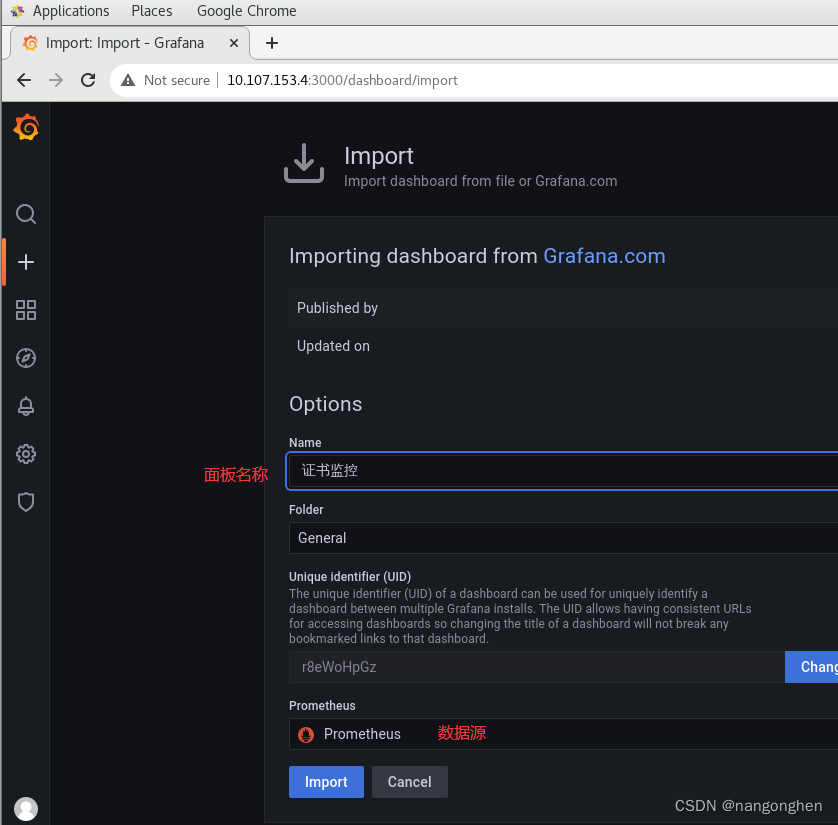
5.3 导入模板
使用编号为13230的grafana模板。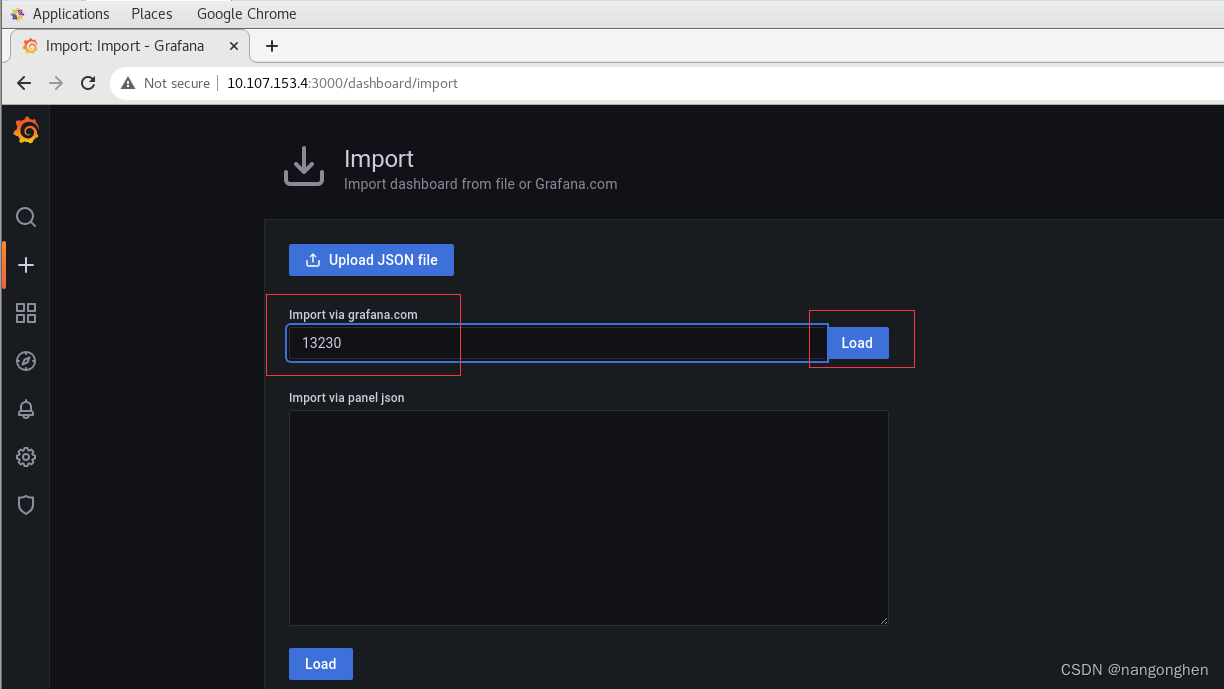
6 小结
prometheus和blackbox-exporter一起协同监控web站点,blackbox-exporter作为一个中间层解耦prometheus和目标web站点,blackbox-exporter是真正去获取目标web站点证书并暴露metrics的服务,prometheus只需要抓取blackbox-exporter暴露的指标即可。
标签:
prometheus
本文转载自: https://blog.csdn.net/nangonghen/article/details/132678058
版权归原作者 nangonghen 所有, 如有侵权,请联系我们删除。
版权归原作者 nangonghen 所有, 如有侵权,请联系我们删除。