
1、引言
在现代Web应用开发中,数据可视化已成为不可或缺的一部分。ECharts,作为一款强大的图表库,提供了丰富的图表类型和高度定制化的选项,深受开发者喜爱。然而,在Vue项目中直接使用ECharts可能会遇到状态管理、响应式更新和组件化封装的挑战。本文将介绍如何在Vue3中封装一个高效、可复用的ECharts组件——
TChart
。
2、组件亮点
- 响应式图表:自动调整大小以适应容器。
- 空数据展示:支持自定义空数据状态显示。
- 事件监听:自动绑定和解绑图表事件。
- 主题切换:动态改变图表主题。
- 性能优化:通过防抖函数减少不必要的渲染和资源消耗。
3、技术栈
- Vue 3: 使用Composition API进行状态管理和逻辑组织。
- ECharts: 数据可视化核心库。
- VueUse: 提供
useResizeObserver等实用工具函数。
4、组件结构
TChart
组件的核心在于其模板和脚本部分:
- 模板:包含图表容器和空数据状态展示插槽。
- 脚本:
- 初始化图表并设置选项。- 监听窗口和图表容器尺寸变化,实现响应式布局。- 自动绑定和解绑图表事件。- 支持动态主题切换和选项更新。
5、实现步骤
5.1 安装echarts
npm install echarts
5.2 注册echarts
并在 main 文件中注册使用
import * as echarts from "echarts" // 引入echarts
app.config.globalProperties.$echarts = echarts // 全局使用
5.3 新建TChart组件
~components/TCharts.vue
<template>
  <div class="t-chart" v-bind="$attrs">
    <div
      v-show="!formatEmpty"
      class="t-chart-container"
      :id="id"
      ref="echartRef"
    />
    <slot v-if="formatEmpty" name="empty">
      <el-empty v-bind="$attrs" :description="description" />
    </slot>
    <slot></slot>
  </div>
</template>

<script setup lang="ts" name="TChart">
import {
  onMounted,
  getCurrentInstance,
  ref,
  watch,
  nextTick,
  onBeforeUnmount,
  markRaw,
  useAttrs,
} from 'vue'
import { useResizeObserver } from '@vueuse/core'
import { debounce, toLine } from '../../utils'
import { computed } from 'vue'
const { proxy } = getCurrentInstance() as any
const props = defineProps({
  options: {
    type: Object,
    default: () => ({}),
  },
  id: {
    type: String,
    default: () => Math.random().toString(36).substring(2, 8),
  },
  theme: {
    type: String,
    default: '',
  },
  isEmpty: {
    type: [Boolean, Function],
    default: false,
  },
  description: {
    type: String,
    default: '暂无数据',
  },
})

const echartRef = ref<HTMLDivElement>()
const chart = ref()
const emits = defineEmits()
const events = Object.entries(useAttrs())

// 图表初始化
const renderChart = () => {
  chart.value = markRaw(proxy.$echarts.init(echartRef.value, props.theme))
  setOption(props.options)
  // 返回chart实例
  emits('chart', chart.value)

  // 监听图表事件
  events.forEach(([key, value]) => {
    if (key.startsWith('on') && !key.startsWith('onChart')) {
      const on = toLine(key).substring(3)
      chart.value.on(on, (...args) => emits(on, ...args))
    }
  })

  // 监听元素变化
  useResizeObserver(echartRef.value, resizeChart)
  // 如果不想用vueuse,可以使用下边的方法代替,但组件使用v-show时,不会触发resize事件
  // window.addEventListener('resize', resizeChart)
}

// 重绘图表函数
const resizeChart = debounce(
  () => {
    chart.value?.resize()
  },
  300,
  true
)

// 设置图表函数
const setOption = debounce(
  async (data) => {
    if (!chart.value) return
    chart.value.setOption(data, true, true)
    await nextTick()
    resizeChart()
  },
  300,
  true
)

const formatEmpty = computed(() => {
  if (typeof props.isEmpty === 'function') {
    return props.isEmpty(props.options)
  }
  return props.isEmpty
})

watch(
  () => props.options,
  async (nw) => {
    await nextTick()
    setOption(nw)
  },
  { deep: true }
)

watch(
  () => props.theme,
  async () => {
    chart.value.dispose()
    renderChart()
  }
)

onMounted(() => {
  renderChart()
})
onBeforeUnmount(() => {
  // 取消监听
  // window.removeEventListener('resize', resizeChart)
  // 销毁echarts实例
  chart.value.dispose()
  chart.value = null
})
</script>

<style lang="scss" scoped>
.t-chart {
  position: relative;
  width: 100%;
  height: 100%;
  &-container {
    width: 100%;
    height: 100%;
  }
}
</style>
utils/index.ts
type Func = (...args: any[]) => any
/**
 * 防抖函数
 * @param { Function } func 函数
 * @param { Number } delay 防抖时间
 * @param { Boolean } immediate 是否立即执行
 * @param { Function } resultCallback
 */
export function debounce(
  func: Func,
  delay: number = 500,
  immediate?: boolean,
  resultCallback?: Func
) {
  let timer: null | ReturnType<typeof setTimeout> = null
  let isInvoke = false
  const _debounce = function (this: unknown, ...args: any[]) {
    return new Promise((resolve, reject) => {
      if (timer) clearTimeout(timer)
      if (immediate && !isInvoke) {
        try {
          const result = func.apply(this, args)
          if (resultCallback) resultCallback(result)
          resolve(result)
        } catch (e) {
          reject(e)
        }
        isInvoke = true
      } else {
        timer = setTimeout(() => {
          try {
            const result = func.apply(this, args)
            if (resultCallback) resultCallback(result)
            resolve(result)
          } catch (e) {
            reject(e)
          }
          isInvoke = false
          timer = null
        }, delay)
      }
    })
  }
  _debounce.cancel = function () {
    if (timer) clearTimeout(timer)
    isInvoke = false
    timer = null
  }
  return _debounce
}

/**
 * 节流函数
 * @param { Function } func
 * @param { Boolean } interval
 * @param { Object } options
 * leading:初始 trailing:结尾
 */
export function throttle(
  func: Func,
  interval: number,
  options = { leading: false, trailing: true }
) {
  let timer: null | ReturnType<typeof setTimeout> = null
  let lastTime = 0
  const { leading, trailing } = options
  const _throttle = function (this: unknown, ...args: any[]) {
    const nowTime = Date.now()
    if (!lastTime && !leading) lastTime = nowTime
    const remainTime = interval - (nowTime - lastTime)
    if (remainTime <= 0) {
      if (timer) {
        clearTimeout(timer)
        timer = null
      }
      lastTime = nowTime
      func.apply(this, args)
    }
    if (trailing && !timer) {
      timer = setTimeout(() => {
        lastTime = !leading ? 0 : Date.now()
        timer = null
        func.apply(this, args)
      }, remainTime)
    }
  }
  _throttle.cancel = function () {
    if (timer) clearTimeout(timer)
    timer = null
    lastTime = 0
  }
  return _throttle
}

/**
 * 驼峰转换下划线
 * @param { String } name
 */
export function toLine(name: string) {
  return name.replace(/([A-Z])/g, '_$1').toLowerCase()
}
6、使用组件
7.1使用示例
<template>
  <div>
    <el-button @click="isShow = !isShow">{{
      isShow ? '隐藏' : '显示'
    }}</el-button>
    <el-button @click="addData()">增加数据</el-button>
    <t-chart
      v-show="isShow"
      :options="options"
      style="width: 100%; height: 500px"
      @click="click"
      @dblclick="addData()"
      @mousedown="mousedown"
      @mousemove="mousemove"
      @mouseover="mouseover"
      @mouseout="mouseout"
      @globalout="globalout"
      @contextmenu="contextmenu"
      @chart="chart"
    />
  </div>
</template>
<script setup lang="ts">
import TChart from '../components/TChart'
import { ref } from 'vue'
const options = ref({
  xAxis: {
    type: 'category',
    data: ['Mon', 'Tue', 'Wed', 'Thu', 'Fri', 'Sat', 'Sun'],
  },
  yAxis: {
    type: 'value',
  },
  series: [
    {
      data: [150, 230, 224, 218, 135, 147, 260],
      type: 'line',
    },
  ],
})

const isShow = ref(true)
const addData = () => {
  options.value.xAxis.data.push(
    'test' + Math.random().toString(36).substring(2, 8)
  )
  options.value.series[0].data.push(Math.random() * 200)
}
const click = (e) => {
  console.log('click-----', e)
}
const mousedown = (e) => {
  console.log('mousedown-----', e)
}
const mousemove = (e) => {
  console.log('mousemove-----', e)
}
const mouseover = (e) => {
  console.log('mouseover-----', e)
}
const mouseout = (e) => {
  console.log('mouseout-----', e)
}
const globalout = (e) => {
  console.log('globalout-----', e)
}
const contextmenu = (e) => {
  console.log('contextmenu-----', e)
}

const chartRef = ref(null)
const chart = (dom) => {
  chartRef.value = dom
}
</script>
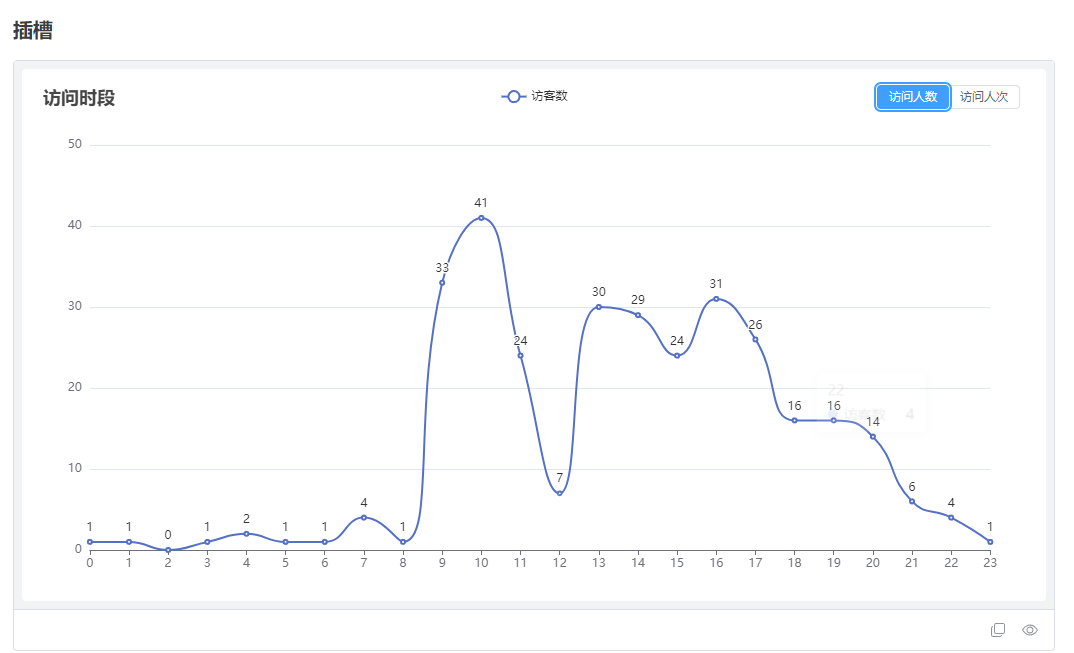
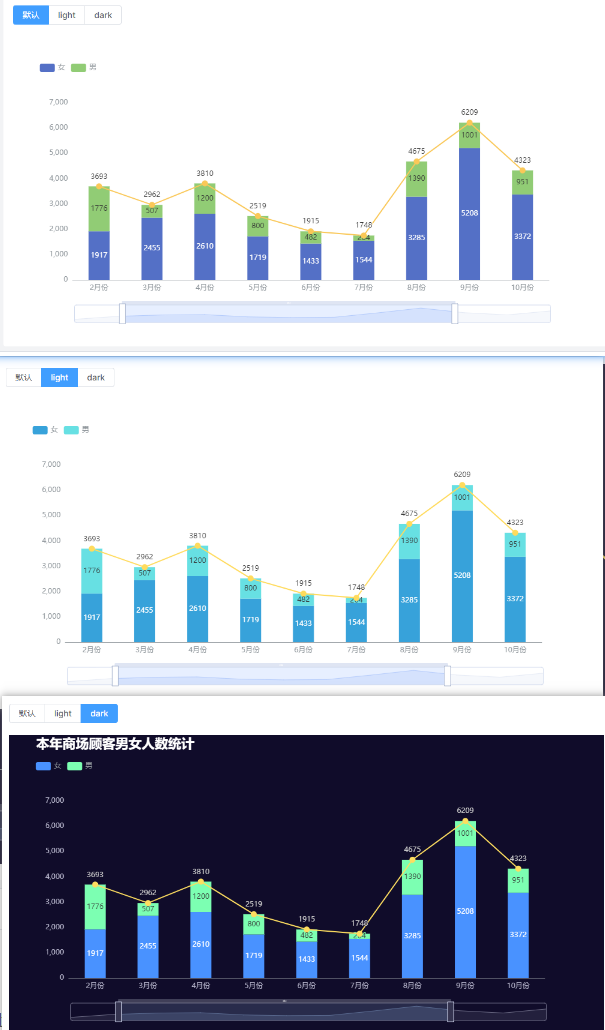
7.2效果图
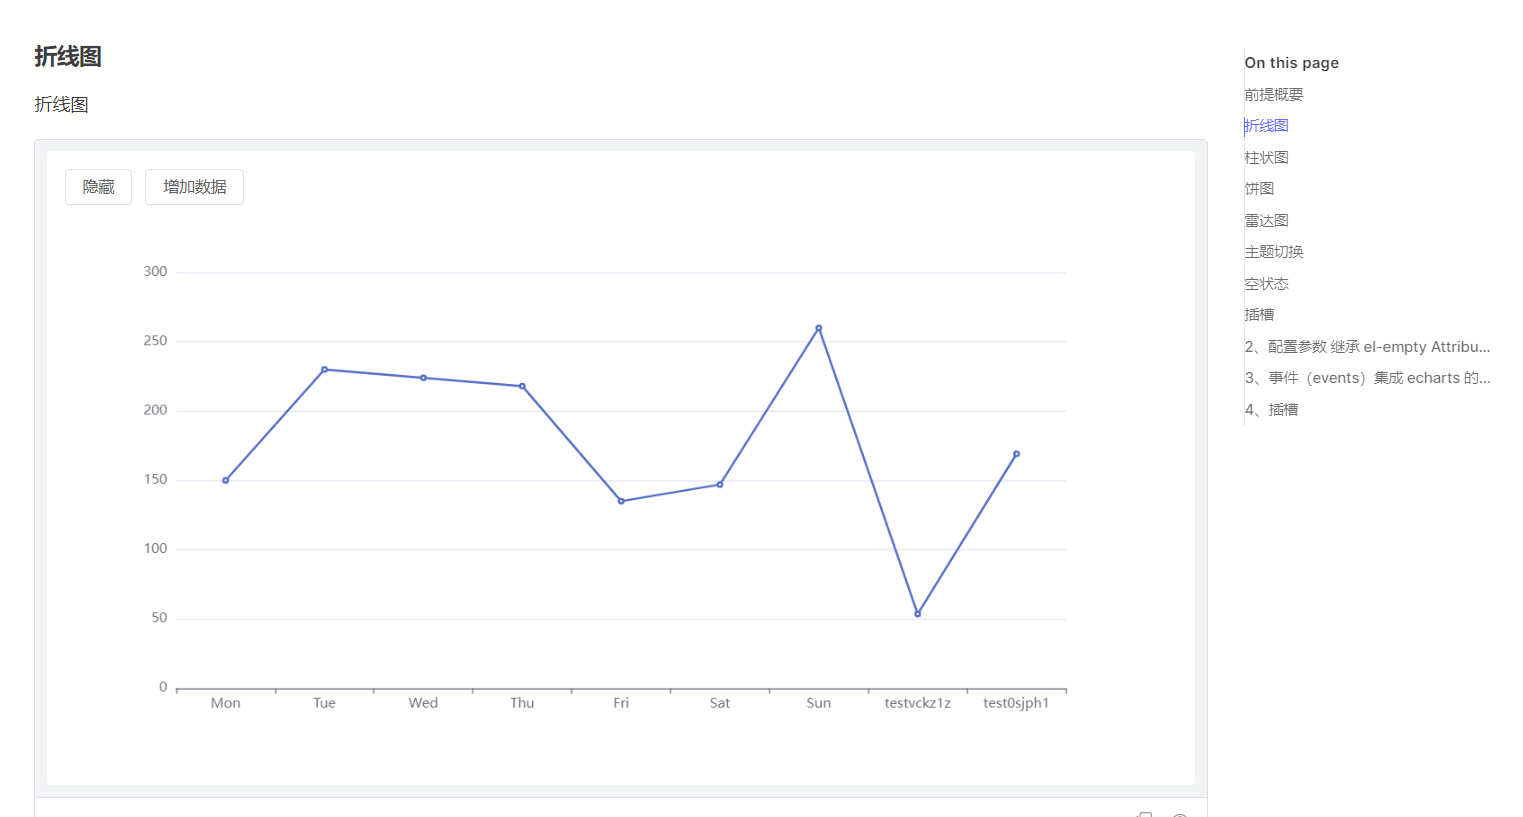

更多使用示例,可以看看文档 TChart 图表
深入浅出---封装思路
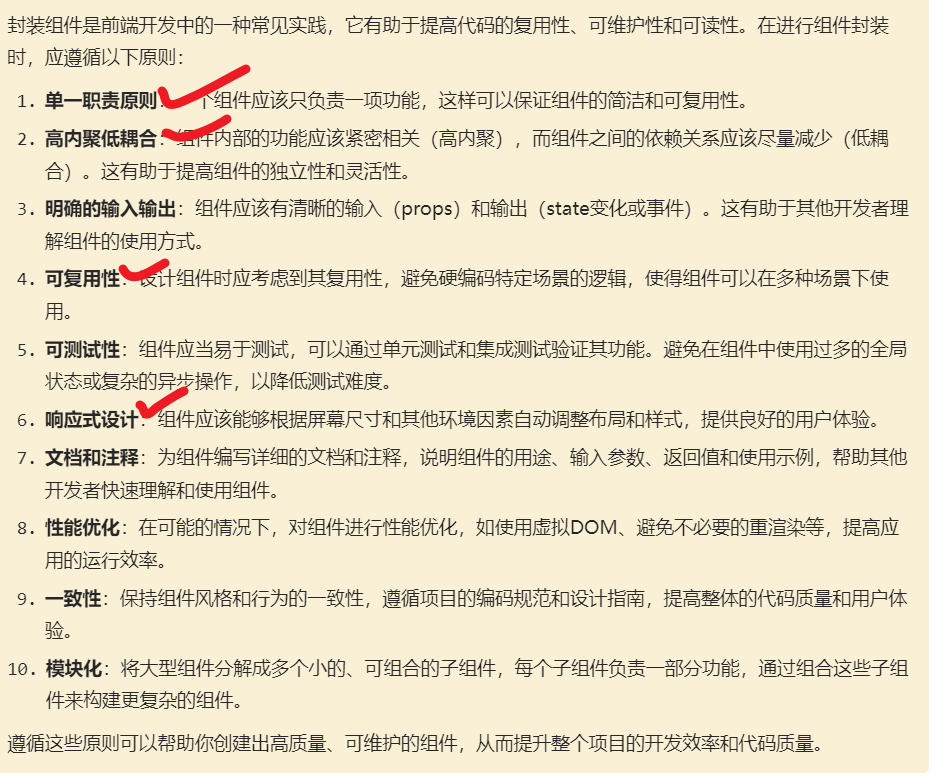
接下来,我想和大家聊一下封装思路。首先,封装一个组件,我需要考虑什么,从哪方面考虑,让我们看看ai的回答
封装组件是前端开发中的一种常见实践,它有助于提高代码的复用性、可维护性和可读性。在进行组件封装时,应遵循以下原则:
- 单一职责原则:一个组件应该只负责一项功能,这样可以保证组件的简洁和可复用性。
- 高内聚低耦合:组件内部的功能应该紧密相关(高内聚),而组件之间的依赖关系应该尽量减少(低耦合)。这有助于提高组件的独立性和灵活性。
- 明确的输入输出:组件应该有清晰的输入(props)和输出(state变化或事件)。这有助于其他开发者理解组件的使用方式。
- 可复用性:设计组件时应考虑到其复用性,避免硬编码特定场景的逻辑,使得组件可以在多种场景下使用。
- 可测试性:组件应当易于测试,可以通过单元测试和集成测试验证其功能。避免在组件中使用过多的全局状态或复杂的异步操作,以降低测试难度。
- 响应式设计:组件应该能够根据屏幕尺寸和其他环境因素自动调整布局和样式,提供良好的用户体验。
- 文档和注释:为组件编写详细的文档和注释,说明组件的用途、输入参数、返回值和使用示例,帮助其他开发者快速理解和使用组件。
- 性能优化:在可能的情况下,对组件进行性能优化,如使用虚拟DOM、避免不必要的重渲染等,提高应用的运行效率。
- 一致性:保持组件风格和行为的一致性,遵循项目的编码规范和设计指南,提高整体的代码质量和用户体验。
- 模块化:将大型组件分解成多个小的、可组合的子组件,每个子组件负责一部分功能,通过组合这些子组件来构建更复杂的组件。
遵循这些原则可以帮助你创建出高质量、可维护的组件,从而提升整个项目的开发效率和代码质量。
基于上边的原则,我们再考虑下封装echarts的实现。
接下来,我们来看一下官方的示例
<!DOCTYPE html>
<html>
  <head>
    <meta charset="utf-8" />
    <title>ECharts</title>
    <!-- 引入刚刚下载的 ECharts 文件 -->
    <script src="echarts.js"></script>
  </head>
  <body>
    <!-- 为 ECharts 准备一个定义了宽高的 DOM -->
    <div id="main" style="width: 600px;height:400px;"></div>
    <script type="text/javascript">
      // 基于准备好的dom,初始化echarts实例
      var myChart = echarts.init(document.getElementById('main'));

      // 指定图表的配置项和数据
      var option = {
        title: {
          text: 'ECharts 入门示例'
        },
        tooltip: {},
        legend: {
          data: ['销量']
        },
        xAxis: {
          data: ['衬衫', '羊毛衫', '雪纺衫', '裤子', '高跟鞋', '袜子']
        },
        yAxis: {},
        series: [
          {
            name: '销量',
            type: 'bar',
            data: [5, 20, 36, 10, 10, 20]
          }
        ]
      };

      // 使用刚指定的配置项和数据显示图表。
      myChart.setOption(option);
    </script>
  </body>
</html>
实现的步骤的步骤有哪些?
- 引入echarts
- 定义一个DOM元素(容器)
- 获取DOM元素(容器)并初始化echarts实例
- 指定图表的配置项和数据
- 使用刚指定的配置项和数据显示图表。
每当我想使用echarts组件时,都得经过这五个步骤。当我想实现多个图表时,这多个图表对比起来,哪些是步骤是变化的?哪些的不变的?
细心的网友会发现,其中,变化最多的,是第四个步骤“图表的配置项和数据”。那我,是不是可以将这些重复性的操作,封装到组件里,让组件替我去完成。
接下来,让我们来一步一步实现代码
1.基本功能
1.1准备DOM元素(容器)
<template>
  <div class="t-chart" v-bind="$attrs">
    <div v-show="!formatEmpty" class="t-chart" :id="id" ref="echartRef" />
</template>

<style lang="scss" scoped>
.t-chart {
  width: 100%;
  height: 100%;
}
</style>
2.2 获取容器并初始化echarts实例
优化小技巧:通过ref获取dom实例比document操作获取dom,性能更好
<template>
  <div class="t-chart" v-bind="$attrs">
    <div v-show="!formatEmpty" class="t-chart" :id="id" ref="echartRef" />
</template>
<script setup lang="ts" name="TChart">
import { onMounted, getCurrentInstance, ref, markRaw } from "vue"

const { proxy } = getCurrentInstance() as any
const props = defineProps({
  options: {
    type: Object,
    default: () => ({})
  },
  id: {
    type: String,
    default: () => Math.random().toString(36).substring(2, 8)
  }
})

const echartRef = ref<HTMLDivElement>()
const chart = ref()

// 图表初始化
const renderChart = () => {
  chart.value = markRaw(proxy.$echarts.init(echartRef.value))
}

onMounted(() => {
  renderChart()
})
</script>
<style lang="scss" scoped>
.t-chart {
  width: 100%;
  height: 100%;
}
</style>
1.3 设置配置项和数据
<template>
  <div class="t-chart" v-bind="$attrs">
    <div v-show="!formatEmpty" class="t-chart" :id="id" ref="echartRef" />
</template>
<script setup lang="ts" name="TChart">
import { onMounted, getCurrentInstance, ref, markRaw } from "vue"

const { proxy } = getCurrentInstance() as any
const props = defineProps({
  options: {
    type: Object,
    default: () => ({})
  },
  id: {
    type: String,
    default: () => Math.random().toString(36).substring(2, 8)
  }
})

const echartRef = ref<HTMLDivElement>()
const chart = ref()

// 图表初始化
const renderChart = () => {
  chart.value = markRaw(proxy.$echarts.init(echartRef.value))
  setOption(props.options)
}

// 设置图表函数
const setOption = data => {
  chart.value.setOption(data, true, true)
  chart.value?.resize()
}

onMounted(() => {
  renderChart()
})
</script>
<style lang="scss" scoped>
.t-chart {
  width: 100%;
  height: 100%;
}
</style>
2.组件要实现的功能
很多时候,封装封装组件,并不是一次性就能做到很完美的状态,而是在使用中, 不断去优化,取改进的。比如,在使用中,数据更新、页面大小变化时,图表没有重新渲染、echart事件没有触发。这些都是一点点去优化改进的。记住一个准则:“先实现再优化”
- 响应式图表
- 图表尺寸的自适应
- 事件监听
- 性能优化
- 空数据展示
- 插槽
- 主题切换
- 获取echarts实例
3.响应式图表
希望数据变化时,可以重新绘制图表
// 重绘图表函数
const resizeChart = debounce(
  () => {
    chart.value?.resize()
  },
  300,
  true
)

// 设置图表函数
const setOption = debounce(
  async data => {
    if (!chart.value) return
    chart.value.setOption(data, true, true)
    await nextTick()
    resizeChart()
  },
  300,
  true
)

const formatEmpty = computed(() => {
  if (typeof props.isEmpty === "function") {
    return props.isEmpty(props.options)
  }
  return props.isEmpty
})
// 监听数据变化时,重绘
watch(
  () => props.options,
  async nw => {
    await nextTick()
    setOption(nw)
  },
  { deep: true }
)
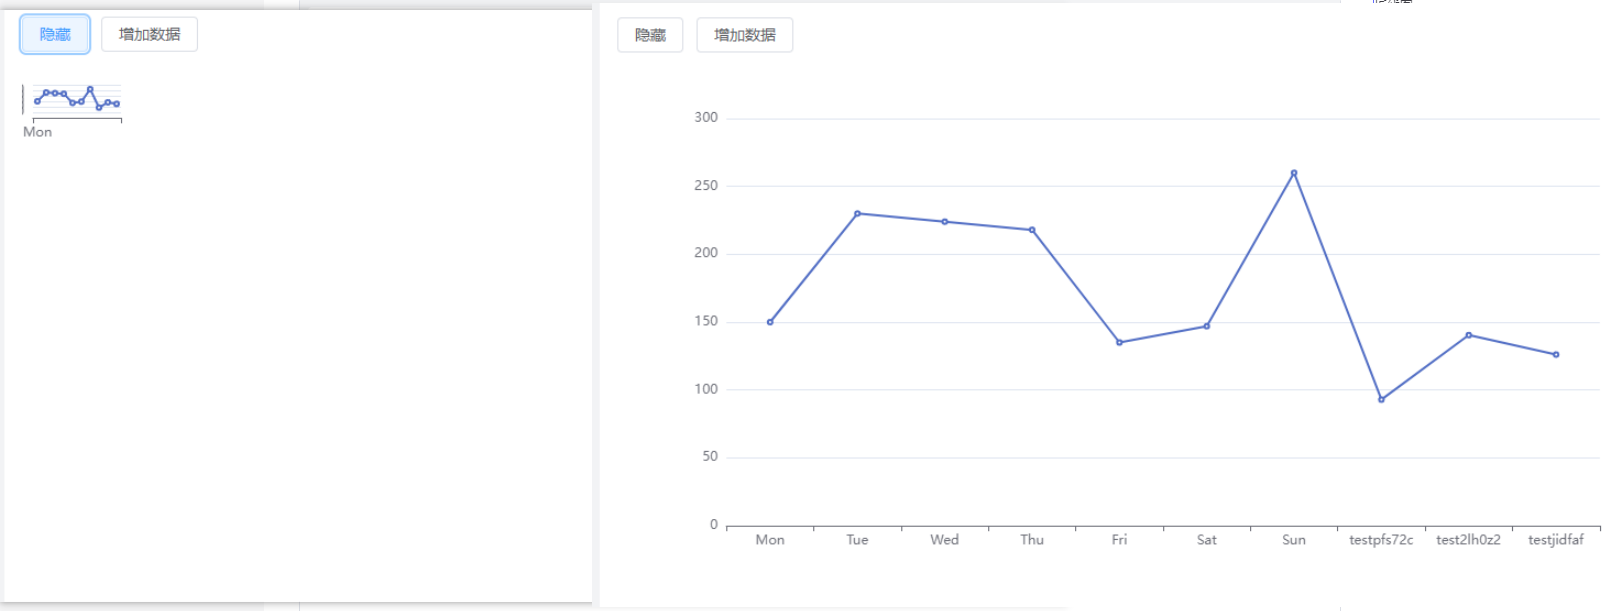
4.图表尺寸的自适应
希望容器尺寸变化时,图表能够自适应
笔者这边使用了vueuse的useResizeObserver,来实现对元素变化的监听,为什么没用resize? 是因为其中有坑。
1、window大小变化时,才会触发监听
2、使用组件使用v-show的时候,不会触发,可能会蜷缩在一团
import { useResizeObserver } from "@vueuse/core"

const renderChart = () => {
  chart.value = markRaw(proxy.$echarts.init(echartRef.value, props.theme))
  setOption(props.options)
  // 监听元素变化
  useResizeObserver(echartRef.value, resizeChart)
  // 大小自适应
  // window.addEventListener('resize', resizeChart)
}

onBeforeUnmount(() => {
  // 取消监听
  // window.removeEventListener('resize', resizeChart)
})
5.事件监听
通过useAttrs,拿到父组件传过来的事件,并批量注册emits事件
const events = Object.entries(useAttrs())

  // 监听图表事件
  events.forEach(([key, value]) => {
    if (key.startsWith('on') && !key.startsWith('onChart')) {
      const on = toLine(key).substring(3)
      chart.value.on(on, (...args) => emits(on, ...args))
    }
  })
6.性能优化
- 通过markRaw,将echarts实例标记为普通对象,减少响应式带来的损耗。
- 防抖函数,用于图表重绘和选项更新,减少不必要的调用,提高性能。
- 当组件被销毁时,调用 dispose 方法销毁实例,防止可能的内存泄漏。
chart.value = markRaw(proxy.$echarts.init(echartRef.value, props.theme))

  // 重绘图表函数
const resizeChart = debounce(
  () => {
    chart.value?.resize()
  },
  300,
  true
)

// 设置图表函数
const setOption = debounce(
  async data => {
    if (!chart.value) return
    chart.value.setOption(data, true, true)
    await nextTick()
    resizeChart()
  },
  300,
  true
)

onBeforeUnmount(() => {
  // 销毁echarts实例
  chart.value.dispose()
  chart.value = null
})
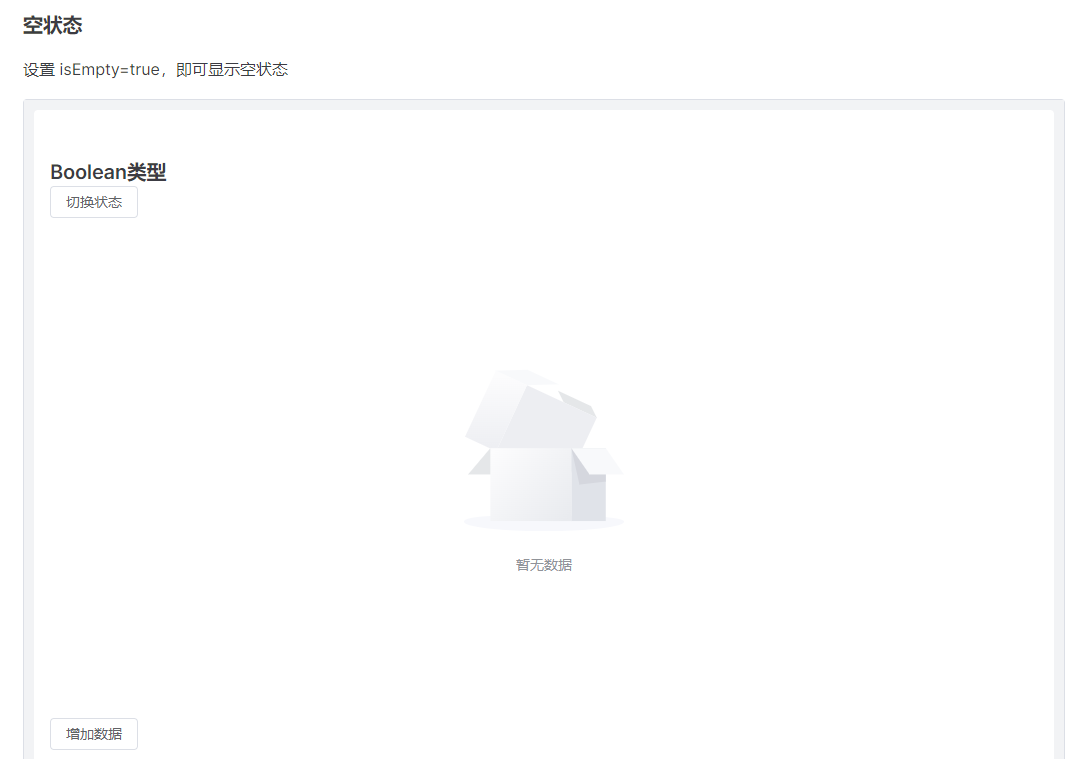
6.空数据展示
组件可以通过isEmpty,来设置echarts图表空状态,类型可以是Boolean,也可以是个函数,方便灵活调用,还可以设置description,空数据时的展示文字
<template>
  <div class="t-chart" v-bind="$attrs">
    <div
      v-show="!formatEmpty"
      class="t-chart-container"
      :id="id"
      ref="echartRef"
    />
    <slot v-if="formatEmpty" name="empty">
      <el-empty v-bind="$attrs" :description="description" />
    </slot>
    <slot></slot>
  </div>
</template>
<script setup lang="ts" name="TChart">
const props = defineProps({
  isEmpty: {
    type: [Boolean, Function],
    default: false,
  },
  description: {
    type: String,
    default: '暂无数据',
  },
})

const formatEmpty = computed(() => {
  if (typeof props.isEmpty === 'function') {
    return props.isEmpty(props.options)
  }
  return props.isEmpty
})

...
</script>
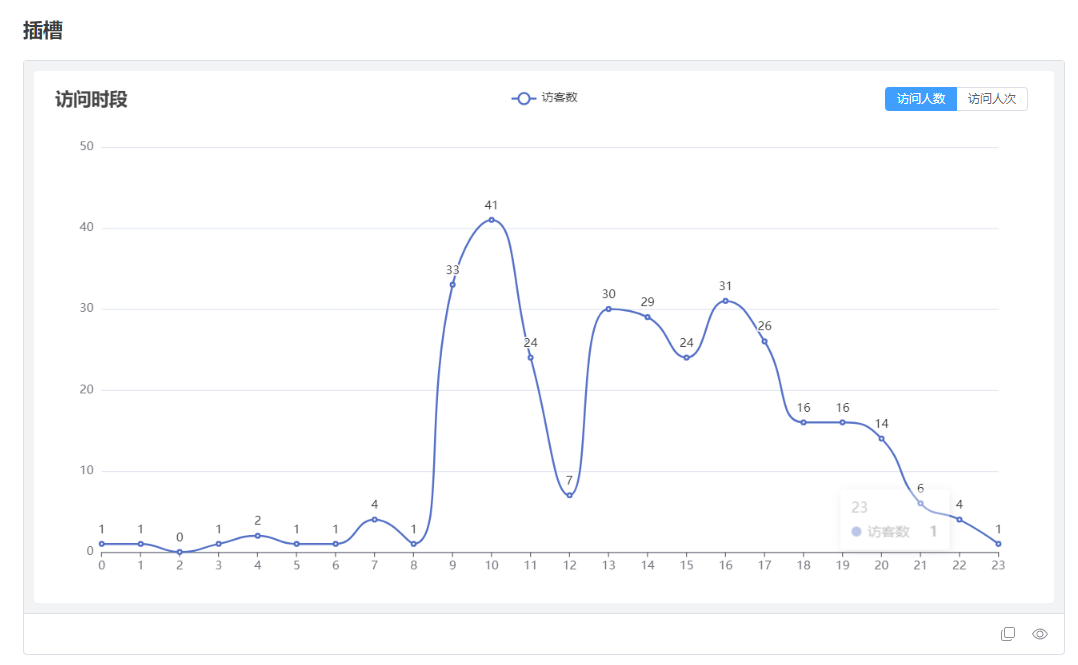
7.插槽
可以通过插槽,在组件内增加内容,也可以替换空状态的内容
<template>
  <div class="t-chart" v-bind="$attrs">
    <div
      v-show="!formatEmpty"
      class="t-chart-container"
      :id="id"
      ref="echartRef"
    />
    <slot v-if="formatEmpty" name="empty">
      <el-empty v-bind="$attrs" :description="description" />
    </slot>
    <slot></slot>
  </div>
</template>

<style lang="scss" scoped>
.t-chart {
  position: relative;
  width: 100%;
  height: 100%;
  &-container {
    width: 100%;
    height: 100%;
  }
}
</style>
8.主题切换
监听props的主题,动态切换echarts 主题
const props = defineProps({
  theme: {
    type: String,
    default: '',
  }
})

// 图表初始化
const renderChart = () => {
  chart.value = markRaw(proxy.$echarts.init(echartRef.value, props.theme))
  // ...
}

watch(
  () => props.theme,
  async () => {
    chart.value.dispose()
    renderChart()
  }
)
9.获取echarts实例
注册了echarts实例后,将实例返回给父组件
  chart.value = markRaw(proxy.$echarts.init(echartRef.value, props.theme))

  // 返回chart实例
  emits('chart', chart.value)
完整代码
具体的,可以回看5.3 新建TChart组件
<template>
  <div class="t-chart" v-bind="$attrs">
    <div
      v-show="!formatEmpty"
      class="t-chart-container"
      :id="id"
      ref="echartRef"
    />
    <slot v-if="formatEmpty" name="empty">
      <el-empty v-bind="$attrs" :description="description" />
    </slot>
    <slot></slot>
  </div>
</template>

<script setup lang="ts" name="TChart">
import {
  onMounted,
  getCurrentInstance,
  ref,
  watch,
  nextTick,
  onBeforeUnmount,
  markRaw,
  useAttrs,
} from 'vue'
import { useResizeObserver } from '@vueuse/core'
import { debounce, toLine } from '../../utils'
import { computed } from 'vue'
const { proxy } = getCurrentInstance() as any
const props = defineProps({
  options: {
    type: Object,
    default: () => ({}),
  },
  id: {
    type: String,
    default: () => Math.random().toString(36).substring(2, 8),
  },
  theme: {
    type: String,
    default: '',
  },
  isEmpty: {
    type: [Boolean, Function],
    default: false,
  },
  description: {
    type: String,
    default: '暂无数据',
  },
})

const echartRef = ref<HTMLDivElement>()
const chart = ref()
const emits = defineEmits()
const events = Object.entries(useAttrs())

// 图表初始化
const renderChart = () => {
  chart.value = markRaw(proxy.$echarts.init(echartRef.value, props.theme))
  setOption(props.options)
  // 返回chart实例
  emits('chart', chart.value)

  // 监听图表事件
  events.forEach(([key, value]) => {
    if (key.startsWith('on') && !key.startsWith('onChart')) {
      const on = toLine(key).substring(3)
      chart.value.on(on, (...args) => emits(on, ...args))
    }
  })

  // 监听元素变化
  useResizeObserver(echartRef.value, resizeChart)
  // 大小自适应
  // window.addEventListener('resize', resizeChart)
}

// 重绘图表函数
const resizeChart = debounce(
  () => {
    chart.value?.resize()
  },
  300,
  true
)

// 设置图表函数
const setOption = debounce(
  async (data) => {
    if (!chart.value) return
    chart.value.setOption(data, true, true)
    await nextTick()
    resizeChart()
  },
  300,
  true
)

const formatEmpty = computed(() => {
  if (typeof props.isEmpty === 'function') {
    return props.isEmpty(props.options)
  }
  return props.isEmpty
})

watch(
  () => props.options,
  async (nw) => {
    await nextTick()
    setOption(nw)
  },
  { deep: true }
)

watch(
  () => props.theme,
  async () => {
    chart.value.dispose()
    renderChart()
  }
)

onMounted(() => {
  renderChart()
})
onBeforeUnmount(() => {
  // 取消监听
  // window.removeEventListener('resize', resizeChart)
  // 销毁echarts实例
  chart.value.dispose()
  chart.value = null
})
</script>

<style lang="scss" scoped>
.t-chart {
  position: relative;
  width: 100%;
  height: 100%;
  &-container {
    width: 100%;
    height: 100%;
  }
}
</style>
最后看看是否符合组件的设计原则
以上,就是我实现echarts组件的思路。希望对您有帮助
版权归原作者 Ja_dream 所有, 如有侵权,请联系我们删除。