
若该文为原创文章,转载请注明原文出处
本文章博客地址:https://hpzwl.blog.csdn.net/article/details/124567140
红胖子(红模仿)的博文大全:开发技术集合(包含Qt实用技术、树莓派、三维、OpenCV、OpenGL、ffmpeg、OSG、单片机、软硬结合等等)持续更新中…(点击传送门)
上一篇:《QCustomPlot开发笔记(一):QCustomPlot简介、下载以及基础绘图》
下一篇:敬请期待…
前言
上一篇讲解了,基础绘图,本片继续描述用户交互、元素项以及Qt中的一些特殊用法。
QCustomPlot用户交互
QCustomPlot 提供多种内置的用户交互。它们大致可以分为:
- 通过鼠标拖动和滚动鼠标滚轮进行范围操作
- 通过单击选择绘图实体
- 用户点击绘图实体时发出的信号
范围操作
拽托
用户操作轴范围的默认方法是在相应的QCPAxisRect上执行拖动操作。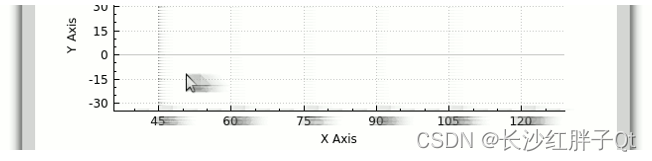
要在QCustomPlot小部件中启用范围拖动,需要将标志QCP::iRangeDrag添加到当前允许的交互中。这可以通过customPlot->setInteraction(QCP::iRangeDrag, true)完成。要仅允许在一个方向上拖动,使用QCPAxisRect::setRangeDrag并指定Qt::Vertical或Qt::Horizontal。默认为两个方向都允许Qt::Vertical | Qt::Horizontal。
在拖动操作过程中,通过QCPAxisRect::setRangeDragAxes配置的轴会实时更新其范围,从而自动调用replots。这会给用户一种用鼠标抓取绘图坐标平面的印象。最初,范围拖动轴配置为矩形的底部和左侧轴。
在拖动操作期间,通过实时更新其范围配置的轴,自动导致重新绘制。这给用户一种通过用鼠标抓住绘图坐标平面来移动它的印象。最初,范围拖动轴被配置为矩形的底部和左侧轴。对于QCustomPlot小部件的默认为横轴和纵轴,它们是QCustomPlot::xAxis和QCustomPlot::yAxis。
缩放
要更改范围的大小,即放大或缩小绘图,用户可以使用鼠标滚轮。此行为由交互标志QCP::iRangeZoom控制,该标志还需要通过QCustomPlot::setInteraction激活。与范围拖动一样,缩放也可能会针对受影响的轴和方向进行选择,请参见函数QCPAxisRect::setRangeZoomAxes和QCPAxisRect::setRangeZoom。
此外,可以使用QCPAxisRect::setRangeZoomFactor控制缩放因子。在普通鼠标硬件上,一个鼠标滚轮步长对应于应用于轴范围的该因子。如果系数大于1,则向前滚动鼠标滚轮会减小范围(放大),向后滚动则会增大范围(缩小)。要反转此行为,请将鼠标滚轮缩放因子设置为小于1(但大于零)。缩放始终以绘图中的当前鼠标光标位置为中心。这意味着将光标指向感兴趣的功能,滚动鼠标滚轮可以放大该功能。
选择机制
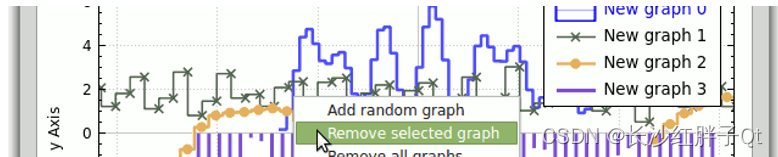
QCustomPlot提供了一种选择机制,允许用户潜在地选择绘图中的每个组件,如轴和图形。可以使用以QCP::iSelect(…) 开头的交互标志来控制特定类别的实体在绘图中是否通常是可选择的。例如,设置customPlot->setInteraction(QCP::iSelectPlottables, true) 将允许用户通过单击来选择绘图表(例如图形)。查看QCP::Interaction文档中的所有交互标志。要允许同时选择多个对象,请设置QCP::iMultiSelect交互标志。然后,用户可以通过按住“多重选择”修改器(请参见QCustomPlot::setMultiSelectModifier)连续选择多个对象,默认情况下,该修改器为Ctrl。
控制个体的可选择性和选择状态
通过在单个对象上使用setSelectable函数,可以进一步微调可选择性。例如,如果用户无法选择绘图中的特定图形,请调用thatGraph->setSelectable(false)。可以通过setSelected函数以编程方式修改选定状态。即使用户的可选择性被禁用,也可以通过编程更改选择状态。
要取消选择绘图中的所有对象,请调用QCustomPlot::deselectAll。
选定对象的外观
选定的对象通常使用不同的笔、画笔或字体显示。可以使用QCPGraph::setSelectedPen、QCPGraph::setSelectedBrush、QCPAxis::setSelectedLabelFont、QCPAxis::setSelectedBasePen、QCPItemText::setSelectedColor等方法进行配置。可以看出,它们的命名与原始(非选定)属性类似,但前缀为“选定”。
多部分对象
某些对象(如轴和图例)的外观更为复杂,因此仅选择一个布尔值是不够的。在这些情况下,selectability和selection state都是SelectablePart标志的or组合(相应的QFlags类型称为SelectableParts)。每个多部件对象定义自己的SelectablePart类型。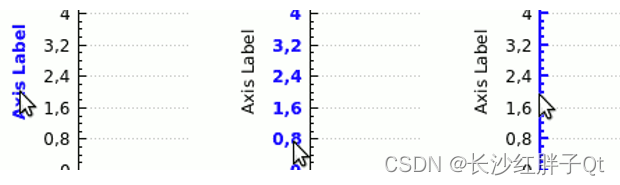
例如,QCPAxis在概念上由三部分组成:带有记号的轴主干、记号标签(数字)和轴标签。由于这三个部分可以单独选择,QCPAxis::SelectablePart定义了QCPAxis::spNone、QCPAxis: :spAxis、QCPAxis::spTickLabels和QCPAxis::spAxisLabel。要使轴主干和刻度标签可选择,但不能选择轴标签,则可调用theAxis->SetSelectableParts(QCPAxis::spAxis | QCP::spTickLabels)。要控制多部分对象的当前选择状态,请使用QCPAxis::setSelectedParts方法。
对选择变化做出反应
在选择更改后,每个对象都会发出一个名为selectionChanged的信号。无论更改是由用户引起的,还是通过调用setSelected/setSelectedParts以编程方式引起的,都无关紧要。
如果用户交互改变了绘图中的选择,则会发出QCustomPlot宽信号QCustomPlot::selectionChangedByUser。在与此信号相连的插槽中,可以检查某些对象的选择状态,并做出相应的反应。QCustomPlot::selectedPlottables、selectedItems、selectedAxes和selectedLegends方法在这里可能有助于检索特定类型的选定对象。
用户交互信号
QCustomPlot独立于选择机制,在用户交互时发出各种信号。最低级的是QCustomPlot::mouseDoubleClick、mousePress、mouseMove、mouseRelease和mouseWheel信号。当QCustomPlot小部件的相应事件触发时,它们就会发出。请注意,最干净的方法是将QCustomPlot子类化,并用相同的名称重新实现事件方法(从QWidget继承)。然而,如果不想将QCustomPlot子类化,这些信号允许更容易地访问简单任务的用户交互。
还有更高级别的信号报告绘图中某些对象的单击和双击:QCustomPlot::plottableClick、plottableDoubleClick、itemClick、itemDoubleClick、axisClick、axisDoubleClick、legendClick、legendDoubleClick、titleClick和titleDoubleClick。所有这些信号都会报告单击了哪个对象(如果是多部分对象,则报告单击了哪个部分),以及相关的QMouseEvent。
元素项:支持的图形元素
QCustomPlot允许在绘图上放置和锚定图形元素,如文本、箭头、线、矩形、任意像素地图等。它们基于抽象基类QCPAbstractItem。QCPAbstractItem的文档中详细描述了项机制以及当前可用的内置项。
使用箭头和文本的基本示例
此示例显示如何创建始终位于轴矩形顶部的文本标签,以及将打印坐标中的点与该标签连接的箭头。
// add the text label at the top:
QCPItemText *textLabel =newQCPItemText(customPlot);
textLabel->setPositionAlignment(Qt::AlignTop|Qt::AlignHCenter);
textLabel->position->setType(QCPItemPosition::ptAxisRectRatio);
textLabel->position->setCoords(0.5,0);// place position at center/top of axis rect
textLabel->setText("Text Item Demo");
textLabel->setFont(QFont(font().family(),16));// make font a bit larger
textLabel->setPen(QPen(Qt::black));// show black border around text// add the arrow:
QCPItemLine *arrow =newQCPItemLine(customPlot);
arrow->start->setParentAnchor(textLabel->bottom);
arrow->end->setCoords(4,1.6);// point to (4, 1.6) in x-y-plot coordinates
arrow->setHead(QCPLineEnding::esSpikeArrow);
请注意,即使拖动打印范围,箭头仍会附着在打印坐标(4,1.6)上,并相应地旋转/拉伸。这是通过QCustomPlot项目定位的灵活性实现的。项目可以在打印坐标、绝对像素坐标和轴矩形大小的分数单位中定位。QCPAbstractItem和QCPItemPosition的文档更详细地介绍了如何使用这些不同的可能性。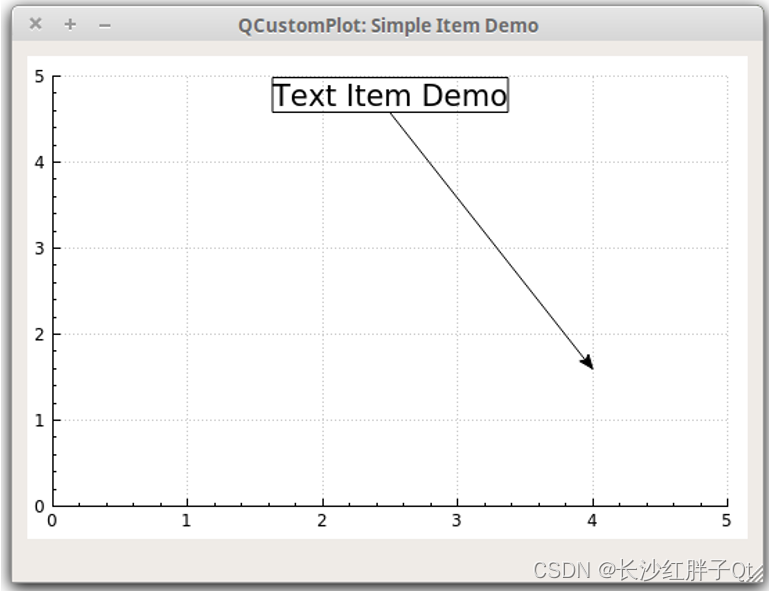
与绘图表一样,创建自己的项目也很容易。这可以通过创建自己的QCPAbstractItem子类来实现。请参阅QCPAbstractItem文档中的子类部分。
项剪切
默认情况下,项目被剪裁到主轴矩形,这意味着它们仅在主轴矩形内可见。要使项目在该axis rect外部可见,请通过调用setClipToAxisRect(false) 禁用剪裁。
另一方面,如果希望将项目剪裁到不同的轴rect,可以通过setClipAxisRect指定它。项目的clipAxisRect属性仅用于剪裁行为,原则上与项目可能通过其位置成员绑定到的坐标轴无关(请参见QCPItemPosition::SetAxis)。但是,通常情况下,用于剪裁的轴rect也包含用于项目位置的轴。
更高级的使用
有关QCustomPlot的项目系统可以实现的更高级、更真实的演示,请查看“特殊用例”项目动态轴标记”。
特殊用法
在QTextDocument中嵌入绘图生成报告通常需要在文本文档中插入绘图和图表。
示例演示了QCustomPlot如何与QTextDocument交互,以轻松实现这一点。
示例项目是完整下载包的一部分。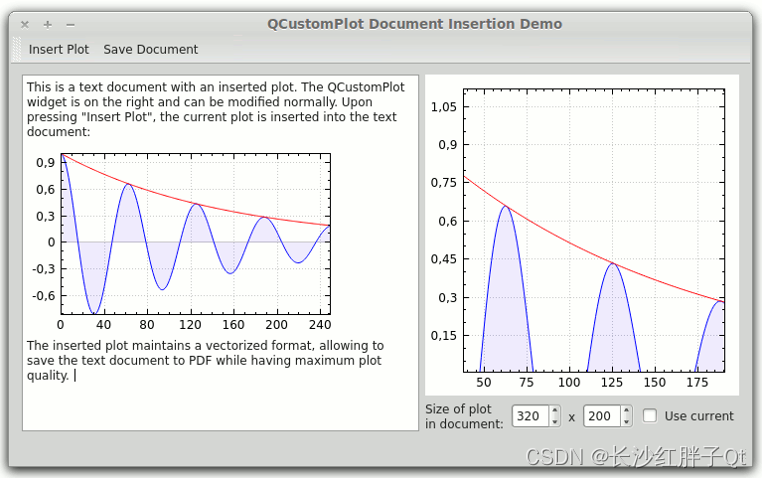
QCPDocumentObject
QCustomPlot和QTextDocument之间的接口是QCPDocumentObject。请注意,此类不在标准qcustomplot中.cpp,.h文件,但在qcpdocumentobject中定义.cpp/.h在本示例项目中。
它有两个目的:
- 从QCustomPlot生成文本字符格式。这允许在QTextDocument中插入绘图,例如在光标位置。
- 重新绘制或导出QTextDocument时,在QTextDocument内呈现静态绘图。 文本字符格式有什么好处:使用自定义格式插入QChar::ObjectReplacementCharacter是Qt允许将自定义对象插入文本文档的方式。 假设QCustomPlot是ui->plot,而文本文档的QTextEdit是ui->textEdit。第一步是将QCPDocumentObject注册为文本文档中打印对象的处理程序:
// register the plot document object (only needed once, no matter how many plots will be in the QTextDocument):
QCPDocumentObject *plotObjectHandler =newQCPDocumentObject(this);
ui->textEdit->document()->documentLayout()->registerHandler(QCPDocumentObject::PlotTextFormat, plotObjectHandler);
在这个调用之后,我们可以开始在文本文档中插入绘图。这就是静态方法QCPDocumentObject::generatePlotFormat(QCustomPlot *plot, int width, int height)的优点。它以给定的宽度和高度(如果保留为0,则使用绘图的当前宽度和高度)获取绘图的矢量化快照,并将其附加到QTextCharFormat。返回的QTextCharFormat随后可用于格式化QChar::ObjectReplacementCharacter,该字符随后显示为绘图对象。因此,可以按如下方式在当前光标位置插入绘图:
QTextCursor cursor = ui->textEdit->textCursor();// insert the current plot at the cursor position. QCPDocumentObject::generatePlotFormat creates a// vectorized snapshot of the passed plot (with the specified width and height) which gets inserted// into the text document.double width = ui->cbUseCurrentSize->isChecked()?0: ui->sbWidth->value();double height = ui->cbUseCurrentSize->isChecked()?0: ui->sbHeight->value();
cursor.insertText(QString(QChar::ObjectReplacementCharacter),QCPDocumentObject::generatePlotFormat(ui->plot, width, height));

ui->textEdit->setTextCursor(cursor);
组件cbUseCurrentSize、sbWidth和sbHeight是示例项目用户界面的一部分。如上所述,文本文档中的plot对象保持其矢量化性质。因此,将其导出为PDF(或其他能够矢量化内容的格式)可以获得最高质量的输出。将上述文档保存为PDF文件,并在PDF查看器中打开,将显示以下内容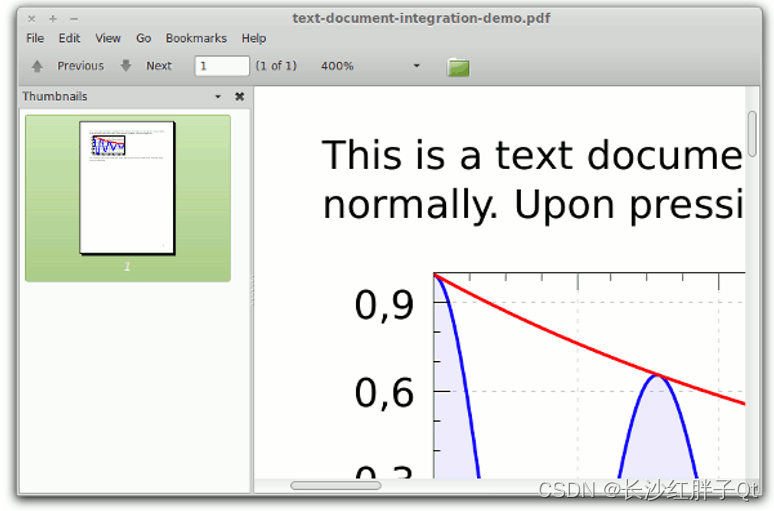
可以看出,放大插入的绘图可以显示平滑的线条。
用滚动条控制轴范围
虽然控制轴范围最直观的方法是范围拖动和缩放机制,但也可能需要为此提供滚动条。这可以通过信号和插槽将轴与滚动条连接来实现。在轴的QCPRange和滚动条的整数值之间转换需要一个中间槽。
示例项目名为scrollbar axis range control,是完整下载包的一部分。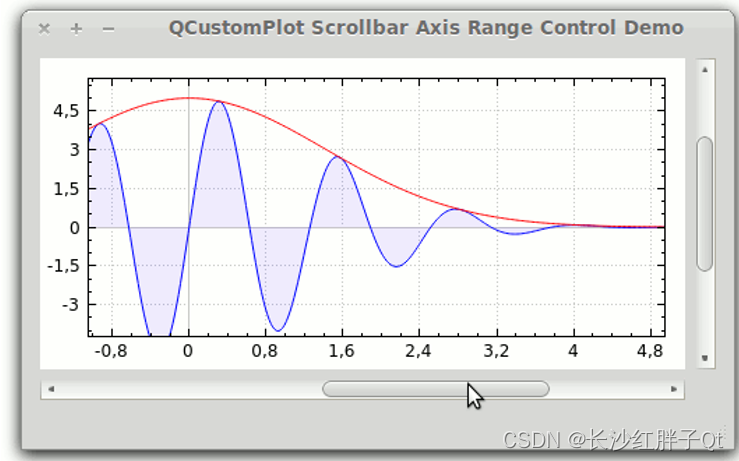
预设限制
与在滚动条和轴之间来回传播更改相关的信号是**QScrollBar::valueChanged(int)和QCPAxis::rangeChanged(QCPRange)**。由于我们希望保持正常范围的拖动和缩放,当轴的rangeChanged信号发出时,滚动条滑块的位置和大小必须更新。
QScrollBar是基于整数的。因此,我们需要一个将整数滚动条值转换为轴坐标的因子。例如,如果希望能够在坐标范围-5到5之间平滑地滚动轴,我们可以将因子设置为0.01(即将滚动条值除以100),从而将滚动条的范围设置为-500,500。
ui->horizontalScrollBar->setRange(-500,500);
ui->verticalScrollBar->setRange(-500,500);
如果可访问的坐标范围在任何点发生变化,只需更改滚动条的最大值/最小值即可。
进行坐标变换的中间槽称为horzScrollBarChanged、vertScrollBarChanged、xAxisChanged和yAxisChanged。它们连接到滚动条和x-/y轴的相应信号:
connect(ui->horizontalScrollBar,SIGNAL(valueChanged(int)),this,SLOT(horzScrollBarChanged(int)));connect(ui->verticalScrollBar,SIGNAL(valueChanged(int)),this,SLOT(vertScrollBarChanged(int)));connect(ui->plot->xAxis,SIGNAL(rangeChanged(QCPRange)),this,SLOT(xAxisChanged(QCPRange)));connect(ui->plot->yAxis,SIGNAL(rangeChanged(QCPRange)),this,SLOT(yAxisChanged(QCPRange)));
坐标变换槽
这两种类型的插槽(轴范围到滚动条和滚动条到轴范围)都相当简单。它们分别获取滚动条或滚动条的更改值,应用转换并将结果设置为轴或滚动条。这些插槽用于在移动滚动条滑块时更新轴范围:
voidMainWindow::horzScrollBarChanged(int value){// if user is dragging plot, we don't want to replot twiceif(qAbs(ui->plot->xAxis->range().center()-value/100.0)>0.01){
    ui->plot->xAxis->setRange(value/100.0, ui->plot->xAxis->range().size(), Qt::AlignCenter);
    ui->plot->replot();}}voidMainWindow::vertScrollBarChanged(int value){// if user is dragging plot, we don't want to replot twiceif(qAbs(ui->plot->yAxis->range().center()+value/100.0)>0.01){
    ui->plot->yAxis->setRange(-value/100.0, ui->plot->yAxis->range().size(), Qt::AlignCenter);
    ui->plot->replot();}}
首先,我们在这里看到滚动条值除以100.0到轴坐标的转换。还请注意:
- 当滑块位于顶部时,垂直滚动条的值较低;
- 当滑块位于底部时,垂直滚动条的值较高。
对于打印轴,情况正好相反,这就是为什么在包含垂直滚动条值的表达式中添加减号的原因,例如在设置yAxis范围时。
条件qAbs(ui->plot->xAxis->range().center()-value/100.0)>0.01是必要的,这样范围拖动不会导致双重触发,这是由更改信号和插槽之间的来回切换引起的。这可能是因为在范围拖动时,QCustomPlot会自动重新打印自己,并发出被拖动轴的范围更改信号。在这个应用程序中,rangeChanged信号将调用插槽xAxisChanged或yAxisChanged,它通过调用滚动条的setValue方法来更新滚动条滑块的位置。此方法依次发出滚动条的valueChanged信号,该信号连接到上面的插槽。在这里,如果值变化,第二次变化就会发生。该检查确保仅当当前轴范围与新的(转换的)滚动条值实际不同时才执行replot。如果用户拖动轴范围,则不会出现这种情况,因此会跳过冗余的replot和轴范围更新。
轴范围更改时更新滚动条的插槽很简单:
voidMainWindow::xAxisChanged(QCPRange range){// adjust position of scroll bar slider
  ui->horizontalScrollBar->setValue(qRound(range.center()*100.0));// adjust size of scroll bar slider
  ui->horizontalScrollBar->setPageStep(qRound(range.size()*100.0));}voidMainWindow::yAxisChanged(QCPRange range){// adjust position of scroll bar slider
  ui->verticalScrollBar->setValue(qRound(-range.center()*100.0));// adjust size of scroll bar slider
  ui->verticalScrollBar->setPageStep(qRound(range.size()*100.0));}
使用项目创建动态轴标记
这个例子演示了QCustomPlot的item系统的更高级的用法。创建了一个新的小类AxisTag,它管理一组项目,这些项目一起构成指向轴并高亮显示特定坐标的标记。
为了在主应用程序中展示它,在axis rect的右侧创建了两个轴,并制作了两个相应的标记,以指示连续更新的两个图形的最右侧数据点值。
示例项目称为axis tags example,是完整下载包的一部分: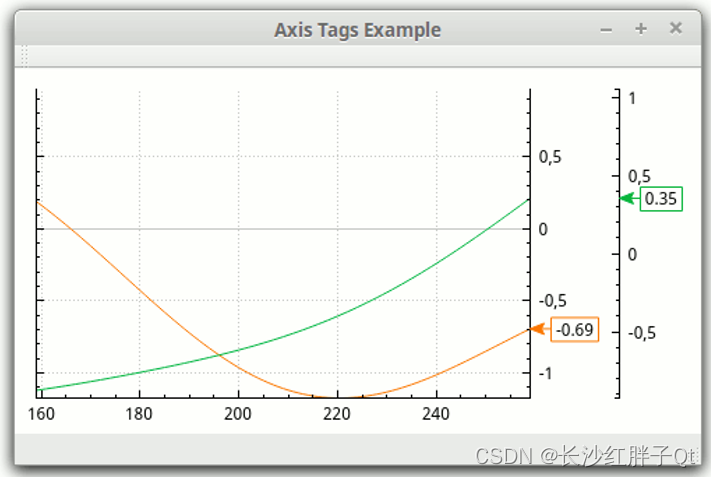
处理相关项目的新类
在上面的屏幕截图中看到的标记由两个可见项组成:一个QCPItemText,它以矩形边框包围的文本形式为我们提供当前坐标;另一个QCPItemLine,其头部的线条端点设置为箭头形状,提供指向左侧的箭头。
然而,还有另一个不可见的项目可以帮助定位标签。QCPItemTracer位于右轴矩形边界(内轴的水平位置)的相应值坐标高度处。它为其他项提供主父锚点,因此上下移动跟踪器将上下移动整个标记。
在主窗口代码中分别管理这三个项目很容易出错,而且风格也不好。因此,创建了一个新的类AxisTag,负责设置和处理这三个项。以下是AxisTag类的头代码:
#include<QObject>#include"qcustomplot.h"classAxisTag:publicQObject{
  Q_OBJECT
public:explicitAxisTag(QCPAxis *parentAxis);virtual~AxisTag();// setters:voidsetPen(const QPen &pen);voidsetBrush(const QBrush &brush);voidsetText(const QString &text);// getters:
  QPen pen()const{return mLabel->pen();}
  QBrush brush()const{return mLabel->brush();}
  QString text()const{return mLabel->text();}// other methods:voidupdatePosition(double value);protected:
  QCPAxis *mAxis;
  QPointer<QCPItemTracer> mDummyTracer;
  QPointer<QCPItemLine> mArrow;
  QPointer<QCPItemText> mLabel;};
为了本示例的清晰性,将接口保持在最小值。在现实世界中,用户可能需要该类的更多定制和额外功能,例如,一个泛化来支持其他轴方向。
下一个代码段是AxisTag类的实现。在其构造函数中,三个项之间建立了以下锚定父子关系。青蓝色圆圈表示QCPItemTracer位置、QCPItemLine结束/开始位置和QCPItemText位置。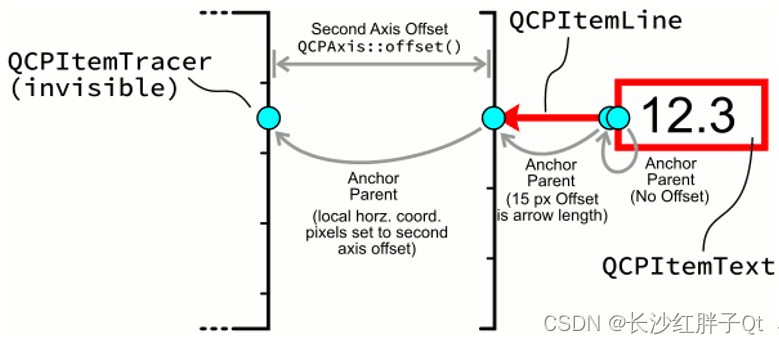
可以找到相关代码段的解释:
#include"axistag.h"AxisTag::AxisTag(QCPAxis *parentAxis):QObject(parentAxis),mAxis(parentAxis){// The dummy tracer serves here as an invisible anchor which always sticks to the right side of// the axis rect
  mDummyTracer =newQCPItemTracer(mAxis->parentPlot());
  mDummyTracer->setVisible(false);
  mDummyTracer->position->setTypeX(QCPItemPosition::ptAxisRectRatio);
  mDummyTracer->position->setTypeY(QCPItemPosition::ptPlotCoords);
  mDummyTracer->position->setAxisRect(mAxis->axisRect());
  mDummyTracer->position->setAxes(0, mAxis);
  mDummyTracer->position->setCoords(1,0);// the arrow end (head) is set to move along with the dummy tracer by setting it as its parent// anchor. Its coordinate system (setCoords) is thus pixels, and this is how the needed horizontal// offset for the tag of the second y axis is achieved. This horizontal offset gets dynamically// updated in AxisTag::updatePosition. the arrow "start" is simply set to have the "end" as parent// anchor. It is given a horizontal offset to the right, which results in a 15 pixel long arrow.
  mArrow =newQCPItemLine(mAxis->parentPlot());
  mArrow->setLayer("overlay");
  mArrow->setClipToAxisRect(false);
  mArrow->setHead(QCPLineEnding::esSpikeArrow);
  mArrow->end->setParentAnchor(mDummyTracer->position);
  mArrow->start->setParentAnchor(mArrow->end);
  mArrow->start->setCoords(15,0);// The text label is anchored at the arrow start (tail) and has its "position" aligned at the// left, and vertically centered to the text label box.
  mLabel =newQCPItemText(mAxis->parentPlot());
  mLabel->setLayer("overlay");
  mLabel->setClipToAxisRect(false);
  mLabel->setPadding(QMargins(3,0,3,0));
  mLabel->setBrush(QBrush(Qt::white));
  mLabel->setPen(QPen(Qt::blue));
  mLabel->setPositionAlignment(Qt::AlignLeft|Qt::AlignVCenter);
  mLabel->position->setParentAnchor(mArrow->start);}AxisTag::~AxisTag(){if(mDummyTracer)
    mDummyTracer->parentPlot()->removeItem(mDummyTracer);if(mArrow)
    mArrow->parentPlot()->removeItem(mArrow);if(mLabel)
    mLabel->parentPlot()->removeItem(mLabel);}voidAxisTag::setPen(const QPen &pen){
  mArrow->setPen(pen);
  mLabel->setPen(pen);}voidAxisTag::setBrush(const QBrush &brush){
  mLabel->setBrush(brush);}voidAxisTag::setText(const QString &text){
  mLabel->setText(text);}voidAxisTag::updatePosition(double value){// since both the arrow and the text label are chained to the dummy tracer (via anchor// parent-child relationships) it is sufficient to update the dummy tracer coordinates. The// Horizontal coordinate type was set to ptAxisRectRatio so to keep it aligned at the right side// of the axis rect, it is always kept at 1. The vertical coordinate type was set to// ptPlotCoordinates of the passed parent axis, so the vertical coordinate is set to the new// value.
  mDummyTracer->position->setCoords(1, value);// We want the arrow head to be at the same horizontal position as the axis backbone, even if// the axis has a certain offset from the axis rect border (like the added second y axis). Thus we// set the horizontal pixel position of the arrow end (head) to the axis offset (the pixel// distance to the axis rect border). This works because the parent anchor of the arrow end is// the dummy tracer, which, as described earlier, is tied to the right axis rect border.
  mArrow->end->setCoords(mAxis->offset(),0);}
主要应用
主应用程序现在使用了这个新的AxisTag类,从而避免了直接进行项操作,所有这些都是在AxisTag实例中处理的。
这是MainWindow类的标题。与之前一样,可以在内联注释中找到解释:
#include<QMainWindow>#include"qcustomplot.h"#include"axistag.h"namespace Ui {classMainWindow;}classMainWindow:publicQMainWindow{
  Q_OBJECT

public:explicitMainWindow(QWidget *parent =0);~MainWindow();private slots:voidtimerSlot();private:
  Ui::MainWindow *ui;
  QCustomPlot *mPlot;
  QPointer<QCPGraph> mGraph1;
  QPointer<QCPGraph> mGraph2;
  AxisTag *mTag1;
  AxisTag *mTag2;
  QTimer mDataTimer;};
最后是MainWindow类的实现。它基本上在右边设置了两个y轴、两个图形和两个轴标记。timerSlot()由QTimer重复调用。在插槽中,新的数据点被添加到图形中,标记通过AxisTag::updatePosition方法更新。
#include"mainwindow.h"#include"ui_mainwindow.h"MainWindow::MainWindow(QWidget *parent):QMainWindow(parent),ui(new Ui::MainWindow),mPlot(0),mTag1(0),mTag2(0){
  ui->setupUi(this);

  mPlot =newQCustomPlot(this);setCentralWidget(mPlot);// configure plot to have two right axes:
  mPlot->yAxis->setTickLabels(false);connect(mPlot->yAxis2,SIGNAL(rangeChanged(QCPRange)), mPlot->yAxis,SLOT(setRange(QCPRange)));// left axis only mirrors inner right axis
  mPlot->yAxis2->setVisible(true);
  mPlot->axisRect()->addAxis(QCPAxis::atRight);
  mPlot->axisRect()->axis(QCPAxis::atRight,0)->setPadding(30);// add some padding to have space for tags
  mPlot->axisRect()->axis(QCPAxis::atRight,1)->setPadding(30);// add some padding to have space for tags// create graphs:
  mGraph1 = mPlot->addGraph(mPlot->xAxis, mPlot->axisRect()->axis(QCPAxis::atRight,0));
  mGraph2 = mPlot->addGraph(mPlot->xAxis, mPlot->axisRect()->axis(QCPAxis::atRight,1));
  mGraph1->setPen(QPen(QColor(250,120,0)));
  mGraph2->setPen(QPen(QColor(0,180,60)));// create tags with newly introduced AxisTag class (see axistag.h/.cpp):
  mTag1 =newAxisTag(mGraph1->valueAxis());
  mTag1->setPen(mGraph1->pen());
  mTag2 =newAxisTag(mGraph2->valueAxis());
  mTag2->setPen(mGraph2->pen());connect(&mDataTimer,SIGNAL(timeout()),this,SLOT(timerSlot()));
  mDataTimer.start(40);}MainWindow::~MainWindow(){delete ui;}voidMainWindow::timerSlot(){// calculate and add a new data point to each graph:
  mGraph1->addData(mGraph1->dataCount(),qSin(mGraph1->dataCount()/50.0)+qSin(mGraph1->dataCount()/50.0/0.3843)*0.25);
  mGraph2->addData(mGraph2->dataCount(),qCos(mGraph2->dataCount()/50.0)+qSin(mGraph2->dataCount()/50.0/0.4364)*0.15);// make key axis range scroll with the data:
  mPlot->xAxis->rescale();
  mGraph1->rescaleValueAxis(false,true);
  mGraph2->rescaleValueAxis(false,true);
  mPlot->xAxis->setRange(mPlot->xAxis->range().upper,100, Qt::AlignRight);// update the vertical axis tag positions and texts to match the rightmost data point of the graphs:double graph1Value = mGraph1->dataMainValue(mGraph1->dataCount()-1);double graph2Value = mGraph2->dataMainValue(mGraph2->dataCount()-1);
  mTag1->updatePosition(graph1Value);
  mTag2->updatePosition(graph2Value);
  mTag1->setText(QString::number(graph1Value,'f',2));
  mTag2->setText(QString::number(graph2Value,'f',2));ss

  mPlot->replot();}
上一篇:《QCustomPlot开发笔记(一):QCustomPlot简介、下载以及基础绘图》
下一篇:敬请期待…
若该文为原创文章,转载请注明原文出处
本文章博客地址:https://hpzwl.blog.csdn.net/article/details/124567140
版权归原作者 长沙红胖子Qt 所有, 如有侵权,请联系我们删除。