
文章目录
前情提要
这边已经将Prometheus安装到k8s中了
监控k8s节点
安装node_exporter,我这边是采用的DaemonSet来确保每个节点都有对应的pod
apiVersion: apps/v1
kind: DaemonSet
metadata:name: node-exporter
  namespace: monitor
  labels:k8s-app: node-exporter
spec:selector:matchLabels:k8s-app: node-exporter
  template:metadata:labels:k8s-app: node-exporter
    spec:hostPID:true#这几项是定义了该pod直接共享node的资源,这样也不需要用svc来暴露端口了hostIPC:truehostNetwork:truecontainers:-image: bitnami/node-exporter:latest
        args:---web.listen-address=$(HOSTIP):9100---path.procfs=/host/proc
        ---path.sysfs=/host/sys
        ---path.rootfs=/host/root
        ---collector.filesystem.ignored-mount-points=^/(dev|proc|sys|var/lib/docker/.+)($|/)
        ---collector.filesystem.ignored-fs-types=^(autofs|binfmt_misc|cgroup|configfs|debugfs|devpts|devtmpfs|fusectl|hugetlbfs|mqueue|overlay|proc|procfs|pstore|rpc_pipefs|securityfs|sysfs|tracefs)$
        name: node-exporter
        env:-name: HOSTIP
          valueFrom:fieldRef:fieldPath: status.hostIP
        resources:requests:cpu: 150m
            memory: 180Mi
          limits:cpu: 150m
            memory: 180Mi
        securityContext:runAsNonRoot:truerunAsUser:65534volumeMounts:-name: proc        # 我对应的卷都是用的hostPath,直接将宿主机卷挂给pod避免pod无法正常获取node信息mountPath: /host/proc
        -name: sys
          mountPath: /host/sys
        -name: root
          mountPath: /host/root
          mountPropagation: HostToContainer
          readOnly:trueports:-containerPort:9100protocol: TCP
          name: http
      tolerations:#这里是为了让pod能在master上运行,加了容忍度-key: node-role.kubernetes.io/control-plane
        operator: Exists
        effect: NoSchedule
      volumes:-name: proc
        hostPath:path: /proc
      -name: dev
        hostPath:path: /dev
      -name: sys
        hostPath:path: /sys
      -name: root
        hostPath:path: /
root@master1:~/k8s-prometheus# kubectl apply -f node-export.yaml
root@master1:~/k8s-prometheus# kubectl get pod -n monitor
NAME                            READY   STATUS    RESTARTS      AGE
grafana-core-5c68549dc7-t92fv   1/1     Running   0             2d17h
node-exporter-6fqvt             1/1     Running   0             2d19h
node-exporter-bgrjn             1/1     Running   0             2d19h
node-exporter-bk7m4             1/1     Running   0             2d19h
node-exporter-m7wgx             1/1     Running   0             2d19h
node-exporter-mbgtg             1/1     Running   0             2d19h
node-exporter-rdtcs             1/1     Running   0             2d19h
prometheus-7d659686d7-x62vt     1/1     Running   0             2d16h
root@master1:~/k8s-prometheus# ss -lntp |grep node_exporter
LISTEN    0409610.10.21.170:9100             0.0.0.0:*        users:(("node_exporter",pid=2597275,fd=3))#可以看到它直接使用了宿主机的9100端口
监控coreDns服务
coredns自身提供了/metrics接口,我们直接配置prometheus去它的9153拿数据即可
root@master1:~/k8s-prometheus# kubectl -n kube-system get svc
NAME       TYPE        CLUSTER-IP    EXTERNAL-IP   PORT(S)                  AGE
kube-dns   ClusterIP   10.100.0.10   <none>53/UDP,53/TCP,9153/TCP   22d
root@master1:~/k8s-prometheus# kubectl -n kube-system get cm
NAME                                 DATA   AGE
coredns                              1      22d
extension-apiserver-authentication   6      22d
kube-proxy                           2      22d
kube-root-ca.crt                     1      22d
kubeadm-config                       1      22d
kubelet-config                       1      22d
root@master1:~/k8s-prometheus# kubectl -n kube-system get cm coredns -o yaml
apiVersion: v1
data:
  Corefile: |
    .:53 {
        errors
        health {
           lameduck 5s
        }
        ready
        kubernetes cluster.local in-addr.arpa ip6.arpa {
           pods insecure
           fallthrough in-addr.arpa ip6.arpa
           ttl 30}
        prometheus :9153
        forward . /etc/resolv.conf {
           max_concurrent 1000}
        cache 30
        loop
        reload
        loadbalance
    }
kind: ConfigMap
metadata:
  creationTimestamp: "2022-10-11T10:23:37Z"
  name: coredns
  namespace: kube-system
  resourceVersion: "228"
  uid: 632b41d8-6dda-40b7-81c1-b6cffefaf2e8
监控Ingress-nginx
Ingress-nginx自身默认也提供了/metrics接口,但是需要我们先给他暴露10254端口,暴露之后我们直接配置prometheus去它的9153拿数据即可
暴露Ingress端口有多种方法,比如把对应deployment的网络模式改为hostNetwork,直接将node的10254给到Ingress
或者先在deployment中将端口加上,再去Ingress对应的svc里面将10254端口代理一下
这边我用的是第一种方式
root@master1:~# kubectl -n ingress-nginx edit deployments.apps ingress-nginx-controller
需要改的地方有两处
root@master1:~# kubectl -n ingress-nginx get deployments.apps ingress-nginx-controller -o yamlapiVersion: apps/v1
kind: Deployment
metadata:annotations:deployment.kubernetes.io/revision:"8"kubectl.kubernetes.io/last-applied-configuration:|
      {"apiVersion":"apps/v1","kind":"Deployment","metadata":{"annotations":{},"labels":{"app.kubernetes.io/component":"controller","app.kubernetes.io/instance":"ingress-nginx","app.kubernetes.io/managed-by":"Helm","app.kubernetes.io/name":"ingress-nginx","app.kubernetes.io/version":"1.1.1","helm.sh/chart":"ingress-nginx-4.0.15"},"name":"ingress-nginx-controller","namespace":"ingress-nginx"},"spec":{"minReadySeconds":0,"revisionHistoryLimit":10,"selector":{"matchLabels":{"app.kubernetes.io/component":"controller","app.kubernetes.io/instance":"ingress-nginx","app.kubernetes.io/name":"ingress-nginx"}},"strategy":{"rollingUpdate":{"maxUnavailable":1},"type":"RollingUpdate"},"template":{"metadata":{"labels":{"app.kubernetes.io/component":"controller","app.kubernetes.io/instance":"ingress-nginx","app.kubernetes.io/name":"ingress-nginx"}},"spec":{"containers":[{"args":["/nginx-ingress-controller","--election-id=ingress-controller-leader","--controller-class=k8s.io/ingress-nginx","--configmap=$(POD_NAMESPACE)/ingress-nginx-controller","--validating-webhook=:8443","--validating-webhook-certificate=/usr/local/certificates/cert","--validating-webhook-key=/usr/local/certificates/key","--watch-ingress-without-class=true","--publish-status-address=localhost"],"env":[{"name":"POD_NAME","valueFrom":{"fieldRef":{"fieldPath":"metadata.name"}}},{"name":"POD_NAMESPACE","valueFrom":{"fieldRef":{"fieldPath":"metadata.namespace"}}},{"name":"LD_PRELOAD","value":"/usr/local/lib/libmimalloc.so"}],"image":"registry.cn-qingdao.aliyuncs.com/kubernetes_xingej/nginx-ingress-controller:v1.1.1","imagePullPolicy":"IfNotPresent","lifecycle":{"preStop":{"exec":{"command":["/wait-shutdown"]}}},"livenessProbe":{"failureThreshold":5,"httpGet":{"path":"/healthz","port":10254,"scheme":"HTTP"},"initialDelaySeconds":10,"periodSeconds":10,"successThreshold":1,"timeoutSeconds":1},"name":"controller","ports":[{"containerPort":80,"hostPort":80,"name":"http","protocol":"TCP"},{"containerPort":443,"hostPort":443,"name":"https","protocol":"TCP"},{"containerPort":8443,"name":"webhook","protocol":"TCP"}],"readinessProbe":{"failureThreshold":3,"httpGet":{"path":"/healthz","port":10254,"scheme":"HTTP"},"initialDelaySeconds":10,"periodSeconds":10,"successThreshold":1,"timeoutSeconds":1},"resources":{"requests":{"cpu":"100m","memory":"90Mi"}},"securityContext":{"allowPrivilegeEscalation":true,"capabilities":{"add":["NET_BIND_SERVICE"],"drop":["ALL"]},"runAsUser":101},"volumeMounts":[{"mountPath":"/usr/local/certificates/","name":"webhook-cert","readOnly":true}]}],"dnsPolicy":"ClusterFirst","nodeSelector":{"ingress-ready":"true","kubernetes.io/os":"linux"},"serviceAccountName":"ingress-nginx","terminationGracePeriodSeconds":0,"tolerations":[{"effect":"NoSchedule","key":"node-role.kubernetes.io/master","operator":"Equal"}],"volumes":[{"name":"webhook-cert","secret":{"secretName":"ingress-nginx-admission"}}]}}}}creationTimestamp:"2022-10-31T08:30:33Z"generation:8labels:app.kubernetes.io/component: controller
    app.kubernetes.io/instance: ingress-nginx
    app.kubernetes.io/managed-by: Helm
    app.kubernetes.io/name: ingress-nginx
    app.kubernetes.io/version: 1.1.1
    helm.sh/chart: ingress-nginx-4.0.15
  name: ingress-nginx-controller
  namespace: ingress-nginx
  resourceVersion:"3780917"uid: e4b28ba0-eb0b-45e3-a0b8-c03797c8f416
spec:progressDeadlineSeconds:600replicas:1revisionHistoryLimit:10selector:matchLabels:app.kubernetes.io/component: controller
      app.kubernetes.io/instance: ingress-nginx
      app.kubernetes.io/name: ingress-nginx
  strategy:rollingUpdate:maxSurge: 25%
      maxUnavailable:1type: RollingUpdate
  template:metadata:creationTimestamp:nulllabels:app.kubernetes.io/component: controller
        app.kubernetes.io/instance: ingress-nginx
        app.kubernetes.io/name: ingress-nginx
    spec:containers:-args:- /nginx-ingress-controller
        ---election-id=ingress-controller-leader
        ---controller-class=k8s.io/ingress-nginx
        ---configmap=$(POD_NAMESPACE)/ingress-nginx-controller
        ---validating-webhook=:8443---validating-webhook-certificate=/usr/local/certificates/cert
        ---validating-webhook-key=/usr/local/certificates/key
        ---watch-ingress-without-class=true
        ---publish-status-address=localhost
        env:-name: POD_NAME
          valueFrom:fieldRef:apiVersion: v1
              fieldPath: metadata.name
        -name: POD_NAMESPACE
          valueFrom:fieldRef:apiVersion: v1
              fieldPath: metadata.namespace
        -name: LD_PRELOAD
          value: /usr/local/lib/libmimalloc.so
        image: bitnami/nginx-ingress-controller:1.1.1
        imagePullPolicy: IfNotPresent
        lifecycle:preStop:exec:command:- /wait-shutdown
        livenessProbe:failureThreshold:5httpGet:path: /healthz
            port:10254scheme: HTTP
          initialDelaySeconds:10periodSeconds:10successThreshold:1timeoutSeconds:1name: controller
        ports:-containerPort:10254#这两行是将10254暴露出来hostPort:10254name: prometheus
          protocol: TCP
        -containerPort:80hostPort:80name: http
          protocol: TCP
        -containerPort:443hostPort:443name: https
          protocol: TCP
        -containerPort:8443hostPort:8443name: webhook
          protocol: TCP
        readinessProbe:failureThreshold:3httpGet:path: /healthz
            port:10254scheme: HTTP
          initialDelaySeconds:10periodSeconds:10successThreshold:1timeoutSeconds:1resources:requests:cpu: 100m
            memory: 90Mi
        securityContext:allowPrivilegeEscalation:truecapabilities:add:- NET_BIND_SERVICE
            drop:- ALL
          runAsUser:101terminationMessagePath: /dev/termination-log
        terminationMessagePolicy: File
        volumeMounts:-mountPath: /usr/local/certificates/
          name: webhook-cert
          readOnly:truednsPolicy: ClusterFirst
      hostNetwork:true# 这里是声明直接将宿主机的端口给Ingress使用nodeSelector:ingress-ready:"true"kubernetes.io/os: linux
      restartPolicy: Always
      schedulerName: default-scheduler
      securityContext:{}serviceAccount: ingress-nginx
      serviceAccountName: ingress-nginx
      terminationGracePeriodSeconds:0tolerations:-effect: NoSchedule
        key: node-role.kubernetes.io/master
        operator: Equal
      volumes:-name: webhook-cert
        secret:defaultMode:420secretName: ingress-nginx-admission
status:availableReplicas:1conditions:-lastTransitionTime:"2022-10-31T08:30:33Z"lastUpdateTime:"2022-10-31T08:30:33Z"message: Deployment has minimum availability.
    reason: MinimumReplicasAvailable
    status:"True"type: Available
  -lastTransitionTime:"2022-10-31T08:46:21Z"lastUpdateTime:"2022-11-03T10:25:05Z"message: ReplicaSet "ingress-nginx-controller-87bc8b9c7" has successfully progressed.
    reason: NewReplicaSetAvailable
    status:"True"type: Progressing
  observedGeneration:8readyReplicas:1replicas:1updatedReplicas:1
这时候可以检查一下宿主机的端口是否被ingress占用
root@node1:~# ss -lntp |grep nginx-ingress
LISTEN    04096127.0.0.1:10245            0.0.0.0:*        users:(("nginx-ingress-c",pid=1398881,fd=8))
监控k8s-state-metrics
root@master1:~# git clone https://github.com/kubernetes/kube-state-metrics.git
root@master1:~# cd kube-state-metrics/examples/standard/
root@master1:~/kube-state-metrics/examples/standard# ls
cluster-role-binding.yaml  cluster-role.yaml  deployment.yaml  service-account.yaml  service.yaml
# 克隆下来之后直接有几个yaml文件,稍微修改一下就可以直接用了
这边改一下service.yaml
root@master1:~/kube-state-metrics/examples/standard# cat service.yaml
apiVersion: v1
kind: Service
metadata:
  labels:
    app.kubernetes.io/component: exporter
    app.kubernetes.io/name: kube-state-metrics
    app.kubernetes.io/version: 2.6.0
  name: kube-state-metrics
  namespace: kube-system
spec:
  type: ClusterIP        # 刚clone下来是无头服务,我这边改为了ClusterIP
  ports:
  - name: http-metrics
    port: 8080
    targetPort: http-metrics
  - name: telemetry
    port: 8081
    targetPort: telemetry
  selector:
    app.kubernetes.io/name: kube-state-metrics
然后apply一下并进行检查
root@master1:~/kube-state-metrics/examples/standard# kubectl apply -f .        #.不要掉了,指的apply当前目录下的yaml
root@master1:~/kube-state-metrics/examples/standard# kubectl get svc,pod -n kube-system
NAME                         TYPE        CLUSTER-IP       EXTERNAL-IP   PORT(S)                  AGE
service/kube-dns             ClusterIP   10.100.0.10      <none>53/UDP,53/TCP,9153/TCP   23d
service/kube-state-metrics   ClusterIP   10.100.162.224   <none>8080/TCP,8081/TCP        91m  #这就是刚刚生成的svc

NAME                                         READY   STATUS    RESTARTS       AGE
pod/coredns-c676cc86f-7bd45                  1/1     Running   5(2d2h ago)   22d
pod/coredns-c676cc86f-7l2c8                  1/1     Running   0              22d
pod/coredns-c676cc86f-gl6qc                  1/1     Running   0              22d
pod/coredns-c676cc86f-rxcjn                  1/1     Running   0              22d
pod/kube-apiserver-master1.org               1/1     Running   6(2d2h ago)   17d
pod/kube-apiserver-master2.org               1/1     Running   0              17d
pod/kube-apiserver-master3.org               1/1     Running   0              17d
pod/kube-controller-manager-master1.org      1/1     Running   7(2d2h ago)   23d
pod/kube-controller-manager-master2.org      1/1     Running   0              17d
pod/kube-controller-manager-master3.org      1/1     Running   0              17d
pod/kube-proxy-5pnh5                         1/1     Running   0              21d
pod/kube-proxy-vws54                         1/1     Running   0              21d
pod/kube-proxy-wlknz                         1/1     Running   0              21d
pod/kube-proxy-wtnnf                         1/1     Running   5(2d2h ago)   21d
pod/kube-proxy-xkkhp                         1/1     Running   0              21d
pod/kube-proxy-zf4vg                         1/1     Running   0              21d
pod/kube-scheduler-master1.org               1/1     Running   7(2d2h ago)   23d
pod/kube-scheduler-master2.org               1/1     Running   0              22d
pod/kube-scheduler-master3.org               1/1     Running   0              22d
pod/kube-state-metrics-757ff7b448-lwwlg      1/1     Running   0              90m        #这个就是刚刚生成的pod
验证一下metrics是否有数据
root@node1:~# curl  -I  10.100.162.224:8080/metrics
HTTP/1.1 200 OK
Content-Type: text/plain;version=0.0.4
Date: Thu, 03 Nov 202216:25:21 GMT
修改Prometheus的configmap并重载Prometheus
root@master1:~/k8s-prometheus# cat prometheus-configmap.yaml
apiVersion: v1
kind: ConfigMap
metadata:
  name: prometheus-config
  namespace: monitor
data:
  prometheus.yml: |
    global:
      scrape_interval: 15s
      scrape_timeout: 15s
    scrape_configs:
    - job_name: 'prometheus'
      static_configs:
      - targets: ['localhost:9090']
    - job_name: 'Linux Server'
      static_configs:
      - targets:
        - 'xxx.xxx.xxx.xxx:9100'
        - 'xxx.xxx.xxx.xxx:9100'
        - 'xxx.xxx.xxx.xxx:9100'
        - 'xxx.xxx.xxx.xxx:9100'
        - 'xxx.xxx.xxx.xxx:9100'
        - 'xxx.xxx.xxx.xxx:9100'
    - job_name: 'coredns'
      static_configs:    #我这边基本上都是用IP写的target,实际上也可以用域名,默认的域名书写方式为 kube-dns.kube-system.svc.cluster.local
      - targets: ['xxx.xxx.xxx.xxx:9153']
    - job_name: 'ingress-nginx'
      static_configs:
        - targets: ['xxx.xxx.xxx.xxx:10254']
    - job_name: 'k8s-state-metrics'
      static_configs:
      - targets:
        - '10.100.162.224:8080'
        - '10.100.162.224:8081'
root@master1:~/k8s-prometheus# kubectl apply -f prometheus-configmap.yaml
root@master1:~/k8s-prometheus# curl -XPOST 10.100.122.13:9090/-/reload
查看是否生效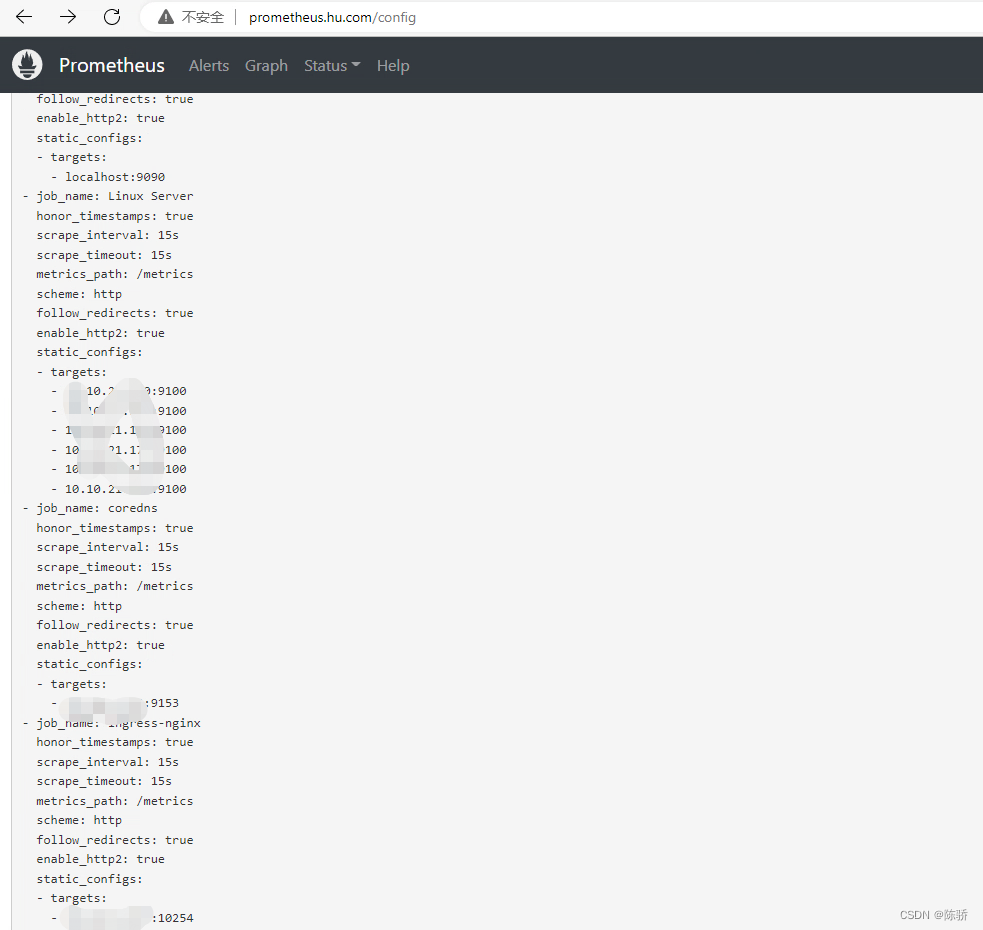
Grafana展示监控的数据
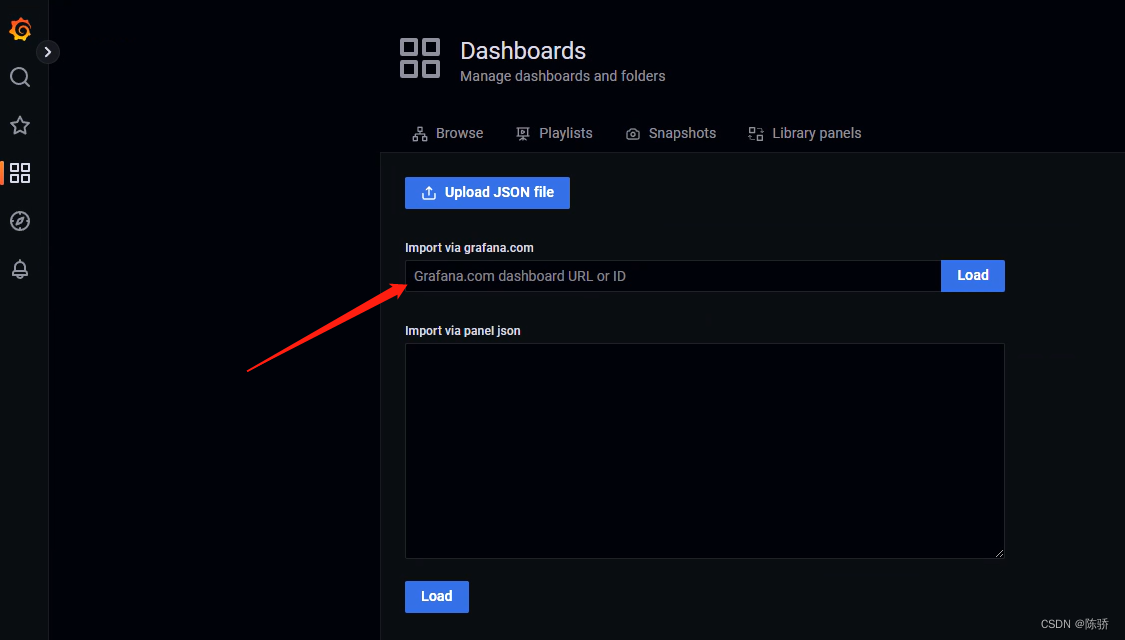
基本上大部分需要import的都可以直接去Grafana官网搜索,搜索完成之后可以copy 对应id,也可以下载下来
下面演示导入ID的操作(如果是导入json的话,只需要复制json文件粘贴到对应的框里面即可)
节点基础信息监控
这个dashboard导入的是9276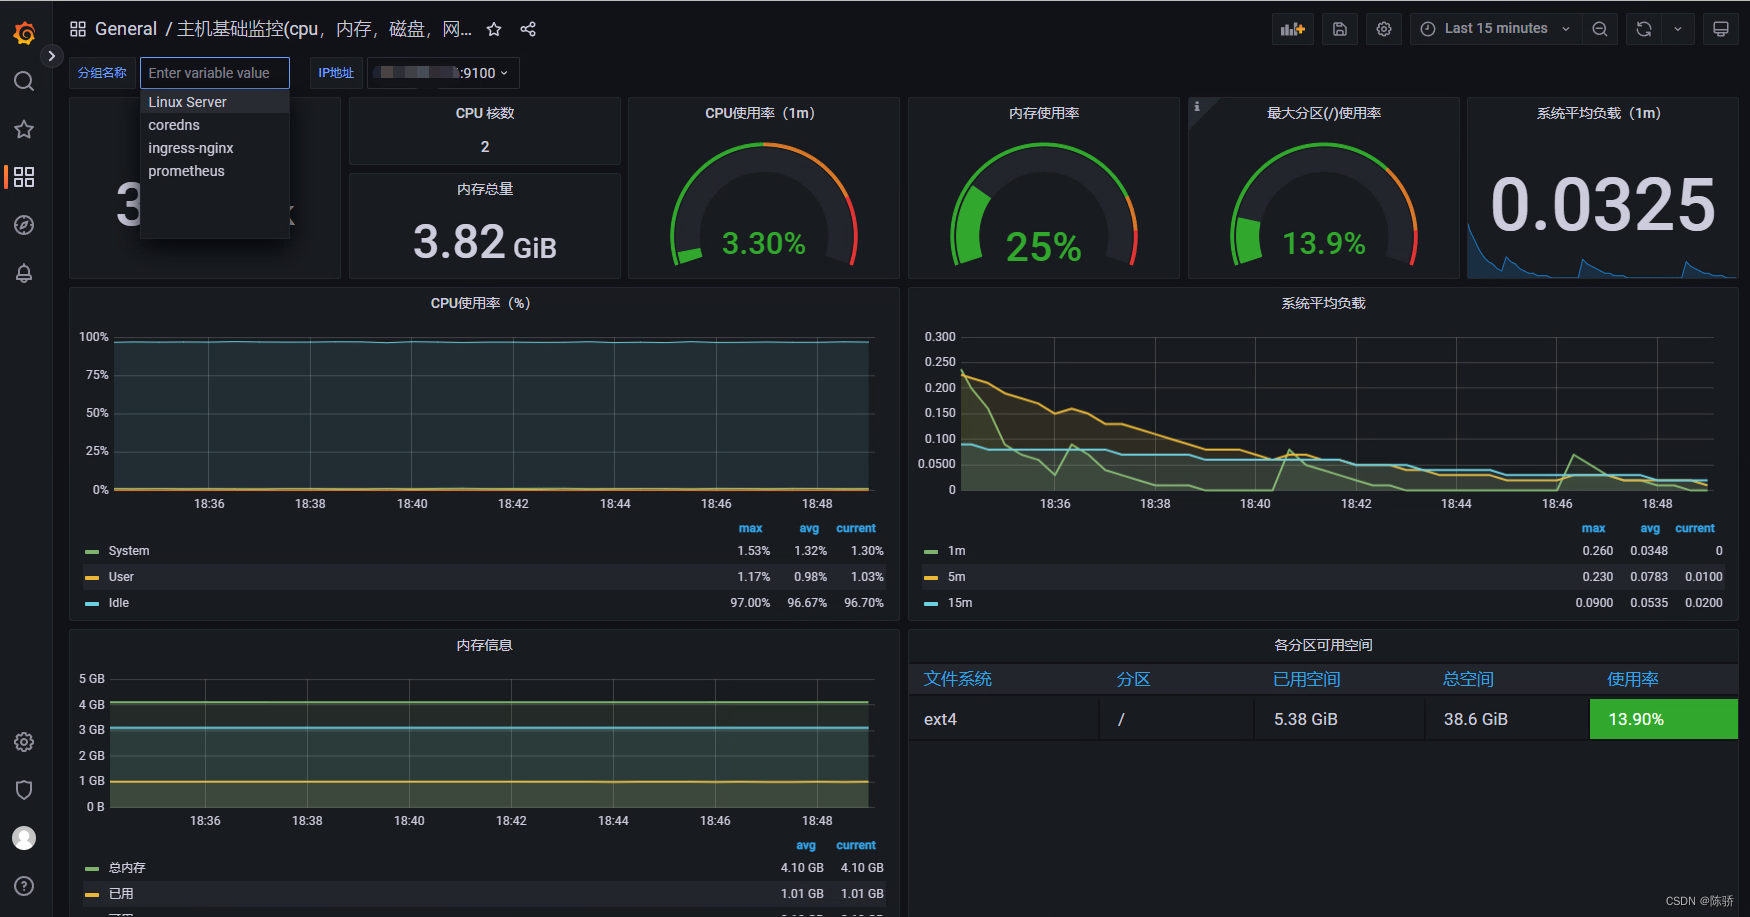
coredns监控
这里导入的是5926,效果如下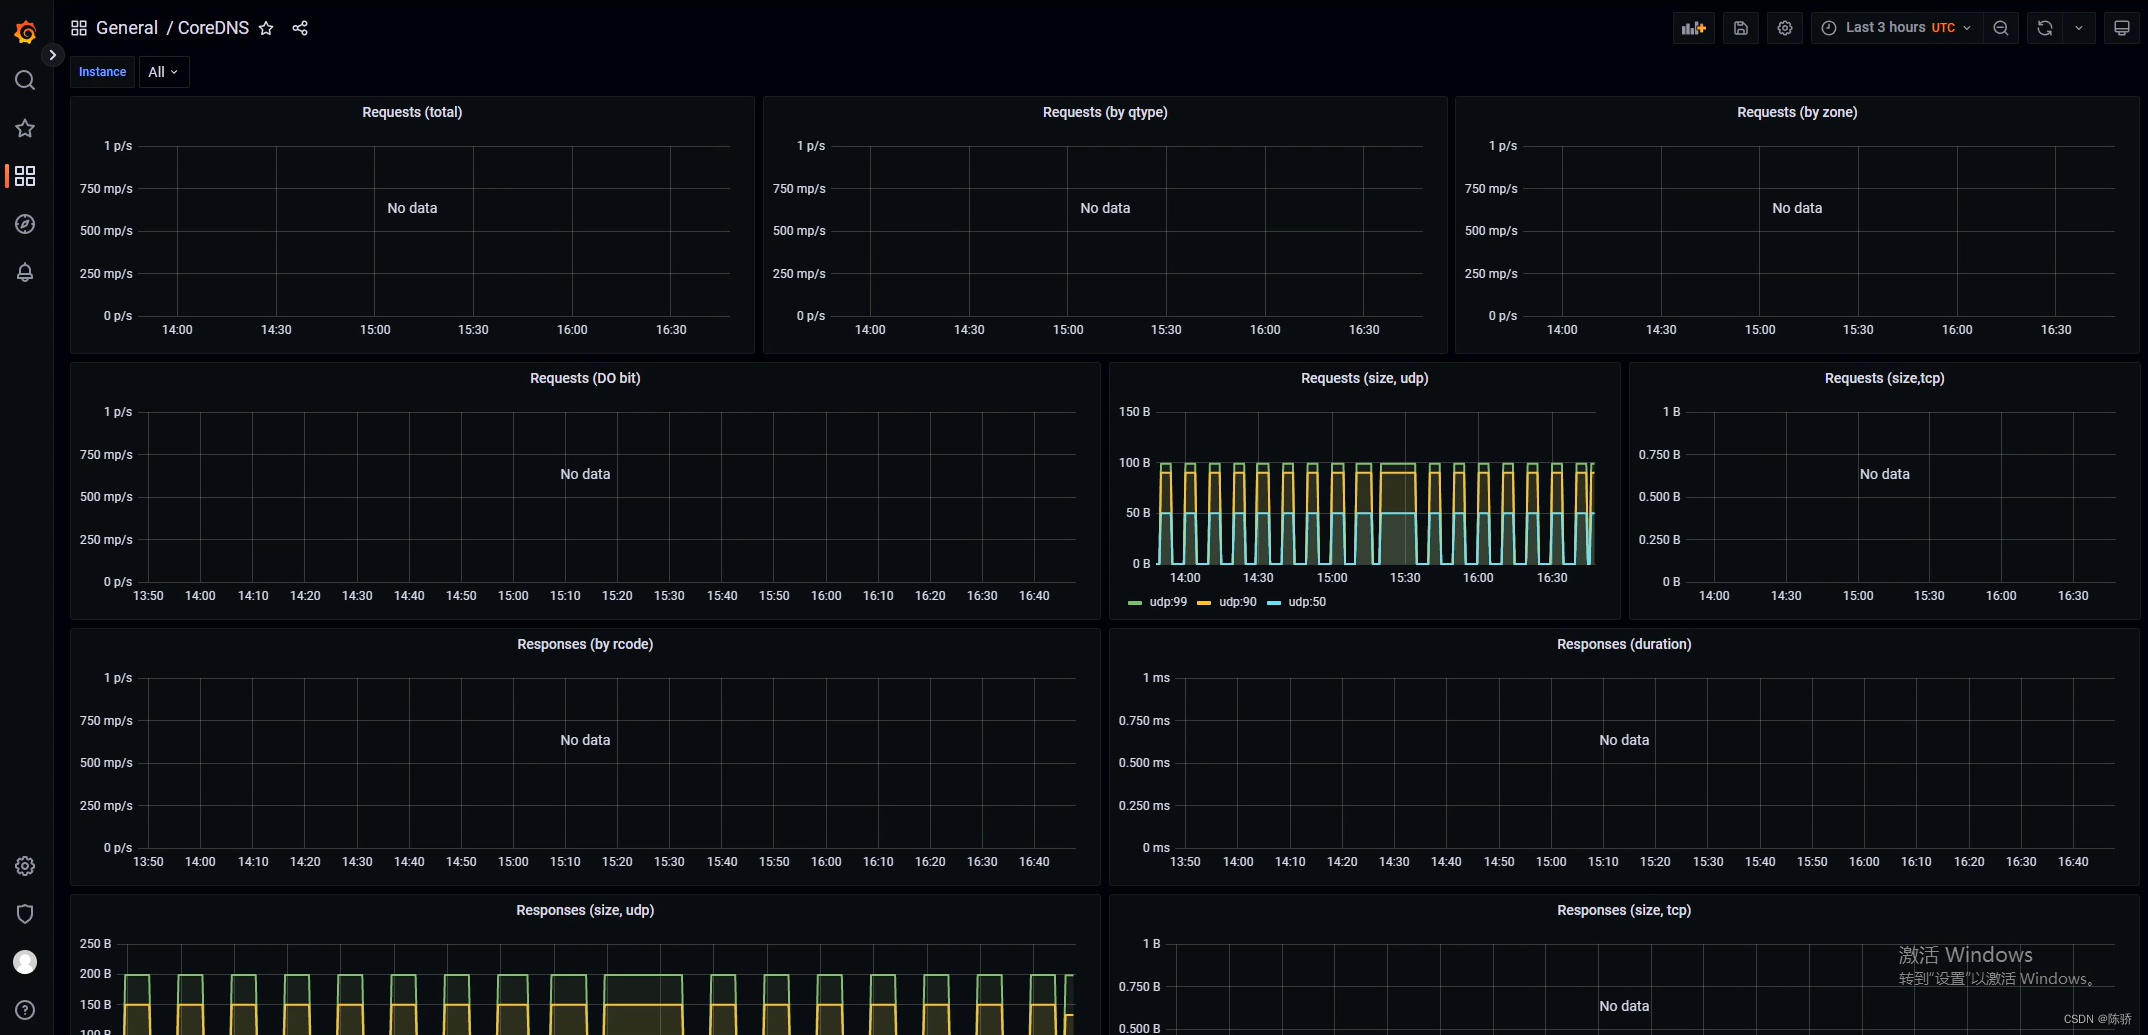
Ingress监控
这里导入的是9614,效果如下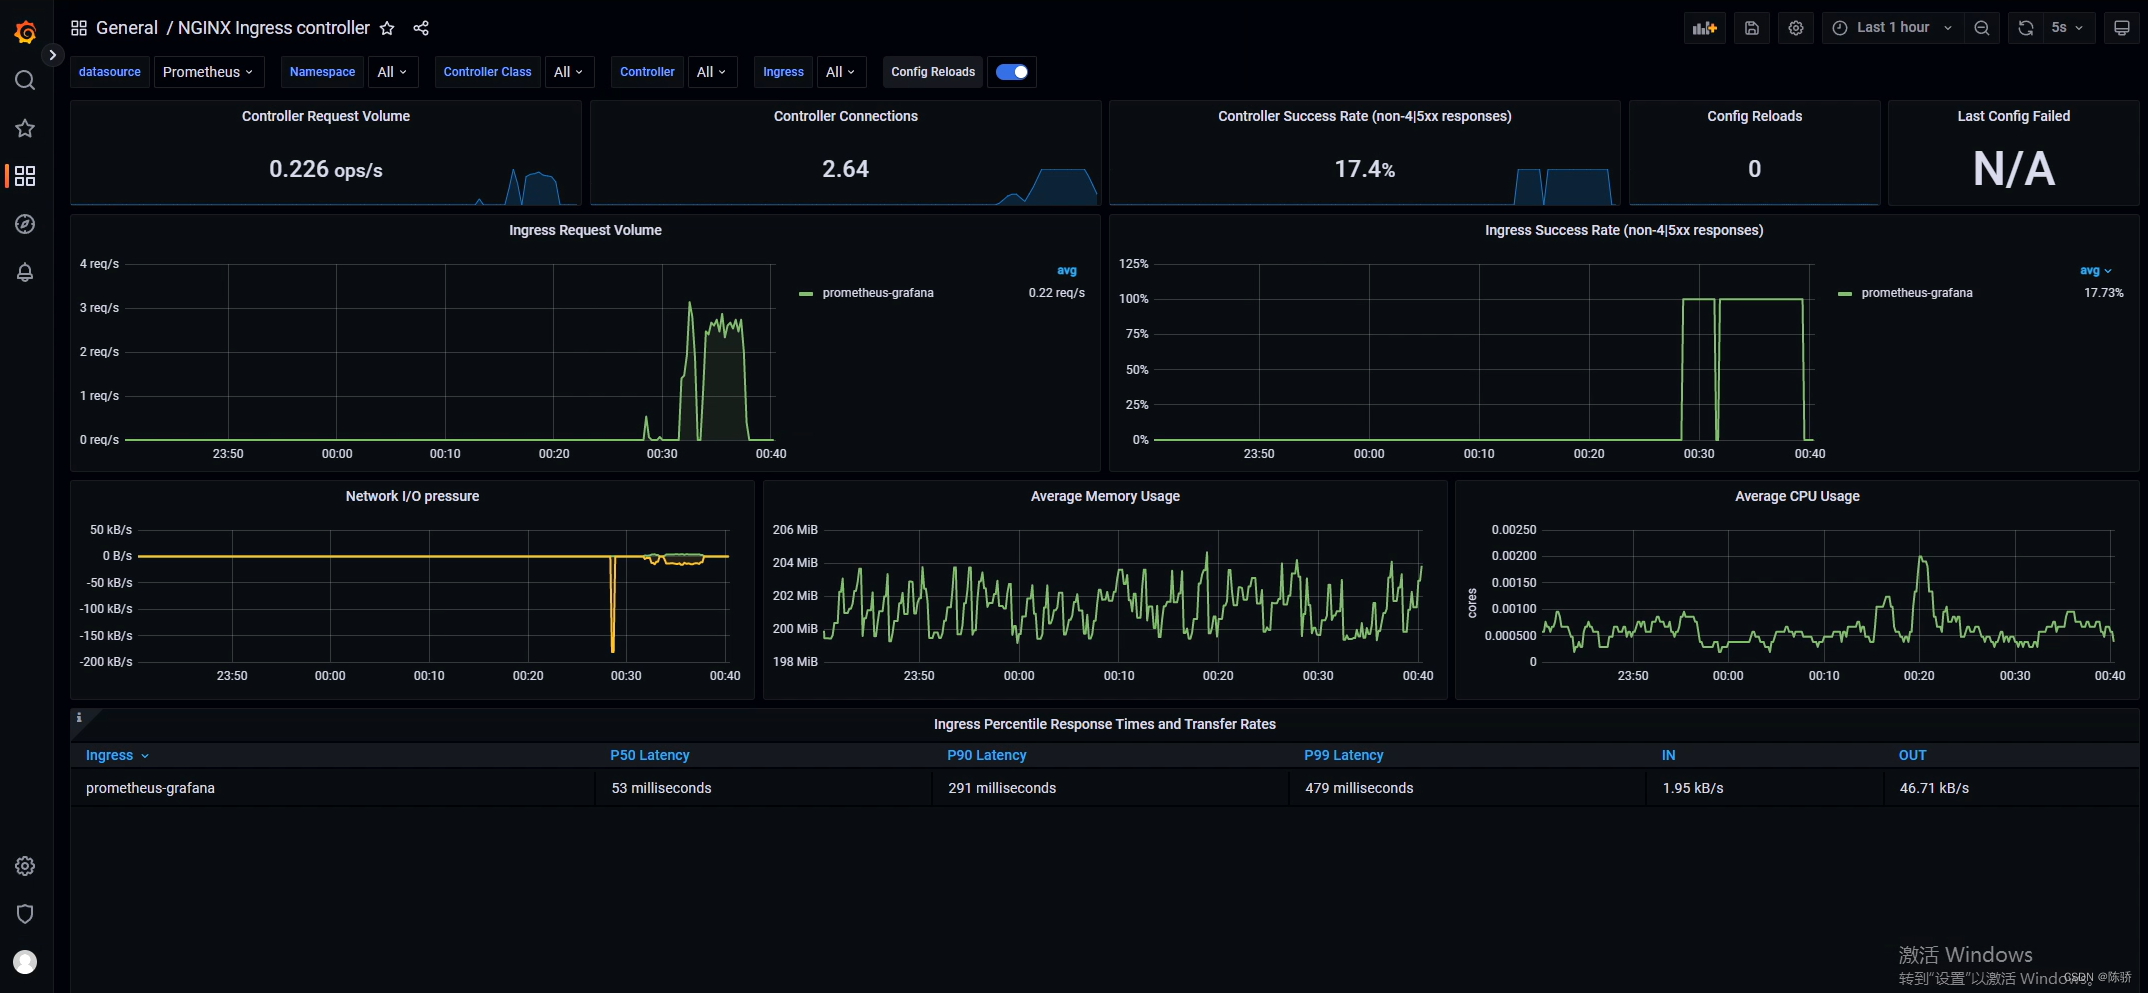
k8s信息监控
这个dashboard导入的是13105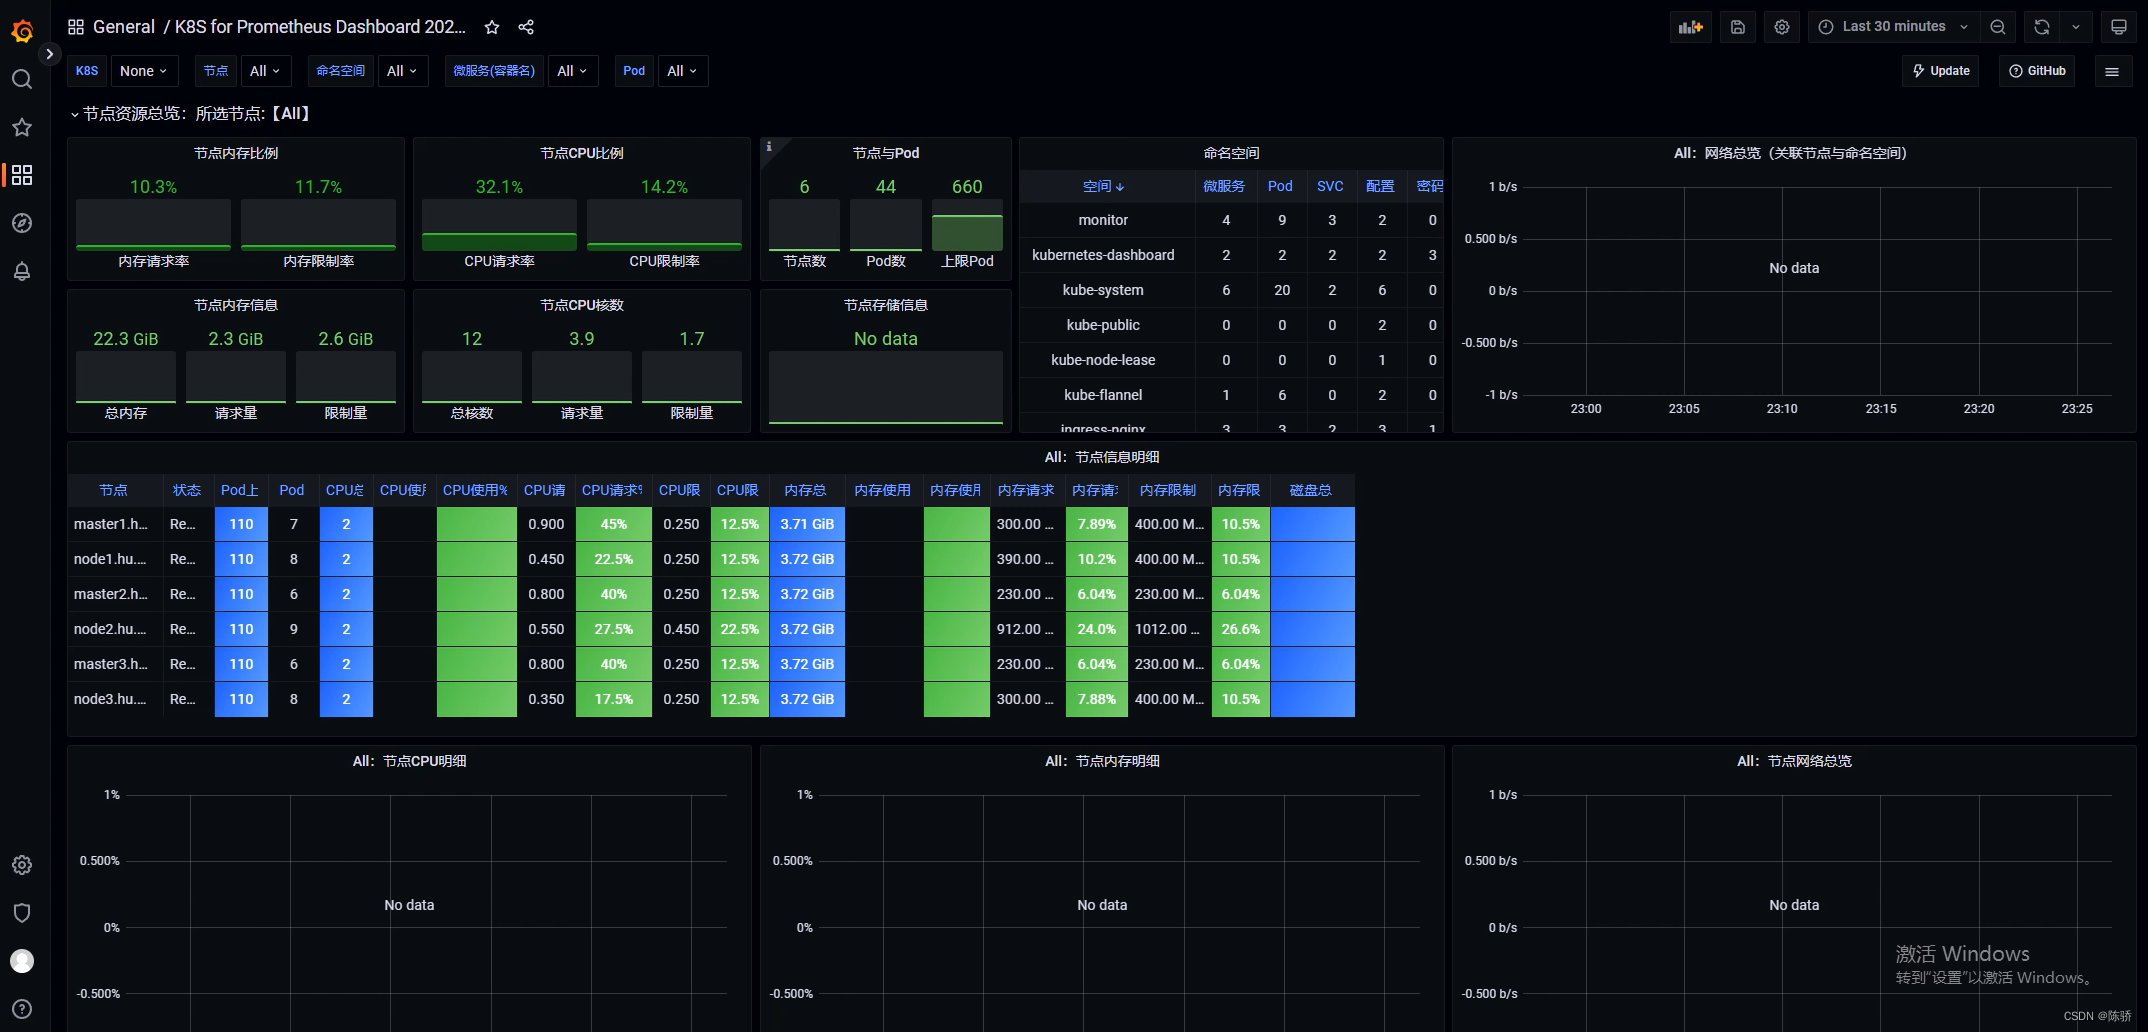
标签:
kubernetes
prometheus
本文转载自: https://blog.csdn.net/weixin_67405599/article/details/127674731
版权归原作者 陈骄 所有, 如有侵权,请联系我们删除。
版权归原作者 陈骄 所有, 如有侵权,请联系我们删除。