
深度学习通常被认为是一种黑盒技术,因为通常无法分析它在后端是如何工作的。例如创建了一个深层神经网络,然后将它与你的数据相匹配,我们知道它会使用不同层次的神经元和所有的激活等其他重要的超参数来进行训练。但是我们无法想象信息是如何被传递的或者模型是如何学习的。
如果有一个python包可以创建模型在每个迭代/轮次中如何工作或学习的可视化。您可以将这种可视化用于教育目的,也可以将其展示给其他人,向他们展示模型是如何学习的,首先我们展示下结果,如果你对创建这样的可视化感兴趣那么请往下阅读。
Deep Replay一个开放源代码的python包,设计用于让您可视化再现如何在Keras中执行模型训练过程。
设置Colab
对于本文,我们将使用谷歌colab,复制并运行下面给出的代码,以便准备好你的notebook。
 # To run this notebook on Google Colab, you need to run these two commands first
 # to install FFMPEG (to generate animations - it may take a while to install!)
 # and the actual DeepReplay package

 !apt-get install ffmpeg
 !pip install deepreplay
这个命令也将安装我们需要的库,即deepreplay。
导入库
因为我们正在创建一个深度神经网络,所以我们需要导入所需的库。
 from keras.layers import Dense
 from keras.models import Sequential
 from keras.optimizers import SGD
 from keras.initializers import glorot_normal, normal

 from deepreplay.callbacks import ReplayData
 from deepreplay.replay import Replay
 from deepreplay.plot import compose_animations, compose_plots

 import matplotlib.pyplot as plt
 from IPython.display import HTML
 from sklearn.datasets import make_moons%matplotlib inline
加载数据和创建回调
在这一步中,我们将加载将要处理的数据,并为可视化的回放创建一个回调。
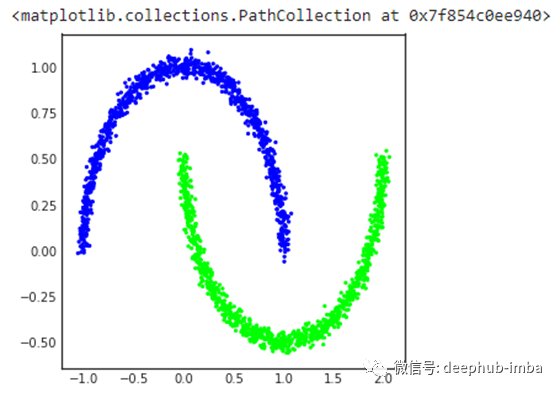
 group_name = 'moons'
 X, y = make_moons(n_samples=2000, random_state=27, noise=0.03)
 replaydata = ReplayData(X, y, filename='moons_dataset.h5', group_name=group_name)
 fig, ax = plt.subplots(1, 1, figsize=(5, 5))
 ax.scatter(*X.transpose(), c=y, cmap=plt.cm.brg, s=5)
创建Keras模型
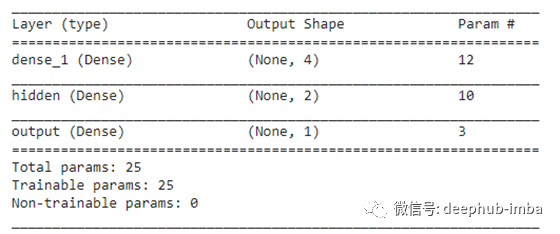
现在,我们将使用不同的层、激活和所有其他超参数创建Keras模型。同时,我们将打印模型的摘要。
 sgd = SGD(lr=0.01)

 glorot_initializer = glorot_normal(seed=42)
 normal_initializer = normal(seed=42)

 model = Sequential()

 model.add(Dense(input_dim=2,
                 units=4,
                 kernel_initializer=glorot_initializer,
                 activation='tanh'))
 model.add(Dense(units=2,
                 kernel_initializer=glorot_initializer,
                 activation='tanh',
                 name='hidden'))
 model.add(Dense(units=1,
                 kernel_initializer=normal_initializer,
                 activation='sigmoid',
                 name='output'))
 model.compile(loss='binary_crossentropy',
               optimizer=sgd,
               metrics=['acc'])

 model.summary()
现在让我们训练模型
在训练模型时,我们将回调传递给fit命令。
model.fit(X, y, epochs=200, batch_size=16, callbacks=[replaydata])
绘图
现在我们将创建一些空的图,我们将在其上绘制与模型学习相关的数据。
 fig = plt.figure(figsize=(12, 6))
 ax_fs = plt.subplot2grid((2, 4), (0, 0), colspan=2, rowspan=2)
 ax_ph_neg = plt.subplot2grid((2, 4), (0, 2))
 ax_ph_pos = plt.subplot2grid((2, 4), (1, 2))
 ax_lm = plt.subplot2grid((2, 4), (0, 3))
 ax_lh = plt.subplot2grid((2, 4), (1, 3))
在下一步中,我们只需要将数据传递到这些图中,并创建所有迭代的视频。视频将包含每个轮次的学习过程。
 replay = Replay(replay_filename='moons_dataset.h5', group_name=group_name)
 fs = replay.build_feature_space(ax_fs, layer_name='hidden',
                                 xlim=(-1, 2), ylim=(-.5, 1),
                                 display_grid=False)
 ph = replay.build_probability_histogram(ax_ph_neg, ax_ph_pos)
 lh = replay.build_loss_histogram(ax_lh)
 lm = replay.build_loss_and_metric(ax_lm, 'acc')
创建一个示例图
 sample_figure = compose_plots([fs, ph, lm, lh], 160)
 sample_figure
创建视频
 sample_anim = compose_animations([fs, ph, lm, lh])
 HTML(sample_anim.to_html5_video()
最终的结果就像我们上面展示的那样。
作者:Himanshu Sharma
原文地址:https://towardsdatascience.com/visualizing-learning-of-a-deep-neural-network-b05f1711651c
deephub翻译组