
简介
本实验适用于 openGauss数据库,通过该实验可以顺利完成对数据库各项日常基本维护管理。主要内容为操作系统参数检查、openGauss健康状态检查、数据库性能检查、日志检查和清理、时间一致性检查、应用连接数检查、例行维护表等。
前置条件
- 由于本实验主要是在openEuler操作系统上进行数据库维护管理,需要掌握Linux系统的基本操作和系统命令,详细请参见附录一。
- 数据库维护管理尤其是例行表、索引的维护需要掌握openGauss数据库的基本操作和SQL语法,openGauss数据库支持SQL2003标准语法,数据库基本操作参见附录二。
实验环境说明
组网说明:本实验环境为华为云 ECS 服务器 + openGauss数据库。
设备介绍:为了满足数据库原理与实践课程实验需要,建议每套实验环境采用以下配置:
设备名称设备型号软件版本数据库openGaussopenGauss 1.1.0操作系统openEuleropenEuler 20.3LTS
实验概览: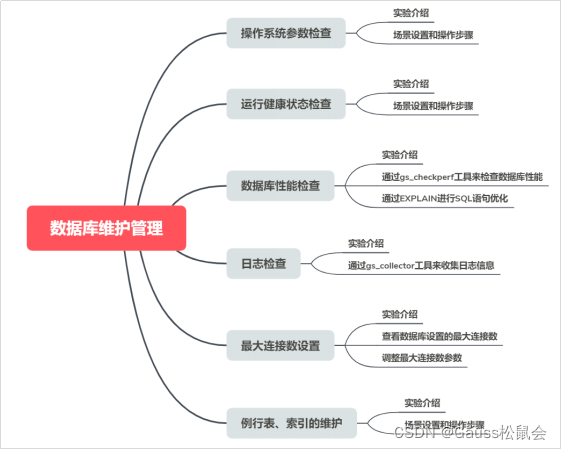
1.操作系统参数检查
1.1 实验介绍
1.1.1 关于本实验
gs_checkos工具用来帮助检查操作系统、控制参数、磁盘配置等内容,并对系统控制参数、I/O配置、网络配置和THP服务等信息进行配置。
本实验主要是通过gs_checkos工具来检查操作系统参数设置是否合理。先进行场景设置,然后根据检查结果进行参数调整。
1.1.2 实验目的
掌握gs_checkos工具的基本使用;
1.2 场景设置及操作步骤
步骤 1用root用户登录装有openGauss数据库服务的操作系统,登录后信息如下:
Welcome to 4.19.90-2003.4.0.0036.oe1.aarch64
System information as of time:     Mon Jul 2016:41:11 CST 2020
System load:     0.00
Processes:     113
Memory used:     7.0%
Swap used:     0.0%
Usage On:     15%
IP address:     192.168.0.96
Users online:     2[root@ecs-e1b3 ~]#
步骤 2在root用户下执行gs_checkos先对系统参数进行检查。
[root@ecs-e1b3 ~]# gs_checkos -i A
Checking items:
    A1. [ OS version status ]: Normal
    A2. [ Kernel version status ]: Normal
    A3. [ Unicode status ]: Normal
    A4. [ Time zone status ]: Normal
    A5. [ Swap memory status ]: Normal
    A6. [ System control parameters status ]: Warning
    A7. [ File system configuration status ]: Normal
    A8. [ Disk configuration status ]: Normal
    A9. [ Pre-read block size status ]: Normal
    A10.[ IO scheduler status ]: Normal
BondMode Null
    A11.[ Network card configuration status ]: Warning
    A12.[ Time consistency status ]: Warning
    A13.[ Firewall service status ]: Normal
    A14.[ THP service status ]: Normal
Total numbers:14. Abnormal numbers:0. Warning numbers:3.
说明事项:
Normal 为正常项,Abnormal为必须处理项,Warning可以不处理。
Total numbers:14. Abnormal numbers:0. Warning numbers:3。
表示:总共检查14项,其中Abnormal必须处理项为0,Warning告警项为3。
步骤 3调整系统参数值。
在参数配置文件(/etc/sysctl.conf)中将参数 vm.min_free_kbytes(表示:内核内存分配保留的内存量) 的值调整为3488。输入“i”进入INSERT模式,进行修改。
[root@ecs-e1b3 ~]# vi /etc/sysctl.conf
net.ipv4.conf.default.accept_redirects=0
net.ipv4.conf.all.secure_redirects=0
net.ipv4.conf.default.secure_redirects=0
net.ipv4.icmp_echo_ignore_broadcasts=1
net.ipv4.icmp_ignore_bogus_error_responses=1
………......
net.ipv4.tcp_rmem =819225000016777216
net.ipv4.tcp_wmem =819225000016777216
vm.min_free_kbytes =3488
net.core.netdev_max_backlog =65535
net.ipv4.tcp_max_syn_backlog =65535
net.core.somaxconn =65535
参数值修改好后,按” ESC”键退出编辑模式,然后输入 :wq 后回车进行保存。接着通过执行sysctl -p 命令使刚才修改的参数生效,具体如下:
[root@ecs-e1b3 ~]# sysctl -p
kernel.sysrq =0
net.ipv4.ip_forward =0
net.ipv4.conf.all.send_redirects =0
net.ipv4.conf.default.send_redirects =0
net.ipv4.conf.all.accept_source_route =0
net.ipv4.conf.default.accept_source_route =0
net.ipv4.conf.all.accept_redirects =0
net.ipv4.conf.default.accept_redirects =0
…………..
net.core.rmem_default =21299200
net.sctp.sctp_mem =94500000915000000927000000
net.sctp.sctp_rmem =819225000016777216
net.sctp.sctp_wmem =819225000016777216
kernel.sem =2506400000100025600
net.ipv4.tcp_rmem =819225000016777216
net.ipv4.tcp_wmem =819225000016777216
vm.min_free_kbytes =3488
net.core.netdev_max_backlog =65535
net.ipv4.tcp_max_syn_backlog =65535
net.core.somaxconn =65535
kernel.shmall =1152921504606846720
kernel.shmmax =18446744073709551615
步骤 4再执行gs_checkos 对系统参数进行检查。
[root@ecs-e1b3 ~]# gs_checkos -i A
Checking items:
    A1. [ OS version status ]: Normal
    A2. [ Kernel version status ]: Normal
    A3. [ Unicode status ]: Normal
    A4. [ Time zone status ]: Normal
    A5. [ Swap memory status ]: Normal
    A6. [ System control parameters status ]: Abnormal
    A7. [ File system configuration status ]: Normal
    A8. [ Disk configuration status ]: Normal
    A9. [ Pre-read block size status ]: Normal
    A10.[ IO scheduler status ]: Normal
BondMode Null
    A11.[ Network card configuration status ]: Warning
    A12.[ Time consistency status ]: Warning
    A13.[ Firewall service status ]: Normal
    A14.[ THP service status ]: Normal
Total numbers:14. Abnormal numbers:1. Warning numbers:2.
Do checking operation finished. Result: Abnormal.
此时A6. [ System control parameters status ] 的状态为Abnormal为必须处理项;
Total numbers:14. Abnormal numbers:1. Warning numbers:2。
表示:总共检查14项,其中Abnormal必须处理项为1,Warning告警项为2。
步骤 5通过执行gs_checkos -i A --detail 查看更详细的信息。
[root@ecs-e1b3 ~]# gs_checkos -i A --detail
Checking items:
    A1. [ OS version status ]: Normal
        [ecs-e1b3]
        openEuler_20.03_64bit
     A2. [ Kernel version status ]: Normal
        The names about all kernel versions are same. The value is "4.19.90-2003.4.0.0036.oe1.aarch64".
    A3. [ Unicode status ]: Normal
        The values of all unicode are same. The value is "LANG=en_US.UTF-8".
    A4. [ Time zone status ]: Normal
        The informations about all timezones are same. The value is "+0800".
    A5. [ Swap memory status ]: Normal
        The value about swap memory is correct.
    A6. [ System control parameters status ]: Abnormal
        [ecs-e1b3]
        Abnormal reason: variable 'vm.min_free_kbytes' RealValue '3488' ExpectedValue '348844'.
        Warning reason: variable 'net.ipv4.tcp_retries1' RealValue '3' ExpectedValue '5'.
        Warning reason: variable 'net.ipv4.tcp_syn_retries' RealValue '6' ExpectedValue '5'.
        Warning reason: variable 'net.sctp.path_max_retrans' RealValue '5' ExpectedValue '10'.
        Warning reason: variable 'net.sctp.max_init_retransmits' RealValue '8' ExpectedValue '10'.
        Check_SysCtl_Parameter failed.
    A7. [ File system configuration status ]: Normal
        Both soft nofile and hard nofile are correct.
    A8. [ Disk configuration status ]: Normal
        The value about XFS mount parameters is correct.
    A9. [ Pre-read block size status ]: Normal
        The value about Logical block size is correct.
    A10.[ IO scheduler status ]: Normal
        The value of IO scheduler is correct.
BondMode Null
    A11.[ Network card configuration status ]: Warning
        [ecs-e1b3]
BondMode Null
        Warning reason: Failed to obtain the network card speed value. Maybe the network card "eth0" is not working.
    A12.[ Time consistency status ]: Warning
        [ecs-e1b3]
        The NTPD not detected on machine and localtime is "2020-07-20 17:16:41".
    A13.[ Firewall service status ]: Normal
        The firewall service is stopped.
    A14.[ THP service status ]: Normal
        The THP service is stopped.
Total numbers:14. Abnormal numbers:1. Warning numbers:2.
Do checking operation finished. Result: Abnormal.
在详细信息中,可以明确看出那些参数设置有问题,并给出了问题参数要求修改的参考值,如下:
A6. [ System control parameters status ] : Abnormal
[ecs-e1b3]
Abnormal reason: variable ‘vm.min_free_kbytes’ RealValue ‘3488’ ExpectedValue ‘348844’.
Warning reason: variable ‘net.ipv4.tcp_retries1’ RealValue ‘3’ ExpectedValue ‘5’.
Warning reason: variable ‘net.ipv4.tcp_syn_retries’ RealValue ‘6’ ExpectedValue ‘5’.
Warning reason: variable ‘net.sctp.path_max_retrans’ RealValue ‘5’ ExpectedValue ‘10’.
Warning reason: variable ‘net.sctp.max_init_retransmits’ RealValue ‘8’ ExpectedValue ‘10’.
Check_SysCtl_Parameter failed.
步骤 6按详细信息中的修改说明对系统参数进行修改。
vm.min_free_kbytes的值由3488调整为348844
net.ipv4.tcp_retries1的值由3调整为5.
net.ipv4.tcp_syn_retries的值由6调整为5.
net.sctp.path_max_retrans的值由5调整为10
net.sctp.max_init_retransmits的值由8调整为10
具体设置如下:
vm.min_free_kbytes = 348844
net.ipv4.tcp_retries1 = 5
net.ipv4.tcp_syn_retries = 5
net.sctp.path_max_retrans = 10
net.sctp.max_init_retransmits = 10
在系统参数文件中进行修改(输入“i”进入INSERT模式,进行修改。):
[root@ecs-e1b3 ~]# vi /etc/sysctl.conf# sysctl settings are defined through files in# /usr/lib/sysctl.d/, /run/sysctl.d/, and /etc/sysctl.d/.## Vendors settings live in /usr/lib/sysctl.d/.# To override a whole file, create a new file with the same in# /etc/sysctl.d/ and put new settings there. To override# only specific settings, add a file with a lexically later# name in /etc/sysctl.d/ and put new settings there.## For more information, see sysctl.conf(5) and sysctl.d(5).
kernel.sysrq=0
net.ipv4.ip_forward=0
net.ipv4.conf.all.send_redirects=0
net.ipv4.conf.default.send_redirects=0
net.ipv4.conf.all.accept_source_route=0
net.ipv4.conf.default.accept_source_route=0
net.ipv4.conf.all.accept_redirects=0# /etc/sysctl.d/ and put new settings there. To override# only specific settings, add a file with a lexically later# name in /etc/sysctl.d/ and put new settings there.## For more information, see sysctl.conf(5) and sysctl.d(5).
kernel.sysrq=0
net.ipv4.ip_forward=0
net.ipv4.conf.all.send_redirects=0
net.ipv4.conf.default.send_redirects=0
net.ipv4.conf.all.accept_source_route=0# /etc/sysctl.d/ and put new settings there. To override# only specific settings, add a file with a lexically later# name in /etc/sysctl.d/ and put new settings there.## For more information, see sysctl.conf(5) and sysctl.d(5).
kernel.sysrq=0
net.ipv4.ip_forward=0
net.ipv4.conf.all.send_redirects=0
net.ipv4.conf.default.send_redirects=0
net.ipv4.conf.all.accept_source_route=0
net.ipv4.conf.default.accept_source_route=0
…………..
net.sctp.sctp_rmem =819225000016777216
net.sctp.sctp_wmem =819225000016777216
kernel.sem =2506400000100025600
net.ipv4.tcp_rmem =819225000016777216
net.ipv4.tcp_wmem =819225000016777216
vm.min_free_kbytes =348844
net.core.netdev_max_backlog =65535
net.ipv4.tcp_max_syn_backlog =65535
net.core.somaxconn =65535
kernel.shmall =1152921504606846720
kernel.shmmax =18446744073709551615
net.ipv4.tcp_retries1 =5
net.ipv4.tcp_syn_retries =5
net.sctp.path_max_retrans =10
net.sctp.max_init_retransmits =10
参数值修改好后,按”ESC”键退出编辑模式,然后输入:wq 后回车进行保存。接着通过执行sysctl -p 命令使刚才修改的参数生效,具体如下:
[root@ecs-e1b3 ~]# sysctl -p
kernel.sysrq =0
net.ipv4.ip_forward =0
net.ipv4.conf.all.send_redirects =0
net.ipv4.conf.default.send_redirects =0
net.ipv4.conf.all.accept_source_route =0
net.ipv4.conf.default.accept_source_route =0
net.ipv4.conf.all.accept_redirects =0
net.ipv4.conf.default.accept_redirects =0
net.ipv4.conf.all.secure_redirects =0
net.ipv4.conf.default.secure_redirects =0
net.ipv4.icmp_echo_ignore_broadcasts =1
net.ipv4.icmp_ignore_bogus_error_responses =1
net.ipv4.conf.all.rp_filter =1
net.ipv4.conf.default.rp_filter =1
net.ipv4.tcp_syncookies =1
kernel.dmesg_restrict =1
net.ipv6.conf.all.accept_redirects =0
net.ipv6.conf.default.accept_redirects =0
vm.swappiness =0
net.ipv4.tcp_max_tw_buckets =10000
net.ipv4.tcp_tw_reuse =1
…………….
net.ipv4.tcp_rmem =819225000016777216
net.ipv4.tcp_wmem =819225000016777216
vm.min_free_kbytes =348844
net.core.netdev_max_backlog =65535
net.ipv4.tcp_max_syn_backlog =65535
net.core.somaxconn =65535
kernel.shmall =1152921504606846720
kernel.shmmax =18446744073709551615
net.ipv4.tcp_retries1 =5
net.ipv4.tcp_syn_retries =5
net.sctp.path_max_retrans =10
net.sctp.max_init_retransmits =10
步骤 7再次通过执行gs_checkos -i A 查看系统参数检查是否能通过。
[root@ecs-e1b3 ~]# gs_checkos -i A
Checking items:
    A1. [ OS version status ]: Normal
    A2. [ Kernel version status ]: Normal
    A3. [ Unicode status ]: Normal
    A4. [ Time zone status ]: Normal
    A5. [ Swap memory status ]: Normal
    A6. [ System control parameters status ]: Normal
    A7. [ File system configuration status ]: Normal
    A8. [ Disk configuration status ]: Normal
    A9. [ Pre-read block size status ]: Normal
    A10.[ IO scheduler status ]: Normal
BondMode Null
    A11.[ Network card configuration status ]: Warning
    A12.[ Time consistency status ]: Warning
    A13.[ Firewall service status ]: Normal
    A14.[ THP service status ]: Normal
Total numbers:14. Abnormal numbers:0. Warning numbers:2.
从检查结果可以看出,系统参数检查已经通过。其中A6. [ System control parameters status ]的状态由原来的Abnormal变为了Normal。
操作系统参数检查实验结束。
2.openGauss运行健康状态检查
2.1 实验介绍
2.1.1 关于本实验
gs_check能够帮助用户在openGauss运行过程中,全量的检查openGauss运行环境,操作系统环境,网络环境及数据库执行环境,也有助于在openGauss重大操作之前对各类环境进行全面检查,有效保证操作执行成功。
本实验主要是通过gs_check工具来检查openGauss数据库运行状态。先进行场景设置,然后根据检查结果进行数据库调整。
语法如下:
- 单项检查:
gs_check -i ITEM [...][-U USER][-L][-l LOGFILE][-o OUTPUTDIR][--skip-root-items][--set][--routing]
- 场景检查:
gs_check -e SCENE_NAME [-U USER][-L][-l LOGFILE][-o OUTPUTDIR][--hosts][--skip-root-items][--time-out=SECS][--set][--routing][--skip-items]
场景检查项。默认的场景有inspect(例行巡检)、upgrade(升级前巡检)、binary_upgrade(就地升级前巡检)、health(健康检查巡检)、install(安装),等,用户可以根据需求自己编写场景。
- 显示帮助信息。
gs_check -? | --help
2.1.2 实验目的
掌握gs_check工具的基本使用;
2.2 场景设置及操作步骤
步骤 1用root用户登录装有openGauss数据库服务的操作系统然后用 su - omm命令切换至omm用户环境,登录后信息如下。
Welcome to 4.19.90-2003.4.0.0036.oe1.aarch64
System information as of time:     Tue Jul 21 09:21:11 CST 2020
System load:     0.01
Processes:     109
Memory used:     6.7%
Swap used:     0.0%
Usage On:     15%
IP address:     192.168.0.96
Users online:     1[root@ecs-e1b3 ~]# su - omm
Last login: Fri Jul 1019:05:39 CST 2020 on pts/0
Welcome to 4.19.90-2003.4.0.0036.oe1.aarch64
System information as of time:     Tue Jul 21 09:21:25 CST 2020
System load:     0.01
Processes:     111
Memory used:     7.0%
Swap used:     0.0%
Usage On:     15%
IP address:     192.168.0.96
Users online:     1[omm@ecs-e1b3 ~]$
步骤 2确认openGauss数据库服务是否启动。
[omm@ecs-e1b3 ~]$ gs_om -t status;
----------------------------------------------------------------------
cluster_state   : Normal
redistributing  : No
----------------------------------------------------------------------
cluster_state : Normal 表示已启动,可以正常使用。如果状态为非Normal表示不可用
为了实验场景设置,如果数据库服务已经启动,请执行步骤3先关闭服务。
步骤 3关闭openGauss数据库服务。
[omm@ecs-e1b3 ~]$ gs_om -t stop;
Stopping cluster.
=========================================
Successfully stopped cluster.
=========================================
End stop cluster.
步骤 4检查openGauss实例连接。
[omm@ecs-e1b3 ~]$ gs_check -i CheckDBConnection
Parsing the check items config file successfully
Distribute the context file to remote hosts successfully
Start to health check for the cluster. Total Items:1 Nodes:1

Checking...               [=========================]1/1
Start to analysis the check result
CheckDBConnection...........................NG
The item run on 1 nodes.  ng: 1
The ng[ecs-e1b3] value:
The database can not be connected.

Analysis the check result successfully
Failed.    All check items run completed. Total:1     NG:1
For more information please refer to /opt/huawei/wisequery/script/gspylib/inspection/output/CheckReport_2020072139449163171.tar.gz
说明:
CheckDBConnection…NG 表示连接检查项无用;
The database can not be connected. 表示实例不能连接;
Failed. All check items run completed. Total:1 NG:1 表示共检查1项并且检查结果未通过。
步骤 5启动openGauss数据库服务。
[omm@ecs-e1b3 ~]$ gs_om -t start;
Starting cluster.
==================================================================================
Successfully started.
[omm@ecs-e1b3 ~]$
步骤 6确认openGauss数据库服务已启动。
[omm@ecs-e1b3 ~]$ gs_om -t status;
----------------------------------------------------------------------
cluster_state   : Normal
redistributing  : No
----------------------------------------------------------------------
[omm@ecs-e1b3 ~]$
步骤 7再次检查openGauss实例连接。
[omm@ecs-e1b3 ~]$ gs_check -i CheckDBConnection
Parsing the check items config file successfully
Distribute the context file to remote hosts successfully
Start to health check for the cluster. Total Items:1 Nodes:1

Checking...               [=========================]1/1
Start to analysis the check result
CheckDBConnection...........................OK
The item run on 1 nodes.  success: 1

Analysis the check result successfully
Success.    All check items run completed. Total:1   Success:1
For more information please refer to /opt/huawei/wisequery/script/gspylib/inspection/output/CheckReport_2020072140672174672.tar.gz
说明:
CheckDBConnection…OK 表示连接检查项正常;
Success. All check items run completed. Total:1 Success:1 表示共检查1项并且检查结果成功。
openGauss数据库运行健康状态检查实验结束。
3.数据库性能检查
3.1 实验介绍
3.1.1 关于本实验
openGauss 不仅提供了gs_checkperf工具来帮助用户了解openGauss的负载情况。
本实验主要是通过gs_checkperf工具来检查openGauss数据库性能以及通过EXPLAIN来进行SQL语句优化。
3.1.2 实验目的
掌握gs_checkperf工具的基本使用;
3.2 通过gs_checkperf工具来检查数据库性能
说明:
gs_checkperf可以对以下级别进行检查:
- openGauss级别(主机CPU占用率、Gauss CPU占用率、I/O使用情况等)
- 节点级别(CPU使用情况、内存使用情况、I/O使用情况)
- 会话/进程级别(CPU使用情况、内存使用情况、I/O使用情况)
- SSD性能(写入、读取性能)
其中检查SSD性能要用root用户执行,检查openGauss性能要用openGauss安装用户执行
本实验为检查openGauss性能。
步骤 1用root用户登录装有openGauss数据库服务的操作系统然后用 su - omm命令切换至omm用户环境,登录后信息如下。
Welcome to 4.19.90-2003.4.0.0036.oe1.aarch64
System information as of time:     Tue Jul 21 09:21:11 CST 2020
System load:     0.01
Processes:     109
Memory used:     6.7%
Swap used:     0.0%
Usage On:     15%
IP address:     192.168.0.96
Users online:     1[root@ecs-e1b3 ~]# su - omm
Last login: Fri Jul 1019:05:39 CST 2020 on pts/0
Welcome to 4.19.90-2003.4.0.0036.oe1.aarch64
System information as of time:     Tue Jul 21 09:21:25 CST 2020
System load:     0.01
Processes:     111
Memory used:     7.0%
Swap used:     0.0%
Usage On:     15%
IP address:     192.168.0.96
Users online:     1[omm@ecs-e1b3 ~]$
步骤 2先启动数据库服务,再用gs_checkperf检查下,再使用gsql客户端以管理员用户身份连接postgres数据库,假设端口号为26000。
先启动数据库服务。
[omm@ecs-e1b3 ~]$ gs_om -t start;
Starting cluster.
==================================================================================
Successfully started.
用gs_checkperf检查下。
[omm@ecs-e1b3 ~]$ gs_checkperf
Cluster statistics information:
    Host CPU busy time ratio                     :    .72        %
    MPPDB CPU time % in busy time:    .33        %
    Shared Buffer Hit ratio                      :97.33      %
    In-memory sort ratio                         :0
    Physical Reads                               :466
    Physical Writes                              :175
    DB size                                      :47         MB
    Total Physical writes                        :175
    Active SQL count                             :3
Session count                                :4
确认openGauss数据库服务是否正常。
[omm@ecs-e1b3 ~]$ gs_om -t status;
----------------------------------------------------------------------
cluster_state   : Unavailable
redistributing  : No
----------------------------------------------------------------------
cluster_state : Normal 表示已启动,可以正常使用。如果状态为Unavailable表示不可用
为了实验继续进行,请先启动数据库服务。
启动数据库服务(如果数据库服务是正常的,此步骤可以不执行)。
[omm@ecs-e1b3 ~]$ gs_om -t start;
Starting cluster.
==================================================================================
Successfully started.
然后连接postgres数据库。
[omm@ecs-e1b3 ~]$ gsql -d postgres -p 26000 -r
gsql ((openGauss 1.1.0 build 38a9312a) compiled at 2020-05-27 14:57:08 commit 472 last mr 549)
Non-SSL connection (SSL connection is recommended when requiring high-security)
Type "help"for help.

postgres=#
步骤 3对PMK模式下的表进行统计信息收集。
postgres=# analyze pmk.pmk_configuration; ANALYZE
postgres=# analyze pmk.pmk_meta_data;ANALYZE
postgres=# analyze pmk.pmk_snapshot;ANALYZE
postgres=# analyze pmk.pmk_snapshot_datanode_stat;ANALYZE
postgres=#
说明:
gs_checkperf工具的监控信息依赖于pmk模式下的表的数据,如果pmk模式下的表未执行analyze操作,则可能导致gs_checkperf工具执行失败。
步骤 4执行简要性能检查。
用 \q 先退出postgres数据库,然后在操作系统用户 omm 环境下去执行gs_checkperf检查工具,具体如下:
postgres=# postgres=# \q[omm@ecs-e1b3 ~]$ gs_checkperf
Cluster statistics information:
    Host CPU busy time ratio           :1.66      % -----主机CPU占用率
    MPPDB CPU time % in busy time:2.51      % ----Gauss CPU占用率
    Shared Buffer Hit ratio             :99.14    % ----共享内存命中率
    In-memory sort ratio                 :0            ---内存中排序比率
    Physical Reads                        :504           ---物理读次数
    Physical Writes                       :162           ---物理写次数
    DB size                                 :57         MB ---DB大小
    Total Physical writes               :162         ---总物理写次数
    Active SQL count                     :4             ---当前SQL执行数
    Session count                         :5             ---Session数量
步骤 5执行详细性能检查。
[omm@ecs-e1b3 ~]$ gs_checkperf --detail
Cluster statistics information:
Host CPU usage rate:
    Host total CPU time:45719980.000 Jiffies
    Host CPU busy time:761060.000 Jiffies
    Host CPU iowait time:6640.000   Jiffies
    Host CPU busy time ratio                     :1.66       %
    Host CPU iowait time ratio                   :    .01        %
MPPDB CPU usage rate:
    MPPDB CPU time % in busy time:5.12       %
    MPPDB CPU time % in total time:    .09        %
Shared buffer hit rate:
    Shared Buffer Reads                          :1057
    Shared Buffer Hits                           :139798
    Shared Buffer Hit ratio                      :99.25      %
In memory sort rate:
    In-memory sort count                         :0
    In-disk sort count                           :0
    In-memory sort ratio                         :0
I/O usage:
    Number of files                              :106
    Physical Reads                               :584
    Physical Writes                              :362
    Read Time                                    :5794       ms
    Write Time                                   :4046       ms
Disk usage:
    DB size                                      :57         MB
    Total Physical writes                        :362
    Average Physical write:89471.08
    Maximum Physical write:362
Activity statistics:
    Active SQL count                             :4
    Session count                                :5
Node statistics information:
dn_6001:
    MPPDB CPU Time                               :38960      Jiffies
    Host CPU Busy Time                           :761060     Jiffies
    Host CPU Total Time                          :45719980   Jiffies
    MPPDB CPU Time % in Busy Time                :5.12       %
    MPPDB CPU Time % in Total Time               :    .09        %
    Physical memory                              :7144341504 Bytes
    DB Memory usage                              :14922285056 Bytes
    Shared buffer size                           :1073741824 Bytes
    Shared buffer hit ratio                      :99.25      %
    Sorts in memory                              :0
    Sorts in disk                                :0
    In-memory sort ratio                         :0
    Number of files                              :106
    Physical Reads                               :584
    Physical Writes                              :362
    Read Time                                    :5794
    Write Time                                   :4046
Session statistics information(Top 10):
Session CPU statistics:
1 dn_6001-postgres-omm:
    Session CPU time:2
    Database CPU time:39020
    Session CPU time %                           :    .01        %
……………
Session Memory statistics:
1 dn_6001-postgres-omm:
    Buffer Reads                                 :1309
    Shared Buffer Hit ratio                      :93.03
    In Memory sorts                              :0
    In Disk sorts                                :0
    In Memory sorts ratio                        :0
    Total Memory Size                            :7433136
    Used Memory Size                             :6443268
………………..
Session IO statistics:
1 dn_6001-postgres-omm:
    Physical Reads                               :98
    Read Time                                    :10692 dn_6001-postgres-omm:
    Physical Reads                               :13
    Read Time                                    :173
……….........
[omm@ecs-e1b3 ~]$
gs_checkperf 检查实验结束。
3.3 通过EXPLAIN进行SQL语句优化
说明:
- 使用explain能显示SQL语句的执行计划;
- 执行计划将显示SQL语句所引用的表会采用什么样的扫描方式,如:简单的顺序扫描、索引扫描等。如果引用了多个表,执行计划还会显示用到的JOIN算法;
- 执行计划的最关键的部分是语句的预计执行开销,这是计划生成器估算执行该语句将花费多长的时间;
- 若指定了ANALYZE选项,则该语句模拟执行并形成最优的执行计划(并非真正执行),然后根据实际的运行结果显示统计数据,包括每个计划节点内时间总开销(毫秒为单位)和实际返回的总行数。这对于判断计划生成器的估计是否接近现实非常有用。
步骤 1用root用户登录装有openGauss数据库服务的操作系统然后用 su - omm命令切换至omm用户环境,登录后信息如下。
Welcome to 4.19.90-2003.4.0.0036.oe1.aarch64
System information as of time:     Tue Jul 21 09:21:11 CST 2020
System load:     0.01
Processes:     109
Memory used:     6.7%
Swap used:     0.0%
Usage On:     15%
IP address:     192.168.0.96
Users online:     1[root@ecs-e1b3 ~]# su - omm
Last login: Fri Jul 1019:05:39 CST 2020 on pts/0
Welcome to 4.19.90-2003.4.0.0036.oe1.aarch64
System information as of time:     Tue Jul 21 09:21:25 CST 2020
System load:     0.01
Processes:     111
Memory used:     7.0%
Swap used:     0.0%
Usage On:     15%
IP address:     192.168.0.96
Users online:     1[omm@ecs-e1b3 ~]$
步骤 2先启动数据库服务,然后使用gsql客户端以管理员用户身份连接postgres数据库,假设端口号为26000。
启动数据库服务。
[omm@ecs-e1b3 ~]$ gs_om -t start;
Starting cluster.
==================================================================================
Successfully started.
然后连接postgres数据库。
[omm@ecs-e1b3 ~]$ gsql -d postgres -p 26000 -r
gsql ((openGauss 1.1.0 build 38a9312a) compiled at 2020-05-27 14:56:08 commit 472 last mr 549)
Non-SSL connection (SSL connection is recommended when requiring high-security)
Type "help"for help.

postgres=#
步骤 3创建student表。
postgres=# CREATE TABLE student(       std_id INTNOTNULL,
         std_name VARCHAR(20)NOTNULL,
         std_sex VARCHAR(6),
         std_birth DATE,
         std_in DATENOTNULL,
         std_address VARCHAR(100));CREATETABLE
步骤 4表数据插入。
INSERTINTO student(std_id,std_name,std_sex,std_birth,std_in,std_address)VALUES(1,'张一','男','1993-01-01','2011-09-01','江苏省南京市雨花台区');INSERTINTO student(std_id,std_name,std_sex,std_birth,std_in,std_address)VALUES(2,'张二','男','1993-01-02','2011-09-01','江苏省南京市雨花台区');INSERTINTO student(std_id,std_name,std_sex,std_birth,std_in,std_address)VALUES(3,'张三','男','1993-01-03','2011-09-01','江苏省南京市雨花台区');INSERTINTO student(std_id,std_name,std_sex,std_birth,std_in,std_address)VALUES(4,'张四','男','1993-01-04','2011-09-01','江苏省南京市雨花台区');INSERTINTO student(std_id,std_name,std_sex,std_birth,std_in,std_address)VALUES(5,'张五','男','1993-01-05','2011-09-01','江苏省南京市雨花台区');INSERTINTO student(std_id,std_name,std_sex,std_birth,std_in,std_address)VALUES(6,'张六','男','1993-01-06','2011-09-01','江苏省南京市雨花台区');INSERTINTO student(std_id,std_name,std_sex,std_birth,std_in,std_address)VALUES(7,'张七','男','1993-01-07','2011-09-01','江苏省南京市雨花台区');INSERTINTO student(std_id,std_name,std_sex,std_birth,std_in,std_address)VALUES(8,'张八','男','1993-01-08','2011-09-01','江苏省南京市雨花台区');INSERTINTO student(std_id,std_name,std_sex,std_birth,std_in,std_address)VALUES(9,'张九','男','1993-01-09','2011-09-01','江苏省南京市雨花台区');INSERTINTO student(std_id,std_name,std_sex,std_birth,std_in,std_address)VALUES(10,'李一','男','1993-01-10','2011-09-01','江苏省南京市雨花台区');INSERTINTO student(std_id,std_name,std_sex,std_birth,std_in,std_address)VALUES(11,'李二','男','1993-01-11','2011-09-01','江苏省南京市雨花台区');INSERTINTO student(std_id,std_name,std_sex,std_birth,std_in,std_address)VALUES(12,'李三','男','1993-01-12','2011-09-01','江苏省南京市雨花台区');INSERTINTO student(std_id,std_name,std_sex,std_birth,std_in,std_address)VALUES(13,'李四','男','1993-01-13','2011-09-01','江苏省南京市雨花台区');INSERTINTO student(std_id,std_name,std_sex,std_birth,std_in,std_address)VALUES(14,'李五','男','1993-01-14','2011-09-01','江苏省南京市雨花台区');INSERTINTO student(std_id,std_name,std_sex,std_birth,std_in,std_address)VALUES(15,'李六','男','1993-01-15','2011-09-01','江苏省南京市雨花台区');INSERTINTO student(std_id,std_name,std_sex,std_birth,std_in,std_address)VALUES(16,'李七','男','1993-01-16','2011-09-01','江苏省南京市雨花台区');INSERTINTO student(std_id,std_name,std_sex,std_birth,std_in,std_address)VALUES(17,'李八','男','1993-01-17','2011-09-01','江苏省南京市雨花台区');INSERTINTO student(std_id,std_name,std_sex,std_birth,std_in,std_address)VALUES(18,'李九','男','1993-01-18','2011-09-01','江苏省南京市雨花台区');INSERTINTO student(std_id,std_name,std_sex,std_birth,std_in,std_address)VALUES(19,'王一','男','1993-01-19','2011-09-01','江苏省南京市雨花台区');INSERTINTO student(std_id,std_name,std_sex,std_birth,std_in,std_address)VALUES(20,'王二','男','1993-01-20','2011-09-01','江苏省南京市雨花台区');INSERTINTO student(std_id,std_name,std_sex,std_birth,std_in,std_address)VALUES(21,'王三','男','1993-01-21','2011-09-01','江苏省南京市雨花台区');INSERTINTO student(std_id,std_name,std_sex,std_birth,std_in,std_address)VALUES(22,'王四','男','1993-01-22','2011-09-01','江苏省南京市雨花台区');INSERTINTO student(std_id,std_name,std_sex,std_birth,std_in,std_address)VALUES(23,'王五','男','1993-01-23','2011-09-01','江苏省南京市雨花台区');INSERTINTO student(std_id,std_name,std_sex,std_birth,std_in,std_address)VALUES(24,'王六','男','1993-01-24','2011-09-01','江苏省南京市雨花台区');INSERTINTO student(std_id,std_name,std_sex,std_birth,std_in,std_address)VALUES(25,'王七','男','1993-01-25','2011-09-01','江苏省南京市雨花台区');INSERTINTO student(std_id,std_name,std_sex,std_birth,std_in,std_address)VALUES(26,'王八','男','1993-01-26','2011-09-01','江苏省南京市雨花台区');INSERTINTO student(std_id,std_name,std_sex,std_birth,std_in,std_address)VALUES(27,'王九','男','1993-01-27','2011-09-01','江苏省南京市雨花台区');INSERTINTO student(std_id,std_name,std_sex,std_birth,std_in,std_address)VALUES(28,'钱一','男','1993-01-28','2011-09-01','江苏省南京市雨花台区');INSERTINTO student(std_id,std_name,std_sex,std_birth,std_in,std_address)VALUES(29,'钱二','男','1993-01-29','2011-09-01','江苏省南京市雨花台区');INSERTINTO student(std_id,std_name,std_sex,std_birth,std_in,std_address)VALUES(30,'钱三','男','1993-01-30','2011-09-01','江苏省南京市雨花台区');INSERTINTO student(std_id,std_name,std_sex,std_birth,std_in,std_address)VALUES(31,'钱四','男','1993-02-01','2011-09-01','江苏省南京市雨花台区');INSERTINTO student(std_id,std_name,std_sex,std_birth,std_in,std_address)VALUES(32,'钱五','男','1993-02-02','2011-09-01','江苏省南京市雨花台区');INSERTINTO student(std_id,std_name,std_sex,std_birth,std_in,std_address)VALUES(33,'钱六','男','1993-02-03','2011-09-01','江苏省南京市雨花台区');INSERTINTO student(std_id,std_name,std_sex,std_birth,std_in,std_address)VALUES(34,'钱七','男','1993-02-04','2011-09-01','江苏省南京市雨花台区');INSERTINTO student(std_id,std_name,std_sex,std_birth,std_in,std_address)VALUES(35,'钱八','男','1993-02-05','2011-09-01','江苏省南京市雨花台区');INSERTINTO student(std_id,std_name,std_sex,std_birth,std_in,std_address)VALUES(36,'钱九','男','1993-02-06','2011-09-01','江苏省南京市雨花台区');INSERTINTO student(std_id,std_name,std_sex,std_birth,std_in,std_address)VALUES(37,'吴一','男','1993-02-07','2011-09-01','江苏省南京市雨花台区');INSERTINTO student(std_id,std_name,std_sex,std_birth,std_in,std_address)VALUES(38,'吴二','男','1993-02-08','2011-09-01','江苏省南京市雨花台区');INSERTINTO student(std_id,std_name,std_sex,std_birth,std_in,std_address)VALUES(39,'吴三','男','1993-02-09','2011-09-01','江苏省南京市雨花台区');INSERTINTO student(std_id,std_name,std_sex,std_birth,std_in,std_address)VALUES(40,'吴四','男','1993-02-10','2011-09-01','江苏省南京市雨花台区');INSERTINTO student(std_id,std_name,std_sex,std_birth,std_in,std_address)VALUES(41,'吴五','男','1993-02-11','2011-09-01','江苏省南京市雨花台区');INSERTINTO student(std_id,std_name,std_sex,std_birth,std_in,std_address)VALUES(42,'吴六','男','1993-02-12','2011-09-01','江苏省南京市雨花台区');INSERTINTO student(std_id,std_name,std_sex,std_birth,std_in,std_address)VALUES(43,'吴七','男','1993-02-13','2011-09-01','江苏省南京市雨花台区');INSERTINTO student(std_id,std_name,std_sex,std_birth,std_in,std_address)VALUES(44,'吴八','男','1993-02-14','2011-09-01','江苏省南京市雨花台区');INSERTINTO student(std_id,std_name,std_sex,std_birth,std_in,std_address)VALUES(45,'吴九','男','1993-02-15','2011-09-01','江苏省南京市雨花台区');INSERTINTO student(std_id,std_name,std_sex,std_birth,std_in,std_address)VALUES(46,'柳一','男','1993-02-16','2011-09-01','江苏省南京市雨花台区');INSERTINTO student(std_id,std_name,std_sex,std_birth,std_in,std_address)VALUES(47,'柳二','男','1993-02-17','2011-09-01','江苏省南京市雨花台区');INSERTINTO student(std_id,std_name,std_sex,std_birth,std_in,std_address)VALUES(48,'柳三','男','1993-02-18','2011-09-01','江苏省南京市雨花台区');INSERTINTO student(std_id,std_name,std_sex,std_birth,std_in,std_address)VALUES(49,'柳四','男','1993-02-19','2011-09-01','江苏省南京市雨花台区');INSERTINTO student(std_id,std_name,std_sex,std_birth,std_in,std_address)VALUES(50,'柳五','男','1993-02-20','2011-09-01','江苏省南京市雨花台区');
步骤 5数据查询统计。。
postgres=# select count(*) from student;
 count
-------50(1row)

postgres=# select * from student order by std_id;
 std_id | std_name | std_sex |      std_birth      |       std_in        |     std_address
--------+----------+---------+---------------------+---------------------+----------------------1| 张一     | 男      |1993-01-0100:00:00|2011-09-0100:00:00| 江苏省南京市雨花台区
      2| 张二     | 男      |1993-01-0200:00:00|2011-09-0100:00:00| 江苏省南京市雨花台区
      3| 张三     | 男      |1993-01-0300:00:00|2011-09-0100:00:00| 江苏省南京市雨花台区
      4| 张四     | 男      |1993-01-0400:00:00|2011-09-0100:00:00| 江苏省南京市雨花台区
……………..
步骤 6查看表信息。
postgres=# \d studentTable"public.student"Column|Type| Modifiers
-------------+--------------------------------+-----------
 std_id      |integer|notnull
 std_name    |charactervarying(20)|notnull
 std_sex     |charactervarying(6)|
 std_birth   |timestamp(0) without time zone |
 std_in      |timestamp(0) without time zone |notnull
 std_address |charactervarying(100)|
步骤 7收集表的统计信息。
postgres=# ANALYZE VERBOSE student;
INFO:  analyzing "public.student"(dn_6001 pid=48036)
INFO:  ANALYZE INFO : "student": scanned 1of1 pages, containing 50 live rowsand0 dead rows;50rowsin sample,50 estimated total rows(dn_6001 pid=48036)ANALYZE
使用ANALYZE VERBOSE语句更新统计信息,会同时输出表的相关信息。
步骤 8查看语句的执行计划。
postgres=# explain select * from student where std_id=30;
                       QUERY PLAN--------------------------------------------------------
 Seq Scan on student  (cost=0.00..1.62rows=1 width=62)
   Filter: (std_id =30)(2rows)
Seq Scan on student 表示使用的是全表扫描。
步骤 9给表添加主键。
postgres=# alter table student add primary key (std_id);
NOTICE:  ALTERTABLE/ADDPRIMARYKEY will create implicit index"student_pkey"fortable"student"ALTERTABLE
步骤 10再次查看表信息。
确定主键是否建好。
postgres=# \d studentTable"public.student"Column|Type| Modifiers
-------------+--------------------------------+-----------
 std_id      |integer|notnull
 std_name    |charactervarying(20)|notnull
 std_sex     |charactervarying(6)|
 std_birth   |timestamp(0) without time zone |
 std_in      |timestamp(0) without time zone |notnull
 std_address |charactervarying(100)|
Indexes:
    "student_pkey"PRIMARYKEY,btree(std_id)TABLESPACE pg_default
student_pkey 为主键名称。
步骤 11通过hint来优化语句扫描方式。
通过加hint来使查询语句进行索引扫描。
postgres=# explain select /*+indexscan(student student_pkey)*/ * from student where std_id=30;
                                 QUERY PLAN----------------------------------------------------------------------[Bypass]Index Scan using student_pkey on student  (cost=0.00..8.27rows=1 width=62)Index Cond: (std_id =30)(3rows)

postgres=#
Index Scan using student_pkey on student 表示语句通过student表上的主键索引student_pkey进行了索引扫描。
步骤 12退出数据库
postgres=# \q
EXPLAIN进行SQL优化实验结束。
下期我们继续介绍日志检查、最大连接数设置、表和索引的例行维护等。
版权归原作者 Gauss松鼠会 所有, 如有侵权,请联系我们删除。