
手把手教你绘制积分动图
创作背景
今天在群里看到有群有问问题,如下图所示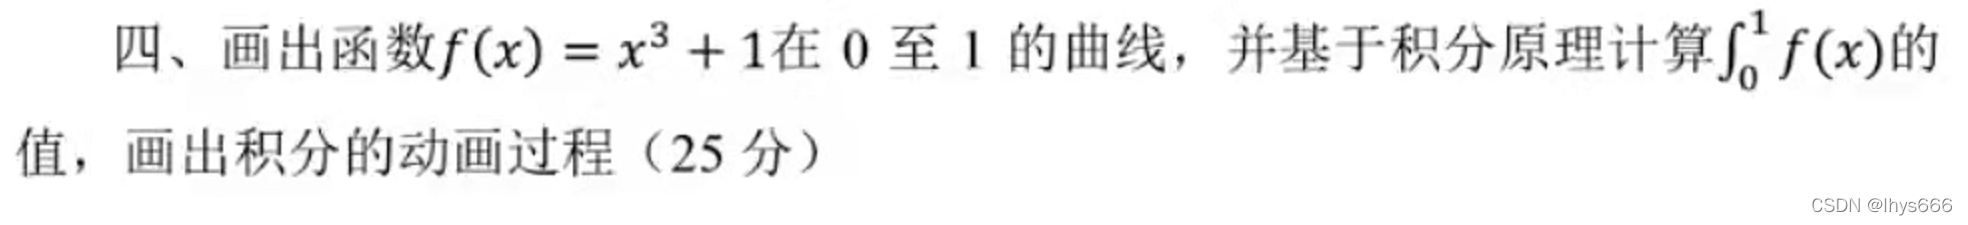
正好巩固一下上上一篇利用
Matplotlib
制作动图的知识,再学习一下制作动态柱状图,写下此篇以记录。
如果觉得我这篇文章写的好的话,能不能给我
点个赞
,
评论
、
收藏
一条龙(☆▽☆)。如果要点个
关注
的话也不是不可以🤗。
请各位参加一下文末的
投票
哦,如果 有什么不足之处,还 请各位大佬在评论区提出,不胜感激。
知识回顾
回顾一下使用
FuncAnimation
制作曲线动图的步骤(详情请见这篇文章):
- 设置画布。
- 创建列表以保存点坐标。
- 构建更新函数。
- 使用
FuncAnimation启动动画。
新的知识
上一篇是 曲线绘图 ,这次要加上 柱状图 ,于是我来到了 这里 学习一波。
这个代码的思路是:记录一连串路径点的坐标 ,通过 移动到指定点 、两点间绘制直线 来绘制柱子,可以借鉴这个思路。
从代码中可得,我们要使用
matplotlib.path.Path
记录绘制矩形的路径及方法,使用
matplotlib.patches.PathPatch
将路径绘制出来,最后使用
ax.add_patch()
将其在画布上显示出来。
我的思路
- 首先还是要导入需要的包。
import numpy as npimport matplotlib.path as pathimport matplotlib.pyplot as pltimport matplotlib.patches as patchesfrom matplotlib.animation import FuncAnimation其中,numpy用来生成点数据,path是用来生成路径,patches通过路径绘制图像。 - 然后还是设置一下画布,设置
x和y轴的范围。fig, ax = plt.subplots()ax.set_xlim(0,1.1)ax.set_ylim(0,3) - 初始化曲线和数据,以保存点的坐标和路径动作。
ln = plt.plot([],[],'ro')codes =[]verts = np.empty((0,2), np.float64)points = np.empty((0,2), np.float64)其中,codes保存路径动作,verts保存路径点坐标,points保存曲线点坐标。 - 设置更新函数。
func =lambda x: x**3+1defupdate(frame):global points, verts, codes points = np.append(points,[[frame, func(frame)]], axis=0) verts = np.append(verts,[[frame,0],[frame, func(frame)],[frame+1/50, func(frame)],[frame+1/50,0]], axis=0) ln[0].set_data(list(zip(*points))) codes.extend([path.Path.MOVETO]+[path.Path.LINETO]*3) barpath = path.Path(verts, codes) patch = patches.PathPatch(barpath, facecolor='blue', edgecolor='yellow', alpha=0.5) ax.add_patch(patch)return patch, ln[0],其中,verts要添加4个点的坐标,分别是矩形的四个顶点坐标,codes也同样添加四个动作。然后生成路径并显示。 - 启动动画
ani = FuncAnimation(fig, update, frames=np.linspace(0,1,50), repeat=False, blit=True)# 保存# ani.save('test.gif', writer='imagemagick', fps=10)plt.show()参数就不细讲了,详见 上一篇文章 ,如果在jupyter中绘制的话,记得要在代码框最前边加上%matplotlib notebook哦。
最后看一下效果:
看起来还不错。
封装一下
可以看到,代码是可以进行封装的,封装后的函数可以实现 绘制任一函数的积分动画 。
(当然,因为我的代码能力限制,这是简陋版,如果有大佬能修改修改,能否让我拜读一下)
代码如下:
%matplotlib notebook

import numpy as np
import matplotlib.path as path
import matplotlib.pyplot as plt
import matplotlib.patches as patches
from matplotlib.animation import FuncAnimation

defcreate_gif(func, interval=[-1,1,-1,1], bins=50):ifnotisinstance(interval,(list, np.array)):raise ValueError(f'Input data "{interval}" is invalid.')defupdate(frame):global points, verts, codes

        dx =(interval[1]- interval[0])/ bins
        points = np.append(points,[[frame, func(frame)]], axis=0)
        verts = np.append(verts,[[frame,0],[frame, func(frame)],[frame+dx, func(frame)],[frame+dx,0]], axis=0)
        ln[0].set_data(list(zip(*points)))

        codes.extend([path.Path.MOVETO]+[path.Path.LINETO]*3)

        barpath = path.Path(verts, codes)
        patch = patches.PathPatch(barpath, facecolor='blue', edgecolor='yellow', alpha=0.5)
        ax.add_patch(patch)return patch, ln[0],

    fig, ax = plt.subplots()

    ax.axis(interval)global points, verts, codes

    codes =[]
    verts = np.empty((0,2), np.float64)
    points = np.empty((0,2), np.float64)

    ln = plt.plot([],[],'ro')global ani
    ani = FuncAnimation(fig, update, frames=np.linspace(*interval[:2], bins), repeat=False, blit=True)# ani.save('test.gif', writer='imagemagick', fps=10)

    plt.show()
其中:
func就是要绘制动图的函数。interval是坐标轴范围。bins是要绘制的柱子个数。
测试一下:
func =lambda x: x**3+1
create_gif(func,[0,1.1,0,3])
和上图结果一样,大家也可以自行尝试。
结尾
有想要一起学习
python
的小伙伴可以
私信我
进群哦。
以上就是我要分享的内容,因为 学识尚浅,会有不足,还 请各位大佬指正。
有什么问题也可在评论区留言。
本文转载自: https://blog.csdn.net/lhys666/article/details/123451524
版权归原作者 lhys666 所有, 如有侵权,请联系我们删除。
版权归原作者 lhys666 所有, 如有侵权,请联系我们删除。