一、Matplotlib绘图
- 折线图
import matplotlib.pyplot as plt # 调用画图库
plt.rcParams['font.sans-serif'] = ['SimHei'] # 设置成可以显示中文,字体为黑体
plt.figure(figsize=(12,8)) # 调整图片尺寸
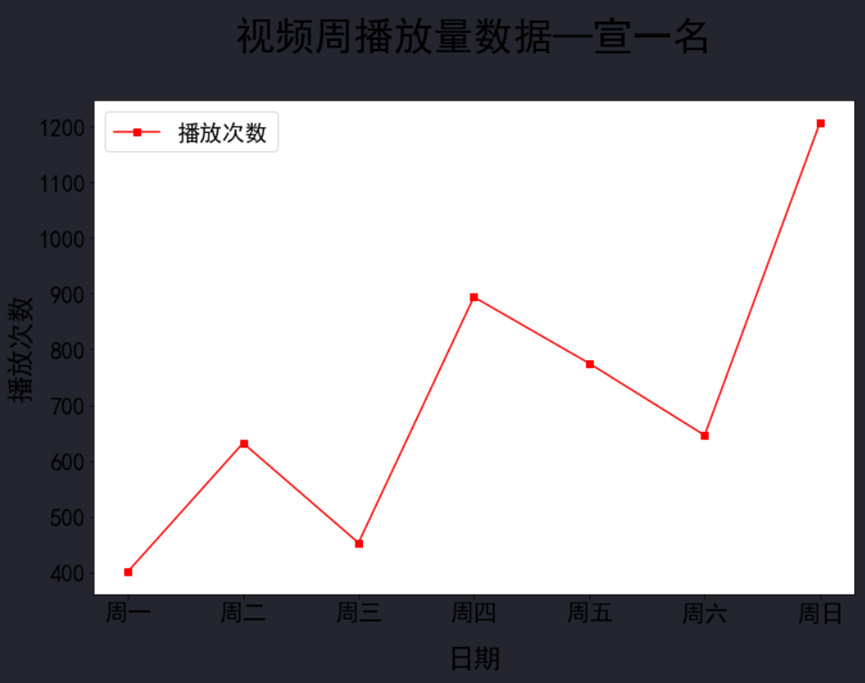
x = ['周一','周二','周三','周四','周五','周六','周日'] # 设置x轴数据
y = [401,632,453,894,775,646,1207] # 设置对应的y轴数据
plt.tick_params(labelsize=21) # 设置坐标轴刻度的字体大小
plt.xlabel('日期', fontsize=24, labelpad=20) # 设置x轴标签
plt.ylabel('播放次数', fontsize=24) # 设置y轴标签
plt.title('视频周播放量数据—宣一名', fontsize=35, pad=45) # 设置标题
plt.plot(x,y, label = "播放次数",color='r',marker='s' ) # 绘制图形
plt.legend(fontsize=20)
plt.show() # 展示图形,在Jupyter中,可省略本行
- 柱状图
import matplotlib.pyplot as plt # 调用画图库
plt.rcParams['font.sans-serif'] = ['SimHei'] # 设置成可以显示中文,字体为黑体
plt.figure(figsize=(12,8)) # 调整图片尺寸
x = ['周一','周二','周三','周四','周五','周六','周日'] # 设置x轴数据
y = [401,632,453,894,775,646,1207] # 设置对应的y轴数据
plt.tick_params(labelsize=21) # 设置坐标轴刻度的字体大小
plt.xlabel('日期', fontsize=24, labelpad=20) # 设置x轴标签
plt.ylabel('播放次数', fontsize=24) # 设置y轴标签
plt.title('视频周播放量数据—宣一名', fontsize=35, pad=45) # 设置标题
plt.plot(x,y, label = "播放次数",color='r',marker='s' ) # 绘制图形
plt.legend(fontsize=20)
plt.show() # 展示图形,在Jupyter中,可省略本行c
- 环形图
import matplotlib.pyplot as plt # 调用画图库
plt.rcParams['font.sans-serif'] = ['SimHei'] # 设置成可以显示中文,字体为黑体
plt.figure(figsize=(12,8)) # 调整图片尺寸
x = ['周一','周二','周三','周四','周五','周六','周日'] # 设置x轴数据
y = [401,632,453,894,775,646,1207] # 设置对应的y轴数据
plt.tick_params(labelsize=21) # 设置坐标轴刻度的字体大小
plt.xlabel('日期', fontsize=24, labelpad=20) # 设置x轴标签
plt.ylabel('播放次数', fontsize=24) # 设置y轴标签
plt.title('视频周播放量数据—宣一名', fontsize=35, pad=45) # 设置标题
plt.plot(x,y, label = "播放次数",color='r',marker='s' ) # 绘制图形
plt.legend(fontsize=20)
plt.show() # 展示图形,在Jupyter中,可省略本行c
- 散点图
import matplotlib.pyplot as plt # 调用画图库
plt.rcParams['font.sans-serif'] = ['SimHei'] # 设置成可以显示中文,字体为黑体
plt.figure(figsize=(12, 8)) # 调整图片尺寸
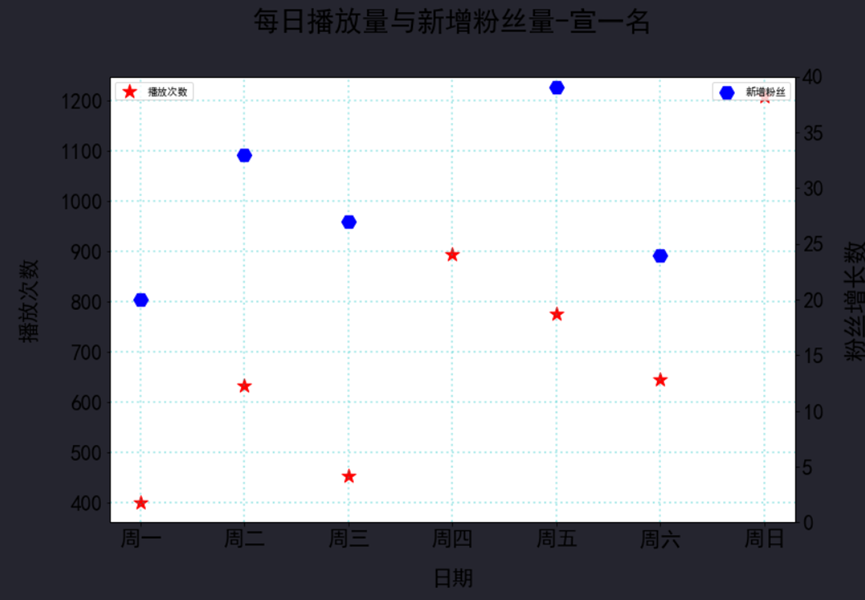
x = ["周一", "周二", "周三", "周四", "周五", "周六", "周日"]
y = [401,632,453,894,775,646,1207]
y1 = [20,33,27,45,39,24,64]
plt.tick_params(labelsize=21) # 设置坐标轴刻度的字体大小为 21
plt.xlabel('日期', fontsize=21, labelpad=20) # 设置 x 轴名称
plt.ylabel('播放次数', fontsize=21,labelpad=20) # 设置 y 轴名称
plt.title('每日播放量与新增粉丝量-宣一名', fontsize=27, pad=45) # 设置标题
plt.grid( color = 'c', linewidth = 2, linestyle = ':', alpha = 0.3) # 设置网格,颜色、线宽、样式、透明度
plt.scatter(x,y, marker = '*', c = 'r', s = 200,label="播放次数") # 绘制散点图, 设置散点样式
plt.legend()
plt.twinx() #添加右侧 y 轴,实际上是又画了一个折线图,和柱状图共享 x 轴
plt.tick_params(labelsize=21) # 设置坐标轴刻度的字体大小
plt.ylim(0,40)
plt.ylabel('粉丝增长数', fontsize=24,labelpad=20) # 设置 y 轴标签
plt.scatter(x,y1, marker = 'H', c = 'b', s = 200,label="新增粉丝")
plt.legend()
plt.show()
二、Pyecharts绘图
- 热力图
from pyecharts import options as opts # 调用图表配置选项库
from pyecharts.charts import HeatMap # 调用画图库
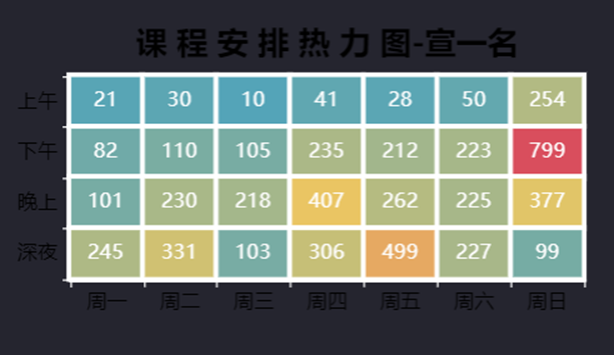
课程安排数据 =[[0, 3, 21], [1, 3, 30], [2, 3,10], [3, 3, 41], [4, 3, 28], [5, 3, 50], [6, 3, 254],
[0, 2, 82], [1, 2, 110], [2, 2, 105], [3, 2,235], [4, 2, 212], [5, 2, 223], [6, 2, 799],
[0, 1, 101], [1, 1, 230], [2, 1, 218 ], [3, 1, 407], [4, 1, 262], [5, 1, 225], [6, 1, 377],
[0, 0, 245], [1, 0, 331], [2, 0, 103], [3, 0, 306], [4, 0, 499], [5, 0, 227], [6, 0, 99] ]# 设置数据
热力图横坐标 = ['周一', '周二', '周三', '周四', '周五', '周六', '周日'] # x轴坐标数据
热力图纵坐标 = ['深夜','晚上','下午','上午'] # y轴坐标数据
宽3='410px' # 设置图片宽度高度变量
高3='250px'
热力图 = (
HeatMap(init_opts=opts.InitOpts(width=宽3, height=高3, chart_id=3)) # 绘图,设置图片大小、图表id
.add_xaxis(热力图横坐标) # 设置x轴坐标名
.add_yaxis("", 热力图纵坐标, 课程安排数据, # 设置y轴坐标名,添加数据
label_opts=opts.LabelOpts(color="white", # 标签字体颜色
font_size=13, # 字体大小
position="inside"), # 位置
itemstyle_opts=opts.ItemStyleOpts(border_color='white', # 边界线颜色
border_width=3)) # 边界线宽度
.set_global_opts(
visualmap_opts=opts.VisualMapOpts(max_=799,is_show=False), # 设置视觉映射配置项,最大值为600
xaxis_opts = opts.AxisOpts(
axislabel_opts = opts.LabelOpts(font_size = 13, # 坐标轴字体大小
color='black'), # 坐标轴字体颜色
axisline_opts = opts.AxisLineOpts(
linestyle_opts=opts.LineStyleOpts(
color='white', # 坐标轴线颜色
width=3))), # 坐标轴线宽度
yaxis_opts = opts.AxisOpts(
axislabel_opts = opts.LabelOpts(font_size = 13, # 坐标轴字体大小
color='black'), # 坐标轴字体颜色
axisline_opts = opts.AxisLineOpts(
linestyle_opts=opts.LineStyleOpts(
color='white', # 坐标轴线颜色
width=3))), # 坐标轴线宽度 width=3))), # 坐标轴线宽度
title_opts = opts.TitleOpts(
title='课 程 安 排 热 力 图-宣一名', # 设置标题
title_textstyle_opts=opts.TextStyleOpts(font_size = 20, # 标题字体大小
color="black"), # 标题颜色
pos_left = 'center',pos_top='10%'))) # 设置居中
将图表作为函数返回值
热力图.render_notebook()
- 散点图
from pyecharts.charts import Scatter # 调用画图库
import pyecharts.options as opts # 调用图表配置选项库
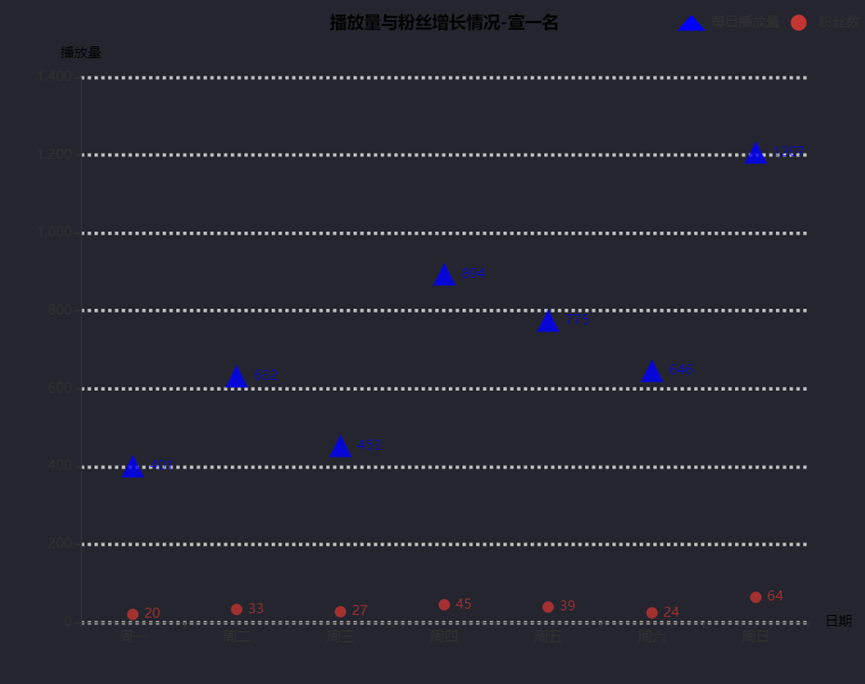
x = ["周一", "周二", "周三", "周四", "周五", "周六", "周日"]
y = [401,632,453,894,775,646,1207]
y1 = [20,33,27,45,39,24,64]
散点图 =(
Scatter(init_opts=opts.InitOpts(width="800px", height="600px")) # 定义散点图,设置图片大小
.add_xaxis(x) # 添加x轴数据
.add_yaxis('每日播放量', y, # 添加y轴数据
symbol_size = 20, # 设置散点大小
symbol = 'triangle', # 设置散点为三角形
color = 'blue', # 设置绿色
) # 取消自动注释
.add_yaxis("粉丝数",y1)
.set_global_opts(
title_opts = opts.TitleOpts(title='播放量与粉丝增长情况-宣一名', # 设置标题
title_textstyle_opts=opts.TextStyleOpts(font_size = 15,color="black"), # 设置字体大小
pos_left = 'center'), # 设置居中
legend_opts=(opts.LegendOpts(pos_left="75%")),
yaxis_opts=opts.AxisOpts(name="播放量",splitline_opts = opts.SplitLineOpts(is_show=True, # 显示y轴网格线
linestyle_opts= opts.LineStyleOpts(
width= 3, # 网格宽度为3
opacity=0.9, # 透明度90%
type_='dotted')),
name_textstyle_opts=opts.TextStyleOpts(color="black")),
xaxis_opts=opts.AxisOpts(name="日期",name_textstyle_opts=opts.TextStyleOpts(color="black")),
)
)
散点图.render_notebook()
- 折线图
from pyecharts.charts import Line # 调用画折线图的库
import pyecharts.options as opts # 调用图表配置选项库
折线图 =(
Line(init_opts=opts.InitOpts(width="1200px", height="800px")) # 定义折线图,设置大小1200*800
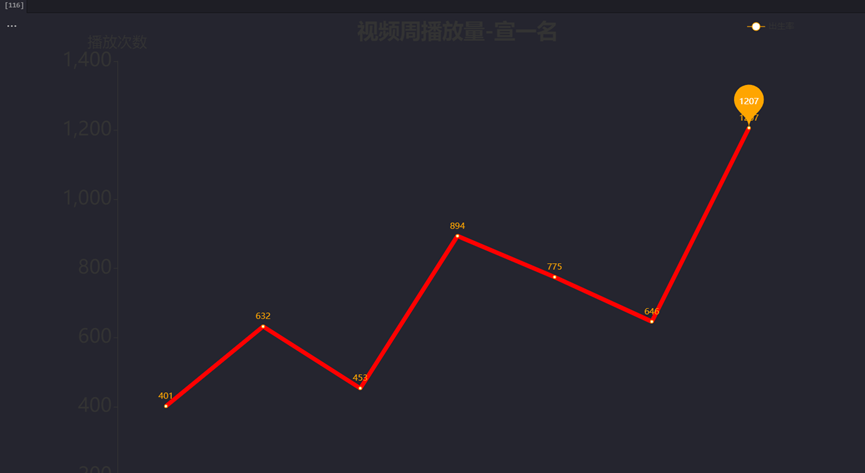
.add_xaxis(xaxis_data=["周一", "周二", "周三", "周四", "周五", "周六", "周日"]) # 添加x轴数据
.add_yaxis(series_name= '出生率', y_axis=[401,632,453,894,775,646,1207], # 添加y轴数据
linestyle_opts = opts.LineStyleOpts(color='red', width =6), color = 'orange', # 设置折线颜色,宽度,图例颜色
markpoint_opts = opts.MarkPointOpts( data =[ opts.MarkPointItem(name='最大值', type_='max' ), # 设置折线图最高点注释
opts.MarkPointItem(name='最小值', coord=('2020',8.52), value=8.52)], # 最低点注释
symbol_size=70)) # 注释标记点大小
.set_global_opts(
yaxis_opts = opts.AxisOpts( name = '播放次数', # 设置 y 轴名称
min_ = 6, # 设置y轴的起始点
name_textstyle_opts = opts.TextStyleOpts(font_size = 21), # 设置名称字体大小
axislabel_opts = opts.LabelOpts(font_size = 27)), # 设置 y 轴字体大小
xaxis_opts = opts.AxisOpts( name = '日期', # 设置 x 轴名称
name_textstyle_opts = opts.TextStyleOpts(font_size = 21), # 设置名称字体大小
axislabel_opts = opts.LabelOpts(font_size = 27)) , # 设置 x 轴字体大小
title_opts = opts.TitleOpts(title='视频周播放量-宣一名', # 设置标题
title_textstyle_opts=opts.TextStyleOpts(font_size = 30), # 设置字体大小
pos_left = 'center'), # 设置居中
legend_opts = opts.LegendOpts(pos_right = '10%')) # 调整图例显示位置,距离右侧边缘10%整体宽度的距离
)
折线图.render_notebook() # 展示图片
- 地图
from pyecharts import options as opts # 调用图表配置选项库
from pyecharts.charts import Map # 调用画图
from pyecharts.globals import ThemeType # 调用设置主题样式
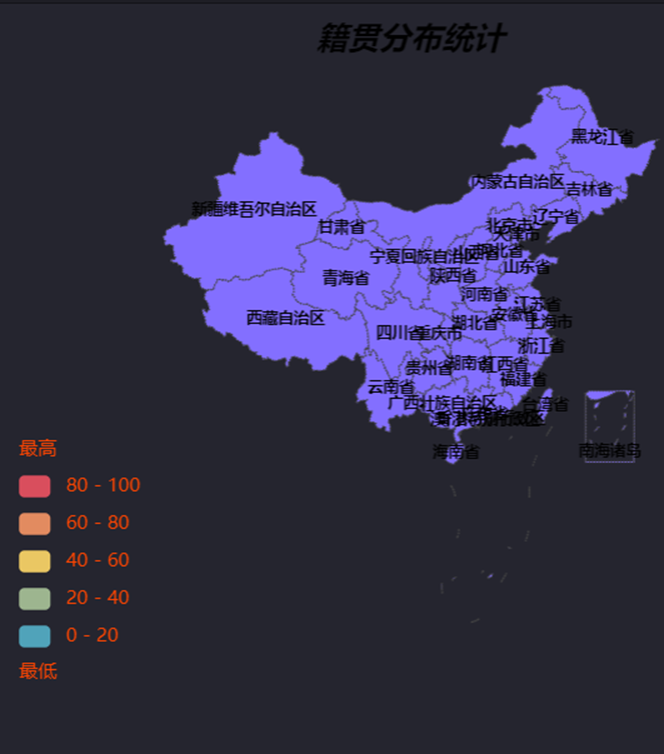
地图数据 = [ ['山西',81] , # 设置数据
['辽宁',280] ,
['江苏',203 ] ,['浙江',126 ] ,
['福建',65 ],['山东',135 ] ,['上海',182] ,
['湖北',150 ] ,['广东',218] ,
['四川',173] ,
['云南',24 ],['北京',242],['安徽',99]]
宽7='510px'
高7='430px'
def 地图(地图数据):
地图 = (
Map(init_opts=opts.InitOpts(width=宽7, height=高7,theme=ThemeType.WONDERLAND,chart_id=7)) # 设置大小
.add("",data_pair=地图数据,
is_roam=False,
maptype="china",
label_opts=opts.LabelOpts(
color="black",
font_size=10,
font_weight='bold'),
itemstyle_opts=opts.ItemStyleOpts(
color='#008B8B',
area_color='#836FFF',
opacity=1,
border_width=1,
border_type='dotted', # 省份边界为虚
))
.set_global_opts(
title_opts=opts.TitleOpts(
title="籍贯分布统计",
pos_left='center',
title_textstyle_opts=opts.TextStyleOpts(
font_style='italic',
font_size=20,
color="black"
)
),
visualmap_opts=opts.VisualMapOpts(
is_piecewise=True,
type_='color',
min_=0,
max_=100,
range_text=["最高","最低"],
textstyle_opts = opts.TextStyleOpts(color="#FF4500")
),
tooltip_opts = opts.TooltipOpts( # 设置提示框
formatter='{b}: {c}人', # 设置内容格式
textstyle_opts = opts.TextStyleOpts(font_size=13)), # 设置字体大小
)
)
return 地图
地图(地图数据).render_notebook() # 展示图
- 环形图
from pyecharts import options as opts # 调用图表配置选项库
from pyecharts.charts import Pie # 调用画饼图库
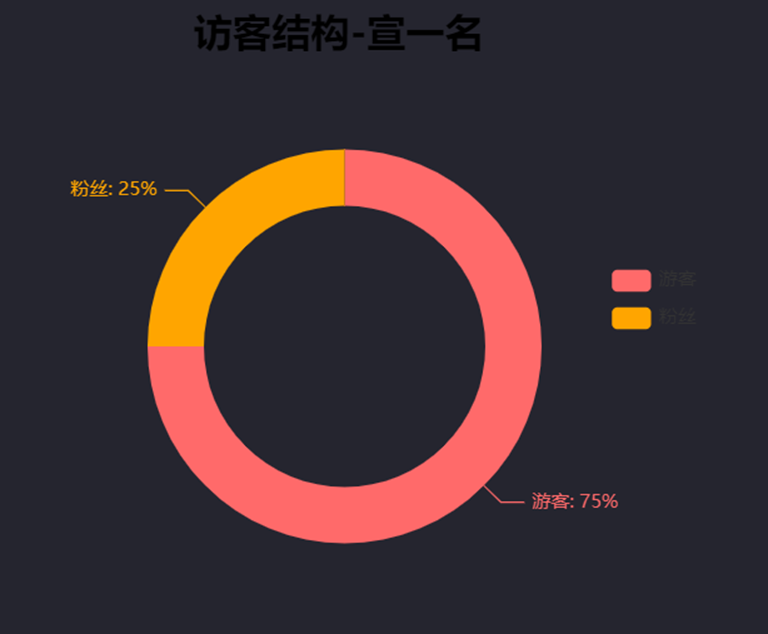
数据 = [ ('游客', 75), ('粉丝', 25)]
饼图 = (Pie(init_opts=opts.InitOpts(width="460px", height="360px")) # 画饼图
.add('', data_pair=数据,radius=['50%','70%'],center=["50%","60%"],)
.set_colors([ "#FF6A6A", "orange"])
.set_series_opts(label_opts=opts.LabelOpts(formatter="{b}: {c}%"))
.set_global_opts(
title_opts=opts.TitleOpts(title="访客结构-宣一名 ",pos_left = 'center',title_textstyle_opts=opts.TextStyleOpts(font_size=25,color='black')),
legend_opts=opts.LegendOpts(pos_right='0%',orient='vertical',pos_top='45%'))
)
饼图.render_notebook() # 展示图片
- 水球图
from pyecharts import options as opts # 调用图表配置选项库
from pyecharts.charts import Liquid # 调用画图库
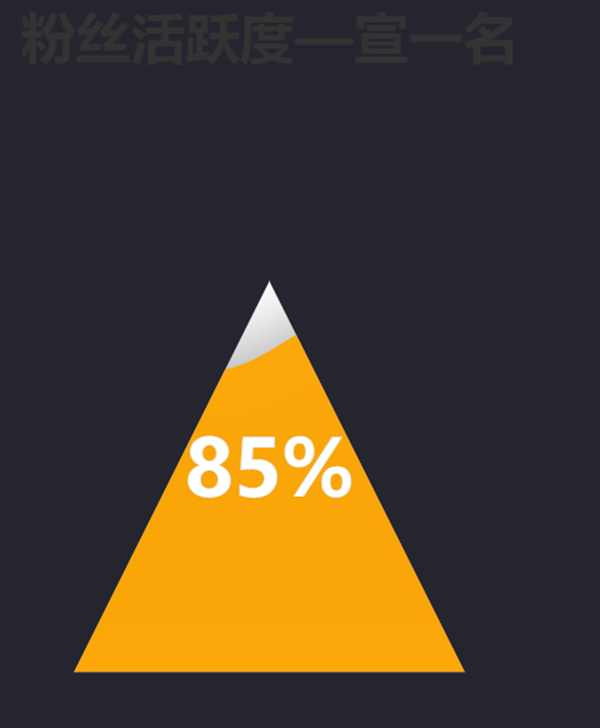
数据 = [0.85] # 设置数据
水球图 = (
Liquid()
.add("", 数据,
shape = 'triangle',
center = ['50%','60%'], # 设置水球位置
is_outline_show = False, # 删除外边框
color = ['orange'], # 白色波浪
background_color = 'white') # 黄色圆球
.set_global_opts(
title_opts = opts.TitleOpts(
title='粉丝活跃度—宣一名', # 设置标题
title_textstyle_opts=opts.TextStyleOpts(font_size =35), # 设置字体大小
pos_left = 'center')) # 设置居中
)
水球图.render_notebook() # 展示图片
- 条形图
from pyecharts import options as opts # 调用图表配置选项库
from pyecharts.charts import Bar # 调用柱状图库
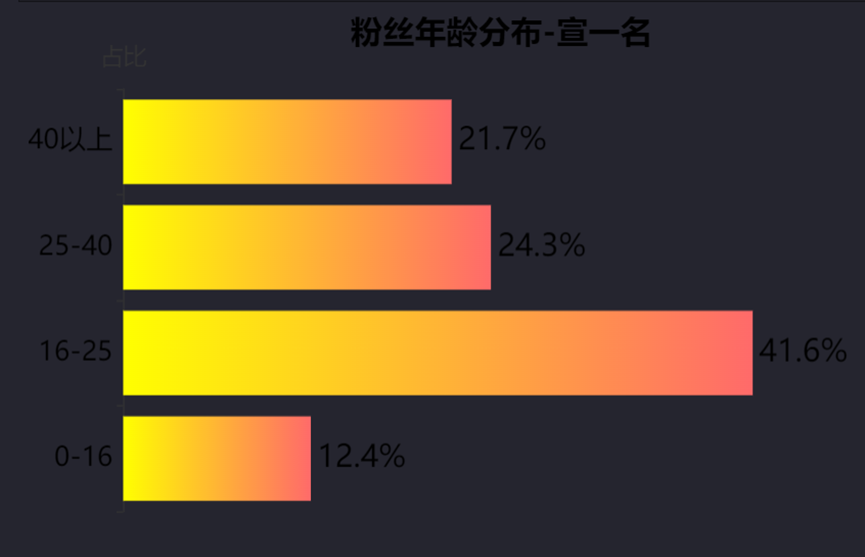
x = ['0-16','16-25','25-40','40以上']
y = [12.4,41.6,24.3,21.7]
x.reverse() # 因观看习惯,调整排列顺序
y.reverse() # 因观看习惯,调整排列顺序
条形图 = (Bar(init_opts=opts.InitOpts(width="740px", height="450px"))#画条形图设置尺寸
.add_xaxis(x) # 设置 x 轴坐标
.add_yaxis('', y,label_opts = opts.LabelOpts( # 设置 y 轴数据
font_size = 24, # 设置注释字体
position='right', # 设置注释位置
color = 'black',
formatter='{c}%'),
color={ 'type': 'linear',
变化类型为线型渐变,变化方向为起始点至终点
'x': 0, # (x,y) 为(0,0),是起始点
'y': 0,'x2': 1, # (x2,y2)为(1,0)为终点
'y2': 0,
'colorStops': [{'offset': 0, 'color': 'yellow' },
0 代表 0%,起始位置蓝色
{'offset': 1, 'color': ' #FF6A6A'}]})
1 代表 100%,终点位置为) # 设置注释内容为对应的数据+%
.reversal_axis() # 将柱状图转换成条形图
.set_global_opts(
xaxis_opts = opts.AxisOpts( name = '年龄',is_show=False, # 设置坐标轴名称
name_textstyle_opts=opts.TextStyleOpts(font_size = 18), # 设置名称字体大小
axislabel_opts = opts.LabelOpts(font_size = 21)), # 设置 x 轴坐标字体大小
yaxis_opts = opts.AxisOpts( name = '占比', # 设置坐标轴名称
name_textstyle_opts=opts.TextStyleOpts(font_size = 18), # 设置名称字体大小
axislabel_opts = opts.LabelOpts(font_size = 21,color = 'black')), # 设置 y 轴坐标字体大小
title_opts = opts.TitleOpts(title='粉丝年龄分布-宣一名', # 设置标题
title_textstyle_opts=opts.TextStyleOpts(font_size = 25,color = 'black'), # 设置字体大小
pos_left = 'center'))) # 设置居中
条形图.render_notebook() # 展示图
- 柱形图
from pyecharts import options as opts # 调用图表配置选项库
from pyecharts.charts import Bar # 调用柱状图库
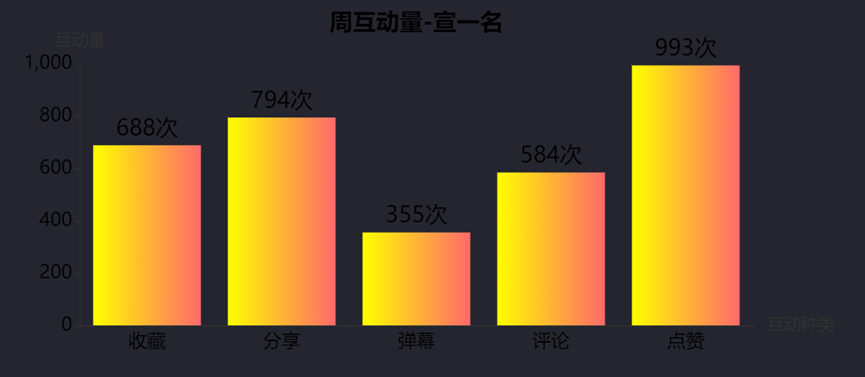
x = ['点赞','评论','弹幕','分享','收藏']
y = [993,584,355,794,688]
x.reverse() # 因观看习惯,调整排列顺序
y.reverse() # 因观看习惯,调整排列顺序
条形图 = (Bar(init_opts=opts.InitOpts(width="900px", height="400px"))#画条形图设置尺寸
.add_xaxis(x) # 设置 x 轴坐标
.add_yaxis('', y,label_opts = opts.LabelOpts( # 设置 y 轴数据
font_size = 24, # 设置注释字体
color = 'black',
position="center", # 设置注释位置
formatter='{c}次'),
color={ 'type': 'linear',
变化类型为线型渐变,变化方向为起始点至终点
'x': 0, # (x,y) 为(0,0),是起始点
'y': 0,'x2': 1, # (x2,y2)为(1,0)为终点
'y2': 0,
'colorStops': [{'offset': 0, 'color': 'yellow' },
0 代表 0%,起始位置蓝色
{'offset': 1, 'color': ' #FF6A6A'}]})
1 代表 100%,终点位置为) # 设置注释内容为对应的数据+%
.set_global_opts(
xaxis_opts = opts.AxisOpts( name = '互动种类', # 设置坐标轴名称
name_textstyle_opts=opts.TextStyleOpts(font_size = 18), # 设置名称字体大小
axislabel_opts = opts.LabelOpts(font_size = 20,color = 'black')), # 设置 x 轴坐标字体大小
yaxis_opts = opts.AxisOpts( name = '互动量', # 设置坐标轴名称
name_textstyle_opts=opts.TextStyleOpts(font_size = 18), # 设置名称字体大小
axislabel_opts = opts.LabelOpts(font_size = 20,color = 'black')), # 设置 y 轴坐标字体大小
title_opts = opts.TitleOpts(title='周互动量-宣一名', # 设置标题
title_textstyle_opts=opts.TextStyleOpts(font_size = 25,color = 'black'), # 设置字体大小
pos_left = 'center'))) # 设置居中
条形图.render_notebook() # 展示图
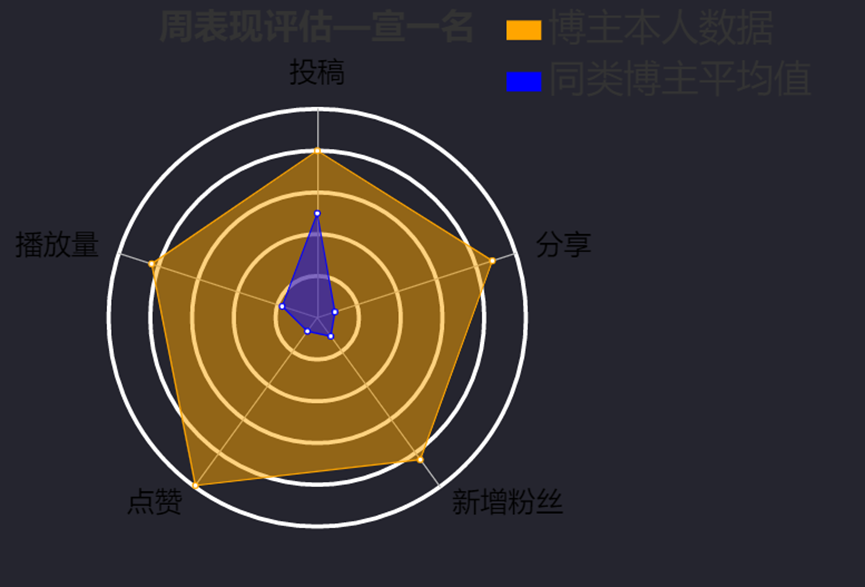
- 雷达图
from pyecharts import options as opts # 调用图表配置选项库
from pyecharts.charts import Radar # 调用雷达图库
博主本人数据 = [[8, 5008, 993, 252, 794 ]] # 设置数据
同类博主平均值 = [[5, 1061, 80, 33, 80 ]] # 注意数据有两个方括号
雷达图 = (
Radar(init_opts=opts.InitOpts(width="800px", height="500px")) # 画雷达图
.add_schema( shape='circle', # 设置为圆形坐标系 # 设置雷达图坐标轴名称
radius='60%', center=['50%','45%'], # 调整大小和位
schema=[ opts.RadarIndicatorItem(name="投稿",max_=10),
opts.RadarIndicatorItem(name="播放量",max_=6000),
opts.RadarIndicatorItem(name="点赞",max_=1000),
opts.RadarIndicatorItem(name="新增粉丝",max_=300),
opts.RadarIndicatorItem(name="分享",max_=900)],
splitline_opt = opts.SplitLineOpts(is_show=True,linestyle_opts=opts.LineStyleOpts(width=3,color='white')),
textstyle_opts = opts.TextStyleOpts(color='black',font_size=20))
.add("博主本人数据", 博主本人数据,color='orange',areastyle_opts=opts.AreaStyleOpts(opacity=0.5)) # 添加雷达图数据
.add("同类博主平均值", 同类博主平均值,color='blue',areastyle_opts=opts.AreaStyleOpts(opacity=0.5))
.set_series_opts(label_opts=opts.LabelOpts(is_show=False)) # 不显示注释
.set_global_opts(
title_opts = opts.TitleOpts(title='周表现评估—宣一名', # 设置标题
title_textstyle_opts=opts.TextStyleOpts(font_size = 25), # 设置字体大小
pos_left = 'center'), # 设置居中
legend_opts = opts.LegendOpts(legend_icon='*',
pos_right = '5%', # 调整图例位置距离右侧 5%
orient= 'vertical', # 调整图例纵向排列
textstyle_opts=opts.TextStyleOpts(font_size = 27))) # 设置字体大小
)
雷达图.render_notebook()
三、数据可视化大屏
- 背景图片
from pyecharts.components import Image # 调用绘图库
图片网址 = 'https://s1.ax1x.com/2022/05/25/XFcJOg.gif'# 设置图片网址
宽0 = "100%" # 设置图片宽度高度变量
高0 = "100%"
def 背景图片(图片网址): # 定义函数,便于可视化大屏调用
图片 = (
Image() # 绘图
.add( 图片网址, # 添加图片
style_opts={"width": 宽0, "height": 高0 }) # 设置图片
)
图片.chart_id = 0 # 设置图表id为0
return 图片 # 设置函数返回值
背景图片(图片网址).render_notebook() # 展示图片
- 主标题
import pyecharts.options as opts # 调用图表配置选项库
from pyecharts.charts import Pie # 调用画图库
主标题名称数据 = "各人博客数据分析可视化展示" # 设置数据
宽1='800px' # 设置图片宽度高度变量
高1='60px'
def 主标题(主标题名称数据): # 定义函数,便于可视化大屏调用
标题 = (
Pie(init_opts=opts.InitOpts(width=宽1, height=高1, chart_id=1)) # 绘图,设置图片大小、图表id
.set_global_opts(
title_opts=opts.TitleOpts(
title=主标题名称数据, # 设置标题
title_textstyle_opts=opts.TextStyleOpts(font_size=45,
font_family = '楷体', # 字体大小
color='#F0FFF0')))) # 字体颜色
return 标题 # 将图表作为函数返回值
主标题(主标题名称数据).render_notebook()
- 副标题
import pyecharts.options as opts # 调用图表配置选项库
from pyecharts.charts import Pie # 调用画图库
副标题名称数据 = '宣一名 2022-6-7' # 设置数据
宽2='270px' # 设置图片宽度高度变量
高2='40px'
def 副标题(副标题名称数据): # 定义函数,便于可视化大屏调用
标题 = (
Pie(init_opts=opts.InitOpts(width=宽2, height=高2,chart_id=2)) # 绘图,设置图片大小、图表id
.set_global_opts(
title_opts=opts.TitleOpts(
title=副标题名称数据, # 设置标题
title_textstyle_opts=opts.TextStyleOpts(font_size=30,
font_family = '楷体',# 字体大小
color='#F0FFF0')))) # 字体颜色
return 标题 # 将图表作为函数返回值
副标题(副标题名称数据).render_notebook()
- 热力图
from pyecharts import options as opts # 调用图表配置选项库
from pyecharts.charts import HeatMap # 调用画图库
课程安排数据 =[[0, 3, 21], [1, 3, 30], [2, 3,10], [3, 3, 41], [4, 3, 28], [5, 3, 50], [6, 3, 254],
[0, 2, 82], [1, 2, 110], [2, 2, 105], [3, 2,235], [4, 2, 212], [5, 2, 223], [6, 2, 799],
[0, 1, 101], [1, 1, 230], [2, 1, 218 ], [3, 1, 407], [4, 1, 262], [5, 1, 225], [6, 1, 377],
[0, 0, 245], [1, 0, 331], [2, 0, 103], [3, 0, 306], [4, 0, 499], [5, 0, 227], [6, 0, 99] ]# 设置数据
热力图横坐标 = ['周一', '周二', '周三', '周四', '周五', '周六', '周日'] # x轴坐标数据
热力图纵坐标 = ['深夜','晚上','下午','上午'] # y轴坐标数据
宽3='410px' # 设置图片宽度高度变量
高3='250px'
热力图 = (
HeatMap(init_opts=opts.InitOpts(width=宽3, height=高3, chart_id=3)) # 绘图,设置图片大小、图表id
.add_xaxis(热力图横坐标) # 设置x轴坐标名
.add_yaxis("", 热力图纵坐标, 课程安排数据, # 设置y轴坐标名,添加数据
label_opts=opts.LabelOpts(color="white", # 标签字体颜色
font_size=13, # 字体大小
position="inside"), # 位置
itemstyle_opts=opts.ItemStyleOpts(border_color='white', # 边界线颜色
border_width=3)) # 边界线宽度
.set_global_opts(
visualmap_opts=opts.VisualMapOpts(max_=799,is_show=False), # 设置视觉映射配置项,最大值为600
xaxis_opts = opts.AxisOpts(
axislabel_opts = opts.LabelOpts(font_size = 13, # 坐标轴字体大小
color='black'), # 坐标轴字体颜色
axisline_opts = opts.AxisLineOpts(
linestyle_opts=opts.LineStyleOpts(
color='white', # 坐标轴线颜色
width=3))), # 坐标轴线宽度
yaxis_opts = opts.AxisOpts(
axislabel_opts = opts.LabelOpts(font_size = 13, # 坐标轴字体大小
color='black'), # 坐标轴字体颜色
axisline_opts = opts.AxisLineOpts(
linestyle_opts=opts.LineStyleOpts(
color='white', # 坐标轴线颜色
width=3))), # 坐标轴线宽度 width=3))), # 坐标轴线宽度
title_opts = opts.TitleOpts(
title='课 程 安 排 热 力 图-宣一名', # 设置标题
title_textstyle_opts=opts.TextStyleOpts(font_size = 20, # 标题字体大小
color="black"), # 标题颜色
pos_left = 'center',pos_top='10%'))) # 设置居中
将图表作为函数返回值
热力图.render_notebook()
- 散点图
from pyecharts.charts import Scatter # 调用画图库
import pyecharts.options as opts # 调用图表配置选项库
x = ["周一", "周二", "周三", "周四", "周五", "周六", "周日"]
y = [401,632,453,894,775,646,1207]
y1 = [20,33,27,45,39,24,64]
散点图 =(
Scatter(init_opts=opts.InitOpts(width="800px", height="600px")) # 定义散点图,设置图片大小
.add_xaxis(x) # 添加x轴数据
.add_yaxis('每日播放量', y, # 添加y轴数据
symbol_size = 20, # 设置散点大小
symbol = 'triangle', # 设置散点为三角形
color = 'blue', # 设置绿色
) # 取消自动注释
.add_yaxis("粉丝数",y1)
.set_global_opts(
title_opts = opts.TitleOpts(title='播放量与粉丝增长情况-宣一名', # 设置标题
title_textstyle_opts=opts.TextStyleOpts(font_size = 15,color="black"), # 设置字体大小
pos_left = 'center'), # 设置居中
legend_opts=(opts.LegendOpts(pos_left="75%")),
yaxis_opts=opts.AxisOpts(name="播放量",splitline_opts = opts.SplitLineOpts(is_show=True, # 显示y轴网格线
linestyle_opts= opts.LineStyleOpts(
width= 3, # 网格宽度为3
opacity=0.9, # 透明度90%
type_='dotted')),
name_textstyle_opts=opts.TextStyleOpts(color="black")),
xaxis_opts=opts.AxisOpts(name="日期",name_textstyle_opts=opts.TextStyleOpts(color="black")),
)
)
散点图.render_notebook()
- 折线图
from pyecharts.charts import Line # 调用画折线图的库
import pyecharts.options as opts # 调用图表配置选项库
折线图 =(
Line(init_opts=opts.InitOpts(width="800px", height="500px")) # 定义折线图,设置大小1200*800
.add_xaxis(xaxis_data=["周一", "周二", "周三", "周四", "周五", "周六", "周日"]) # 添加x轴数据
.add_yaxis(series_name= '出生率', y_axis=[401,632,453,894,775,646,1207], # 添加y轴数据
linestyle_opts = opts.LineStyleOpts(color='red', width =6), color = 'orange', # 设置折线颜色,宽度,图例颜色
markpoint_opts = opts.MarkPointOpts( data =[ opts.MarkPointItem(name='最大值', type_='max' ), # 设置折线图最高点注释
opts.MarkPointItem(name='最小值', coord=('2020',8.52), value=8.52)], # 最低点注释
symbol_size=70)) # 注释标记点大小
.set_global_opts(
yaxis_opts = opts.AxisOpts( name = '播放次数', # 设置 y 轴名称
min_ = 6, # 设置y轴的起始点
name_textstyle_opts = opts.TextStyleOpts(font_size = 21), # 设置名称字体大小
axislabel_opts = opts.LabelOpts(font_size = 27)), # 设置 y 轴字体大小
xaxis_opts = opts.AxisOpts( name = '日期', # 设置 x 轴名称
name_textstyle_opts = opts.TextStyleOpts(font_size = 21), # 设置名称字体大小
axislabel_opts = opts.LabelOpts(font_size = 27)) , # 设置 x 轴字体大小
title_opts = opts.TitleOpts(title='视频周播放量-宣一名', # 设置标题
title_textstyle_opts=opts.TextStyleOpts(font_size = 30), # 设置字体大小
pos_left = 'center'), # 设置居中
legend_opts = opts.LegendOpts(pos_right = '10%')) # 调整图例显示位置,距离右侧边缘10%整体宽度的距离
)
折线图.render_notebook()
- 地图
from pyecharts import options as opts # 调用图表配置选项库
from pyecharts.charts import Map # 调用画图
from pyecharts.globals import ThemeType # 调用设置主题样式
地图数据 = [ ['山西',81] , # 设置数据
['辽宁',280] ,
['江苏',203 ] ,['浙江',126 ] ,
['福建',65 ],['山东',135 ] ,['上海',182] ,
['湖北',150 ] ,['广东',218] ,
['四川',173] ,
['云南',24 ],['北京',242],['安徽',99]]
宽7='510px'
高7='430px'
def 地图(地图数据):
地图 = (
Map(init_opts=opts.InitOpts(width=宽7, height=高7,theme=ThemeType.WONDERLAND,chart_id=7)) # 设置大小
.add("",data_pair=地图数据,
is_roam=False,
maptype="china",
label_opts=opts.LabelOpts(
color="black",
font_size=10,
font_weight='bold'),
itemstyle_opts=opts.ItemStyleOpts(
color='#008B8B',
area_color='#836FFF',
opacity=1,
border_width=1,
border_type='dotted', # 省份边界为虚
))
.set_global_opts(
title_opts=opts.TitleOpts(
title="籍贯分布统计",
pos_left='center',
title_textstyle_opts=opts.TextStyleOpts(
font_style='italic',
font_size=20,
color="black"
)
),
visualmap_opts=opts.VisualMapOpts(
is_piecewise=True,
type_='color',
min_=0,
max_=100,
range_text=["最高","最低"],
textstyle_opts = opts.TextStyleOpts(color="#FF4500")
),
tooltip_opts = opts.TooltipOpts( # 设置提示框
formatter='{b}: {c}人', # 设置内容格式
textstyle_opts = opts.TextStyleOpts(font_size=13)), # 设置字体大小
)
)
return 地图
地图(地图数据).render_notebook() # 展示图
- 环形图
from pyecharts import options as opts # 调用图表配置选项库
from pyecharts.charts import Pie # 调用画饼图库
数据 = [ ('游客', 75), ('粉丝', 25)]
饼图 = (Pie(init_opts=opts.InitOpts(width="460px", height="360px")) # 画饼图
.add('', data_pair=数据,radius=['50%','70%'],center=["50%","60%"],)
.set_colors([ "#FF6A6A", "orange"])
.set_series_opts(label_opts=opts.LabelOpts(formatter="{b}: {c}%"))
.set_global_opts(
title_opts=opts.TitleOpts(title="访客结构-宣一名 ",pos_left = 'center',title_textstyle_opts=opts.TextStyleOpts(font_size=25,color='black')),
legend_opts=opts.LegendOpts(pos_right='0%',orient='vertical',pos_top='45%'))
)
饼图.render_notebook() # 展示图片
- 水球图
from pyecharts import options as opts # 调用图表配置选项库
from pyecharts.charts import Liquid # 调用画图库
数据 = [0.85] # 设置数据
水球图 = (
Liquid()
.add("", 数据,
shape = 'triangle',
center = ['50%','60%'], # 设置水球位置
is_outline_show = False, # 删除外边框
color = ['orange'], # 白色波浪
background_color = 'white') # 黄色圆球
.set_global_opts(
title_opts = opts.TitleOpts(
title='粉丝活跃度—宣一名', # 设置标题
title_textstyle_opts=opts.TextStyleOpts(font_size =35), # 设置字体大小
pos_left = 'center')) # 设置居中
)
水球图.render_notebook() # 展示图片
- 条形图
from pyecharts import options as opts # 调用图表配置选项库
from pyecharts.charts import Bar # 调用柱状图库
x = ['0-16','16-25','25-40','40以上']
y = [12.4,41.6,24.3,21.7]
x.reverse() # 因观看习惯,调整排列顺序
y.reverse() # 因观看习惯,调整排列顺序
条形图 = (Bar(init_opts=opts.InitOpts(width="740px", height="450px"))#画条形图设置尺寸
.add_xaxis(x) # 设置 x 轴坐标
.add_yaxis('', y,label_opts = opts.LabelOpts( # 设置 y 轴数据
font_size = 24, # 设置注释字体
position='right', # 设置注释位置
color = 'black',
formatter='{c}%'),
color={ 'type': 'linear',
变化类型为线型渐变,变化方向为起始点至终点
'x': 0, # (x,y) 为(0,0),是起始点
'y': 0,'x2': 1, # (x2,y2)为(1,0)为终点
'y2': 0,
'colorStops': [{'offset': 0, 'color': 'yellow' },
0 代表 0%,起始位置蓝色
{'offset': 1, 'color': ' #FF6A6A'}]})
1 代表 100%,终点位置为) # 设置注释内容为对应的数据+%
.reversal_axis() # 将柱状图转换成条形图
.set_global_opts(
xaxis_opts = opts.AxisOpts( name = '年龄',is_show=False, # 设置坐标轴名称
name_textstyle_opts=opts.TextStyleOpts(font_size = 18), # 设置名称字体大小
axislabel_opts = opts.LabelOpts(font_size = 21)), # 设置 x 轴坐标字体大小
yaxis_opts = opts.AxisOpts( name = '占比', # 设置坐标轴名称
name_textstyle_opts=opts.TextStyleOpts(font_size = 18), # 设置名称字体大小
axislabel_opts = opts.LabelOpts(font_size = 21,color = 'black')), # 设置 y 轴坐标字体大小
title_opts = opts.TitleOpts(title='粉丝年龄分布-宣一名', # 设置标题
title_textstyle_opts=opts.TextStyleOpts(font_size = 25,color = 'black'), # 设置字体大小
pos_left = 'center'))) # 设置居中
条形图.render_notebook() # 展示图
- 柱形图
from pyecharts import options as opts # 调用图表配置选项库
from pyecharts.charts import Bar # 调用柱状图库
x = ['点赞','评论','弹幕','分享','收藏']
y = [993,584,355,794,688]
x.reverse() # 因观看习惯,调整排列顺序
y.reverse() # 因观看习惯,调整排列顺序
条形图 = (Bar(init_opts=opts.InitOpts(width="900px", height="400px"))#画条形图设置尺寸
.add_xaxis(x) # 设置 x 轴坐标
.add_yaxis('', y,label_opts = opts.LabelOpts( # 设置 y 轴数据
font_size = 24, # 设置注释字体
color = 'black',
position="center", # 设置注释位置
formatter='{c}次'),
color={ 'type': 'linear',
变化类型为线型渐变,变化方向为起始点至终点
'x': 0, # (x,y) 为(0,0),是起始点
'y': 0,'x2': 1, # (x2,y2)为(1,0)为终点
'y2': 0,
'colorStops': [{'offset': 0, 'color': 'yellow' },
0 代表 0%,起始位置蓝色
{'offset': 1, 'color': ' #FF6A6A'}]})
1 代表 100%,终点位置为) # 设置注释内容为对应的数据+%
.set_global_opts(
xaxis_opts = opts.AxisOpts( name = '互动种类', # 设置坐标轴名称
name_textstyle_opts=opts.TextStyleOpts(font_size = 18), # 设置名称字体大小
axislabel_opts = opts.LabelOpts(font_size = 20,color = 'black')), # 设置 x 轴坐标字体大小
yaxis_opts = opts.AxisOpts( name = '互动量', # 设置坐标轴名称
name_textstyle_opts=opts.TextStyleOpts(font_size = 18), # 设置名称字体大小
axislabel_opts = opts.LabelOpts(font_size = 20,color = 'black')), # 设置 y 轴坐标字体大小
title_opts = opts.TitleOpts(title='周互动量-宣一名', # 设置标题
title_textstyle_opts=opts.TextStyleOpts(font_size = 25,color = 'black'), # 设置字体大小
pos_left = 'center'))) # 设置居中
条形图.render_notebook() # 展示图
- 雷达图
from pyecharts import options as opts # 调用图表配置选项库
from pyecharts.charts import Radar # 调用雷达图库
博主本人数据 = [[8, 5008, 993, 252, 794 ]] # 设置数据
同类博主平均值 = [[5, 1061, 80, 33, 80 ]] # 注意数据有两个方括号
雷达图 = (
Radar(init_opts=opts.InitOpts(width="800px", height="500px")) # 画雷达图
.add_schema( shape='circle', # 设置为圆形坐标系 # 设置雷达图坐标轴名称
radius='60%', center=['50%','45%'], # 调整大小和位
schema=[ opts.RadarIndicatorItem(name="投稿",max_=10),
opts.RadarIndicatorItem(name="播放量",max_=6000),
opts.RadarIndicatorItem(name="点赞",max_=1000),
opts.RadarIndicatorItem(name="新增粉丝",max_=300),
opts.RadarIndicatorItem(name="分享",max_=900)],
splitline_opt = opts.SplitLineOpts(is_show=True,linestyle_opts=opts.LineStyleOpts(width=3,color='white')),
textstyle_opts = opts.TextStyleOpts(color='black',font_size=20))
.add("博主本人数据", 博主本人数据,color='orange',areastyle_opts=opts.AreaStyleOpts(opacity=0.5)) # 添加雷达图数据
.add("同类博主平均值", 同类博主平均值,color='blue',areastyle_opts=opts.AreaStyleOpts(opacity=0.5))
.set_series_opts(label_opts=opts.LabelOpts(is_show=False)) # 不显示注释
.set_global_opts(
title_opts = opts.TitleOpts(title='周表现评估—宣一名', # 设置标题
title_textstyle_opts=opts.TextStyleOpts(font_size = 25), # 设置字体大小
pos_left = 'center'), # 设置居中
legend_opts = opts.LegendOpts(legend_icon='*',
pos_right = '5%', # 调整图例位置距离右侧 5%
orient= 'vertical', # 调整图例纵向排列
textstyle_opts=opts.TextStyleOpts(font_size = 27))) # 设置字体大小
)
雷达图.render_notebook()
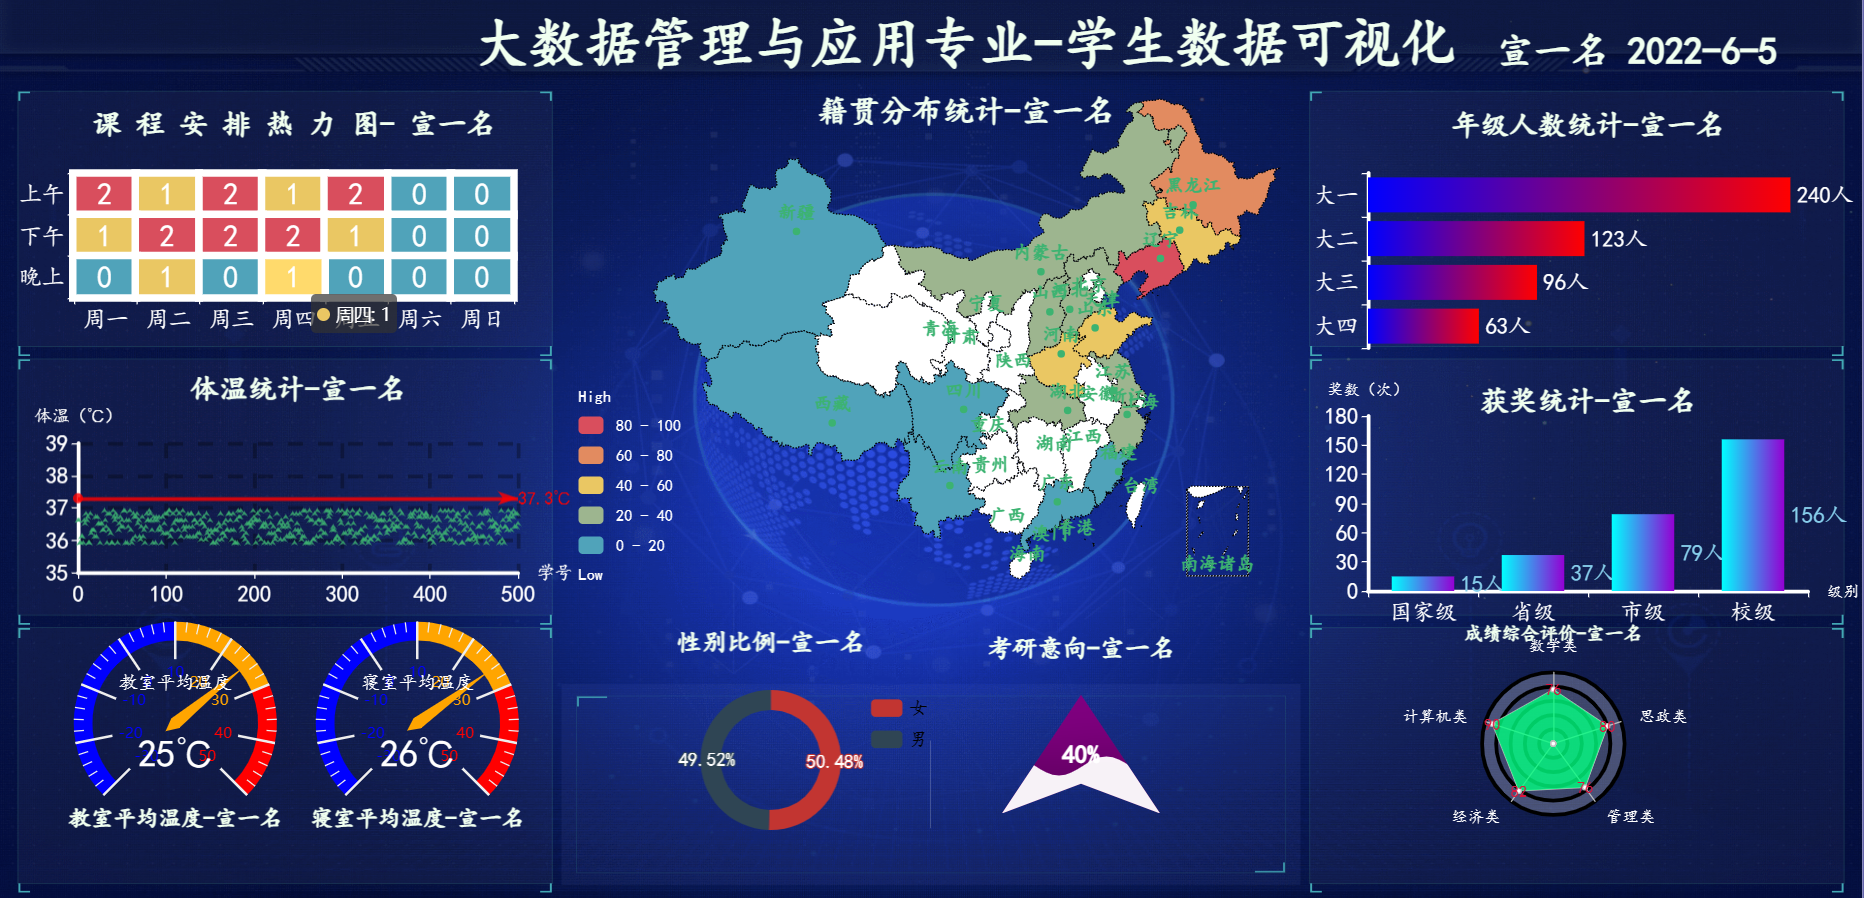
- 整合可视化大屏
from pyecharts.charts import Page # 调用画图库
from bs4 import BeautifulSoup # 可解析网页文件的库
import webbrowser # 可自动打开网页的库
def 制作初稿(): # 制作初稿
可视化大屏 = Page(page_title = '各人博客数据分析可视化展示——宣一名 2022-6-7') # 定义大屏、设置网页标签
可视化大屏.add( # 添加图表到可视化大屏
背景图片(图片网址),
主标题(主标题名称数据),
副标题(副标题名称数据),
热力图(课程安排数据),
散点图(学生编号数据,学生体温数据),
教室平均温度仪表盘(教室平均温度数据),
寝室平均温度仪表盘(寝室平均温度数据),
籍贯分布统计地图(籍贯分布数据),
性别比例环形图(性别比例数据),
考研意向水球图(考研意向数据),
年级人数统计条形图(年级名称数据,年级人数数据),
获奖统计柱状图(获奖统计数据,获奖等级数据),
成绩综合评价雷达图(学科分类,学科平均成绩),
)
可视化大屏.render('数据可视化大屏.html')
def 排版调试(): # 对去白边后的初稿排版
with open("数据可视化大屏.html", "r+", encoding='utf-8') as 可视化大屏: # 打开可视化大屏文件
大屏源代码 = BeautifulSoup(可视化大屏, 'lxml') # 解析本地html文件
图表 = 大屏源代码.select('.chart-container') # 定位初稿中的图表
图表[0]["style"] = f"width:{宽0};height:{高0}; position:absolute;top:0%;left:0%;" # 重新设置图表位置和大小
图表[1]["style"] = f"width:{宽1};height:{高1}; position:absolute;top:1%;left:25%;" # 重新设置图表位置和大小
图表[2]["style"] = f"width:{宽2};height:{高2}; position:absolute;top:3%;left:80%;" # 重新设置图表位置和大小
图表[3]["style"] = f"width:{宽3};height:{高3}; position:absolute;top:11%;left:1%;"
图表[4]["style"] = f"width:{宽4};height:{高4}; position:absolute;top:41%;left:1.25%;"
图表[5]["style"] = f"width:{宽5};height:{高5}; position:absolute;top:63%;left:1%;"
图表[6]["style"] = f"width:{宽6};height:{高6}; position:absolute;top:63%;left:14%;"
图表[7]["style"] = f"width:{宽7};height:{高7}; position:absolute;top:10%;left:25%;"
图表[8]["style"] = f"width:{宽8};height:{高8}; position:absolute;top:70%;left:33%;"
图表[9]["style"] = f"width:{宽9};height:{高9}; position:absolute;top:64%;left:50%;"
图表[10]["style"] = f"width:{宽10};height:{高10}; position:absolute;top:11%;left:70.5%;"
图表[11]["style"] = f"width:{宽11};height:{高11}; position:absolute;top:38%;left:70.5%;"
图表[12]["style"] = f"width:{宽12};height:{高12}; position:absolute;top:66%;left:75%;"
大屏源代码 = str(大屏源代码) # 将源代码转字符串格式
可视化大屏.seek(0) # 将光标移动到文件开头
可视化大屏.truncate() # 删除光标后所有内容
可视化大屏.write(大屏源代码) # 写入经过去白边的源代码
可视化大屏.close() # 保存关闭文件
def 去除白边(): # 去除大屏周围的白边
with open("数据可视化大屏.html", "r+", encoding='utf-8') as 可视化大屏: # 打开可视化大屏文件
大屏源代码 = BeautifulSoup(可视化大屏, 'lxml') # 解析本地html文件
大屏源代码 = str(大屏源代码) # 将源代码转字符串格式
大屏源代码 = 大屏源代码.replace('
','') # 删除产生白边的代码
大屏源代码 = 大屏源代码.replace('
','') # 删除产生白边的代码
大屏源代码 = 大屏源代码.replace('</head>','<style>img {display:block;}</style></head>') # 删除产生白边的代码
可视化大屏.seek(0) # 将光标移动到文件开头
可视化大屏.truncate() # 删除光标后所有内容
可视化大屏.write(大屏源代码) # 写入经过去白边的源代码
可视化大屏.close() # 保存关闭文件
def 自动启动(): # 自动启动大屏
webbrowser.open("数据可视化大屏.html")
if name == "main": # 执行整篇代码的入口
制作初稿()
排版调试()
去除白边()
自动启动()
课程安排热力图(课程安排数据)
体温统计散点图(学生编号数据,学生体温数据)
教室平均温度仪表盘(教室平均温度数据)
寝室平均温度仪表盘(寝室平均温度数据)
籍贯分布统计地图(籍贯分布数据)
性别比例环形图(性别比例数据)
考研意向水球图(考研意向数据)
年级人数统计条形图(年级名称数据,年级人数数据)
获奖统计柱状图(获奖统计数据,获奖等级数据)
成绩综合评价雷达图(学科分类,学科平均成绩)
版权归原作者 顺毛的仓仓 所有, 如有侵权,请联系我们删除。