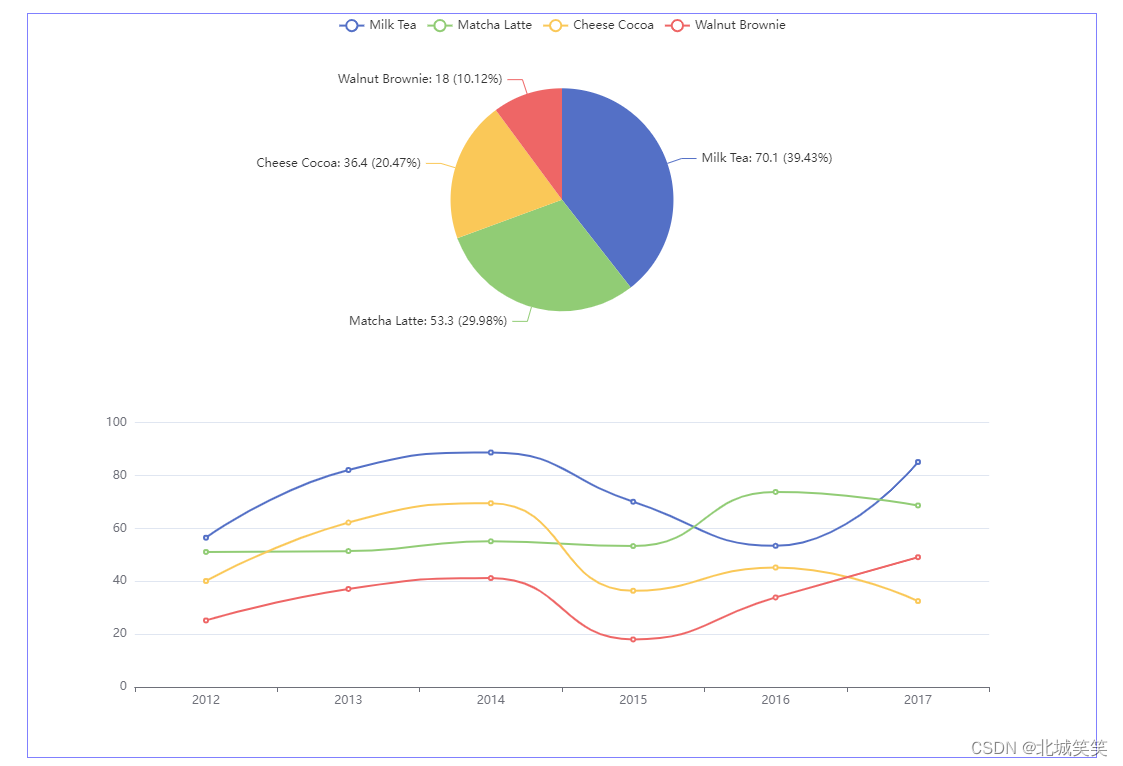
简述:我们在写大屏项目和vue项目时经常会用到echarts,用于数据统计和可视化,它是一款基于JavaScript的数据可视化图表库,提供直观,生动,可交互,可个性化定制的数据可视化图表,下面分享下它在项目中的使用方式;
1、安装,下载相关依赖(可用镜像cnpm);
npm install echarts --save

下载较慢时,可以使用镜像cnpm
cnpm install echarts --save
全局引入Echarts
import * as echarts from "echarts";

然后挂载在vue原型上
Vue.prototype.$echarts = echarts;
** 可按需引入 >>**
Echarts按需引入详细https://echarts.apache.org/handbook/zh/basics/import/https://echarts.apache.org/handbook/zh/basics/import/
3、在vue页面中使用;
** 3.1、首先定义一个容器,设置宽高,也就是echarts的大小(这一步很重要,一定要设置容器大小,不然显然不出来)**
定义一个容器
<template>
  <div id="echarts_demo"></div>
</template>

并设置大小
<style lang="scss" scoped>
#echarts_demo {
  width: 80%;
  height: 80vh;
  margin: auto;
  border: 1px solid #8080ff;
}
</style>
** 3.2、定义一个方法,在方法中获取容器实例,初始化echarts,并配置相关属性,然后在mounted函数中调用(注意这里调用时候使用的是this.$echarts.init,全局方法);**
methods: {
    定义一个echarts方法,把代码粘贴进去(官网实例有提供代码)
    defineEcharts() {
      获取容器实例
      var chartDom = document.getElementById("echarts_demo");
      赋值并初始化ecahrts
      var myChart = this.$echarts.init(chartDom);
      配置相关属性
      var option;
      setTimeout(function () {
        option = {
          legend: {},
          tooltip: {
            trigger: "axis",
            showContent: false,
          },
          dataset: {
            source: [
              ["product", "2012", "2013", "2014", "2015", "2016", "2017"],
              ["Milk Tea", 56.5, 82.1, 88.7, 70.1, 53.4, 85.1],
              ["Matcha Latte", 51.1, 51.4, 55.1, 53.3, 73.8, 68.7],
              ["Cheese Cocoa", 40.1, 62.2, 69.5, 36.4, 45.2, 32.5],
              ["Walnut Brownie", 25.2, 37.1, 41.2, 18, 33.9, 49.1],
            ],
          },
          xAxis: { type: "category" },
          yAxis: { gridIndex: 0 },
          grid: { top: "55%" },
          series: [
            {
              type: "line",
              smooth: true,
              seriesLayoutBy: "row",
              emphasis: { focus: "series" },
            },
            {
              type: "line",
              smooth: true,
              seriesLayoutBy: "row",
              emphasis: { focus: "series" },
            },
            {
              type: "line",
              smooth: true,
              seriesLayoutBy: "row",
              emphasis: { focus: "series" },
            },
            {
              type: "line",
              smooth: true,
              seriesLayoutBy: "row",
              emphasis: { focus: "series" },
            },
            {
              type: "pie",
              id: "pie",
              radius: "30%",
              center: ["50%", "25%"],
              emphasis: {
                focus: "self",
              },
              label: {
                formatter: "{b}: {@2012} ({d}%)",
              },
              encode: {
                itemName: "product",
                value: "2012",
                tooltip: "2012",
              },
            },
          ],
        };
        myChart.on("updateAxisPointer", function (event) {
          const xAxisInfo = event.axesInfo[0];
          if (xAxisInfo) {
            const dimension = xAxisInfo.value + 1;
            myChart.setOption({
              series: {
                id: "pie",
                label: {
                  formatter: "{b}: {@[" + dimension + "]} ({d}%)",
                },
                encode: {
                  value: dimension,
                  tooltip: dimension,
                },
              },
            });
          }
        });
        myChart.setOption(option);
      });
      option && myChart.setOption(option);

      // 给window添加resize监听事件,当平怒尺寸发生变化时重置
      window.addEventListener("resize", () => {
        myChart.resize();
      });

    },
  },

 mounted() {
    this.defineEcharts();
  },
4、实现的效果;

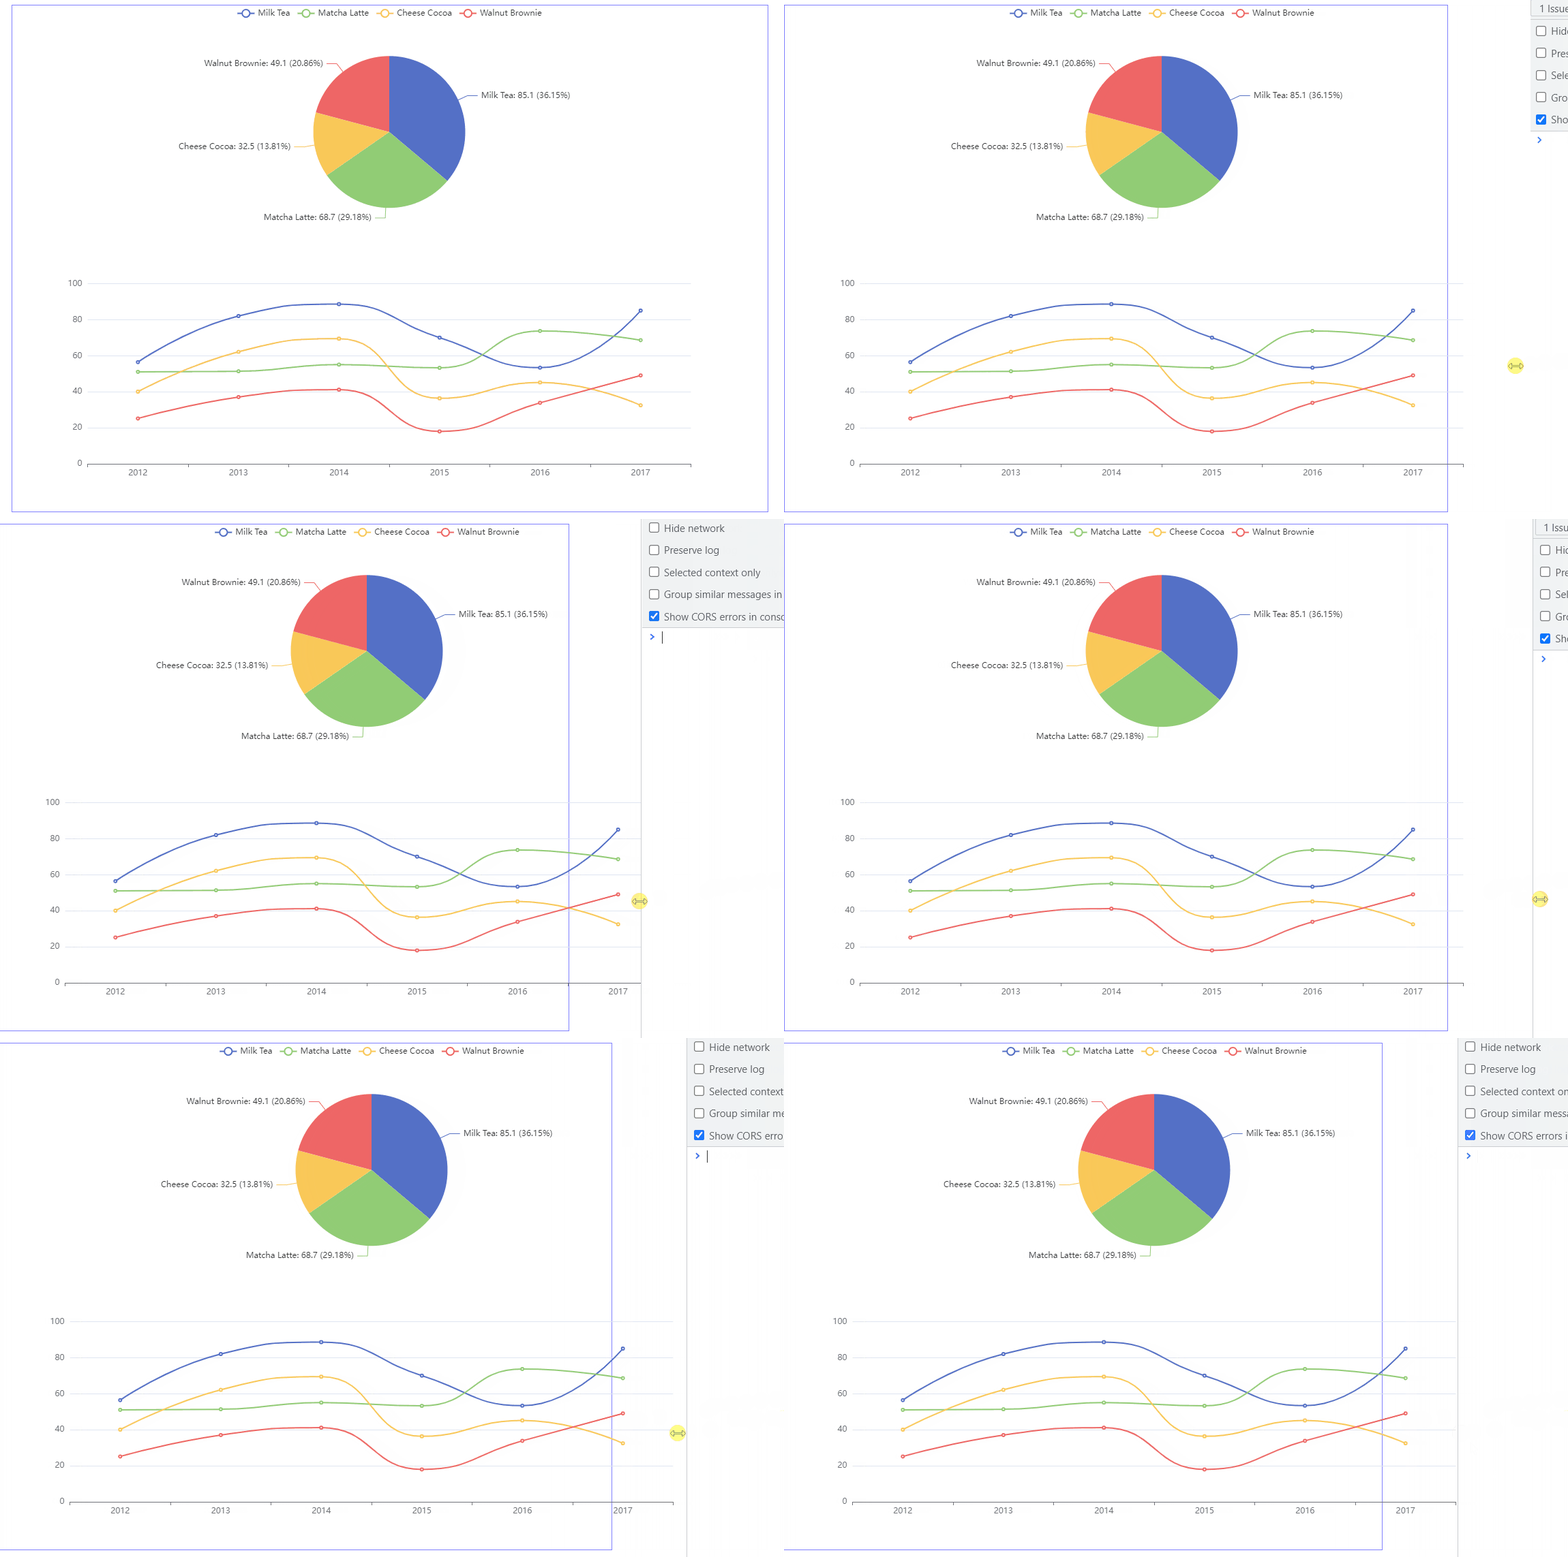
5、这里给echarts加上页面重置效果,就是当页面尺寸发生变化的时候,跟随页面大小变化而变化(也就是加一个监听事件resize,上面代码有提到);
option && myChart.setOption(option);

// 给window添加resize监听事件,当屏幕尺寸发生变化时重置
window.addEventListener("resize", () => {
    myChart.resize();
});
** 加监听事件之前:**

** 加监听事件之后:**

** 更多,Echarts大小重置,缩小等问题 >>**
更多操作 >>
Echarts官网https://echarts.apache.org/zh/index.htmlhttps://echarts.apache.org/zh/index.html
相关镜像(Echarts访问加速) >>
PPCharthttp://ppchart.com/#/
版权归原作者 北城笑笑 所有, 如有侵权,请联系我们删除。