
含dagre-d3 vis-network完整代码,复制即可用,样式自调
试过 jointjs dagre-d3
vis,好用一点,可添加同层的双向箭头
方法1:Vis.js
npm install vis-network
<template><divid="mynetwork"class="myChart":style="{width: '100%', height: '90vh'}"></div></template><scriptsetuplang="ts">import'vis-network/dist/dist/vis-network.min.css'import vis from'vis-network/dist/vis-network.min'import{ onMounted, ref }from'vue';onMounted(()=>{makeVis()})const mynetwork =ref()constmakeVis=()=>{var nodes =[// 每行加上shape: 'circle' ,则节点显示圆形{id:1,label:'Node 1'},{id:2,label:'Node 2'},{id:3,label:'Node 3'},{id:4,label:'Node 4'},{id:6,label:'Node 6'},{id:7,label:'Node 7'},{id:8,label:'Node 8'},{id:9,label:'Node 9'},{id:5,label:'Node 5'},]var edges =[// 每行加上label: '关系名称',则会在线中间显示节点关系名{from:1,to:3},{from:1,to:2},{from:2,to:4},{from:2,to:5},{from:6,to:5},{from:6,to:7},{from:8,to:6},{from:7,to:9},//{from: 2, to: 6},//{from: 6, to: 2},]var data ={nodes: nodes,edges: edges
  }var container = document.getElementById('mynetwork')var options ={nodes:{shape:'box',//设置节点node样式为矩形fixed:false,//节点node固定可移动font:{color:'red',//字体的颜色size:20,//显示字体大小},scaling:{min:16,max:32,//缩放效果比例},borderWidth:1,color:{border:'red',background:'white'// 若是引用图标,背景颜色}},// groups: {//   ws: { // 系统定义的形状 dot等 这些官网都可以找到//     shape: 'dot',//     color: 'white'//   }// },layout:{// randomSeed: 1, // 配置每次生成的节点位置都一样,参数为数字1、2等//以分层方式定位节点hierarchical:{direction:'UD',//分层排序方向sortMethod:'directed',//分层排序方法levelSeparation:100,//不同级别之间的距离nodeSpacing:200,// 节点之间的距离},},physics:{enabled:false,// 避免重叠hierarchicalRepulsion:{avoidOverlap:'1',},// barnesHut: { gravitationalConstant: -30000 },// barnesHut: {//   gravitationalConstant: -80000,//   springConstant: 0.001,//   springLength: 200// },// stabilization: false// { iterations: 2500 }},interaction:{// navigationButtons: true,hover:false,// 鼠标移过后加粗该节点和连接线selectConnectedEdges:false,// 选择节点后是否显示连接线hoverConnectedEdges:false,// 鼠标滑动节点后是否显示连接线tooltipDelay:200,dragNodes:false,// 是否能拖动节点dragView:true,// 是否能拖动画布zoomView:true// 是否能缩放画布},edges:{color:{// 连接线的样式color:'#848484',highlight:'white',hover:'#848484',inherit:'from',opacity:1.0},// font: {//   align: 'top', //连接线文字位置// },shadow:true,// 连接线阴影配置smooth:true// 是否连线平滑//arrows: {to : true }//是否显示方向箭头 箭头指向to节点}}const network =newvis.Network(container, data, options)
    network.on('click',(params)=>{
      console.log(params);})}</script>
效果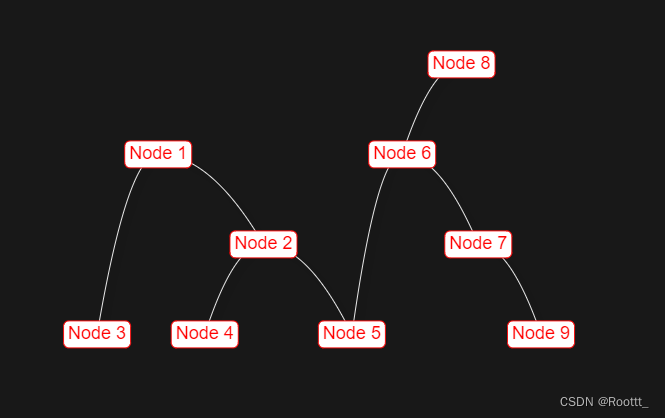
// 测试双向绑定 配置level
var nodes = [ // 每行加上shape: 'circle' ,则节点显示圆形
     {id: 1, label: 'Node 1',level: 1},
     {id: 2, label: 'Node 2',level: 2},
     {id: 3, label: 'Node 3',level: 4},
     {id: 4, label: 'Node 4',level: 4},
     {id: 6, label: 'Node 6',level: 2},
     {id: 7, label: 'Node 7',level: 3},
     {id: 8, label: 'Node 8',level: 4},
     {id: 9, label: 'Node 9',level: 4},
     {id: 5, label: 'Node 5',level: 3}
]
var edges = [ // 每行加上label: '关系名称',则会在线中间显示节点关系名
    {from: 1, to: 3},
    {from: 1, to: 2},
    {from: 2, to: 4},
    {from: 2, to: 5},
    {from: 2, to: 6},
    {from: 6, to: 2},
    {from: 6, to: 5},
    {from: 6, to: 7},
    {from: 6, to: 8},
    {from: 5, to: 8},
    {from: 7, to: 9},
]
//edges配置
//smooth: true // 是否连线平滑
arrows: {to : true }//是否显示方向箭头 箭头指向to节点
自定义节点样式
let newNodes = [] as any
nodes.map((item: any) => {
      const svg = `<svgxmlns="http://www.w3.org/2000/svg"width="120"height="50"><foreignObjectx="0"y="0"width="100%"height="100%"><divxmlns="http://www.w3.org/1999/xhtml"style="border:1px solid #0fb2cc;z-index:11;background-color: #FFF"><divstyle="height: 40px;">${item.label}</div></div></foreignObject></svg>`;
      const url = `data:image/svg+xml;charset=utf-8,${encodeURIComponent(svg)}`;
      newNodes.push({
        id: item.id,
        level: item.level,
        shape: "image",
        image: url
      })
})
var data = {
  nodes: newNodes,
  edges: edges
}
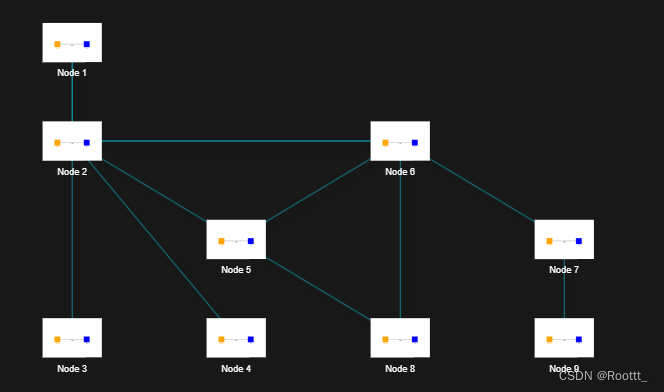
效果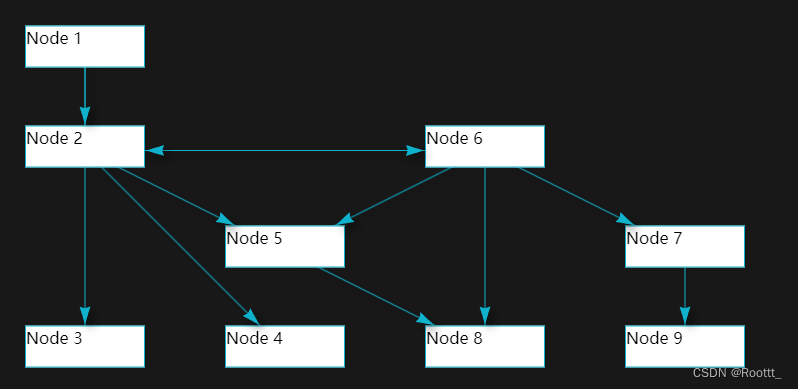
吐血,svg不能加img标签,没有显示,而且怀疑语法xmlns="http://www.w3.org/2000/svg"在生产环境无法使用,有些是不连外网的,换成下图,样式很局限
newNodes.push({
  id: item.id,
  label: item.label,
  level: item.level,
  shape: 'image',
  image: 'http://www.jtopo.com/assets/helloworld.DeMxEpoh.png',
  size: 30,
  font: {
    color: '#FFF'
  },
})
方法2 -dagre-d3
npm i d3@5.16.0
npm i dagre-d3@0.6.4
<template><div><svgclass="dagre"width="1500"height="800"><gclass="container"></g></svg></div></template><scriptsetuplang="ts">import{ ref, onMounted, watch }from"vue";import dagreD3 from"dagre-d3";import*as d3 from"d3";constdraw=()=>{var nodes =[// 每行加上shape: 'circle' ,则节点显示圆形{id:1,label:'Node 1'},{id:2,label:'Node 2'},{id:3,label:'Node 3'},{id:4,label:'Node 4'},{id:6,label:'Node 6'},{id:7,label:'Node 7'},{id:8,label:'Node 8'},{id:9,label:'Node 9'},{id:5,label:'Node 5'}]var edges =[// 每行加上label: '关系名称',则会在线中间显示节点关系名{from:1,to:3},{from:1,to:2},{from:2,to:4},{from:2,to:5},{from:6,to:5},{from:6,to:7},{from:8,to:6},{from:7,to:9},]// 创建 Graph 对象const g =newdagreD3.graphlib.Graph().setGraph({zoom:1,rankdir:"TB",// 流程图从下向上显示,默认'TB',可取值'TB'、'BT'、'LR'、'RL'// align: 'UL', //节点的对齐方式。有4个值: UL,UR,DL,DR。// acyclicer: 'greedy',//如果设置为贪婪模式(greedy), 则使用贪婪启发式来查找. 返回的弧设置是一组可以删除的线, 从而使图无环.//ranker: "network-simplex",//连线算法// nodesep: 120, //水平方向上, 分隔节点的距离(节点之间的间距)// edgesep: 100,//在水平方向上, 线段间的距离// ranksep: 50,//每个层级间的距离// marginx: 200,//图形左右边缘的距离// marginy: 20,//图形上下边缘的距离}).setDefaultEdgeLabel(function(){return{};});
  nodes.forEach((node)=>{
    g.setNode(node.id,{id: node.id,label:`<foreignObject id='${node.id}'>
        <div id='${node.id}'>
         <span>${node.label}</span>
        </div>
        </foreignObject>`,//node.nodeName,labelType:"html",shape:"rect",//节点形状,可以设置rect(长方形),circle,ellipse(椭圆),diamond(菱形) 四种形状,还可以使用render.shapes()自定义形状style:"fill:#333;stroke:#a0cfff;stroke-width: 2px;",//节点样式,可设置节点的颜色填充、节点边框labelStyle:"fill: #ddd;font-weight:bold;",//节点标签样式, 可设置节点标签的文本样式(颜色、粗细、大小)rx:5,// 设置圆角ry:5,// 设置圆角// paddingBottom: 0,// paddingLeft: 0,// paddingRight: 0,// paddingTop: 0,`});});// Graph添加节点之间的连线if(nodes.length >1){
    edges.forEach((edge)=>{
      g.setEdge(edge.from, edge.to,{// curve: d3.curveBasis , //d3.curveBasis 贝塞尔曲线  curveStepBefore直线style:"stroke: #0fb2cc; fill: none; stroke-width: 1px",// 连线样式arrowheadStyle:"fill: #0fb2cc;stroke: #0fb2cc;",//箭头样式,可以设置箭头颜色arrowhead:"vee",//箭头形状,可以设置 normal,vee,undirected 三种样式,默认为 normal});});}// 获取要绘制流程图的绘图容器const container = d3.select("svg.dagre").select("g.container");// 创建渲染器const render =newdagreD3.render();// 在绘图容器上运行渲染器绘制流程图render(container, g);let svg = d3.select('svg.dagre')// 建立拖拽缩放let zoom = d3.zoom().on("zoom",function(){
      container.attr("transform", d3.event.transform);});svg.call(zoom);};onMounted(()=>{draw();});</script>
效果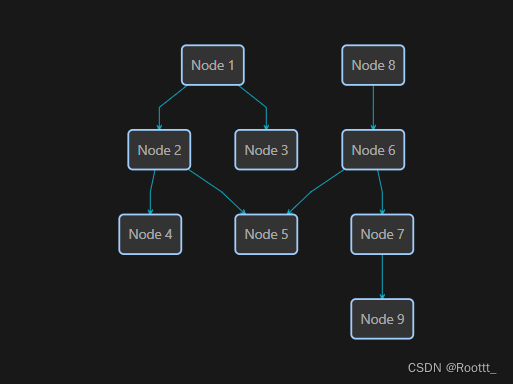
标签:
前端
typescript
本文转载自: https://blog.csdn.net/weixin_43896125/article/details/139330152
版权归原作者 Roottt_ 所有, 如有侵权,请联系我们删除。
版权归原作者 Roottt_ 所有, 如有侵权,请联系我们删除。