我们知道gdb的实现原理就是利用ptrace,关于ptrace我就不多介绍了,主要看怎么利用它去hook
首先,利用ptrace可以给被调试进程下断点,也可以改其寄存器,和opcode,我们利用这点可以实现一个简易的调试器,那么我们如果把实现调试器时插入的0xcc字节码换成我们想要执行的hook函数会发生什么呢?
比如我们加入个
hello world
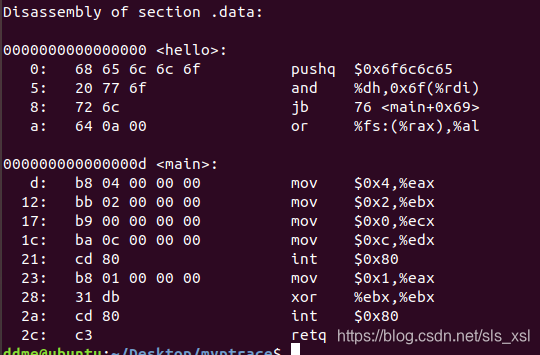
首先我们要得到对应的字节码,可以通过写c,编译,后反汇编得到,也可以直接写汇编,编译再反汇编
.data
hello:.string "hello world\n".globl  main
main:
    movl    $4,%eax
    movl    $2,%ebx
    movl    $hello,%ecx
    movl    $12,%edx
    int     $0x80
    movl    $1,%eax
    xorl    %ebx,%ebx
    int     $0x80
    ret
编译出-o文件
gcc -c 1.s -o 1.o
然后用objdump -D 1.o 来得到字节码,要D,不能d
ok,那么剩下就是插入这段代码了,在这之前说一下插入断点是怎么做到的
我们看看ptrace的定义
PTRACE(2)                                Linux Programmer's Manual                               PTRACE(2)

NAME
       ptrace - process trace

SYNOPSIS
       #include<sys/ptrace.h>longptrace(enum __ptrace_request request, pid_t pid,void*addr,void*data);

DESCRIPTION
       The  ptrace() system call provides a means by which one process (the "tracer") may observe and con‐
       trol the execution of another process (the "tracee"), and examine and change  the  tracee's  memory
       and registers.  It is primarily used to implement breakpoint debugging and system call tracing.

       A  tracee  first  needs  to  be attached to the tracer.  Attachment and subsequent commands are per
       thread: in a multithreaded process, every thread can be individually  attached  to  a  (potentially
       different)  tracer,  or  left not attached and thus not debugged.  Therefore,"tracee" always means
       "(one) thread", never "a (possibly multithreaded) process".  Ptrace commands are always sent  to  a
       specific tracee using a call of the form
看看参数
        PTRACE_TRACEME
              Indicate that this process is to be traced by its parent.  A process probably shouldn't make
              this request if its parent isn't expecting to trace it.  (pid, addr, and data are ignored.)

              The PTRACE_TRACEME request is used only by the tracee; the remaining requests are used  only
              by  the  tracer.  In the following requests, pid specifies the thread ID of the tracee to be
              acted on.  For  requests  other  than  PTRACE_ATTACH,  PTRACE_SEIZE,  PTRACE_INTERRUPT,  and
              PTRACE_KILL, the tracee must be stopped.

       PTRACE_PEEKTEXT, PTRACE_PEEKDATA
              Read  a word at the address addr in the tracee's memory, returning the word as the result of
              the ptrace() call.  Linux does not have separate text and data address spaces, so these  two
              requests are currently equivalent.  (data is ignored; but see NOTES.)

       PTRACE_PEEKUSER
              Read  a  word  at offset addr in the tracee's USER area, which holds the registers and other
              information about the process (see <sys/user.h>).  The word is returned as the result of the
              ptrace() call.  Typically, the offset must be word-aligned, though this might vary by archi‐
              tecture.  See NOTES.  (data is ignored; but see NOTES.)
            PTRACE_POKETEXT, PTRACE_POKEDATA
              Copy the word data to the address addr in the tracee's memory.  As for  PTRACE_PEEKTEXT  and
              PTRACE_PEEKDATA, these two requests are currently equivalent.

       PTRACE_POKEUSER
              Copy  the  word  data to offset addr in the tracee's USER area.  As for PTRACE_PEEKUSER, the
              offset must typically be word-aligned.  In order to maintain the integrity  of  the  kernel,
              some modifications to the USER area are disallowed.

       PTRACE_GETREGS, PTRACE_GETFPREGS
              Copy  the tracee's general-purpose or floating-point registers, respectively, to the address
              data in the tracer.  See <sys/user.h> for information on the format of this data.  (addr  is
              ignored.)  Note that SPARC systems have the meaning of data and addr reversed; that is, data
              is  ignored  and  the  registers  are  copied  to  the  address  addr.   PTRACE_GETREGS  and
              PTRACE_GETFPREGS are not present on all architectures.

       PTRACE_GETREGSET (since Linux 2.6.34)
              Read  the tracee's registers.  addr specifies, in an architecture-dependent way, the type of
              registers to be read.  NT_PRSTATUS (with numerical value 1) usually results  in  reading  of
              general-purpose registers.  If the CPU has, for example, floating-point and/or vector regis‐
              ters, they can be retrieved by setting addr to  the  corresponding  NT_foo  constant.   data
              points  to a struct iovec, which describes the destination buffer's location and length.  On
              return, the kernel modifies iov.len to indicate the actual number of bytes returned.
太多了,不贴了,重点有那么几个
PTRACE_TRACEME, PTRACE_CONT, PTRACE_ATTACH, PTRACE_GETREGS, PTRACE_SETREGS, PTRACE_POKEDATA, PTRACE_PEEKDATA
那么我挑几个解释一下,
TRACEME是指定当前进程处于被调试状态,那么是哪个进程调试他呢?答案是他的父进程,也就是说,当我们在一个进程种fork出一个子进程后,如果子进程内调用ptrace,并带上此参数那么就可以在父进程处通过ptrace的其他参数得到子进程的运行状态
ATTACH 是指,当我们有一个正在运行的进程时,想要调试他就在另一个进程中用此参数,加上pid即可调试另一进程
GETREGS/SETREGS看名字也能猜出来,是设置被调试进程的寄存器值的,想想,如果我们改变他的eip,那我们不就可以为所欲为了吗
POKEDATA/PEEKDATA输入数据和输出数据,这个输入数据是指,在被调试进程的指定地址处,输入一些数据,通过这个,我们可以输入一些opcode,再改eip指向这些opcode,那么我们就能让被调试进程执行原本没有的代码,同样的我们也可以设置断点,改为0xcc就行
CONT 被调试进程继续运行
那么现在武器就齐全了,我们可以开工了,为了方便讲解,我就把单个函数拿出来讲
保存原来的数据
voidgetdata(pid_t child,long addr,char*str,int len){char*laddr;int i,j;union{long val;char chars[LONGSIZE];}data;
    i =0;
    j = len/LONGSIZE;
    laddr = str;while(i < j){
        data.val =ptrace(PTRACE_PEEKDATA, child, addr + i *4,NULL);memcpy(laddr, data.chars, LONGSIZE);++i;
        laddr += LONGSIZE;}if(len % LONGSIZE !=0){// save the remainder, which less than LONGSIZE
        data.val =ptrace(PTRACE_PEEKDATA, child, addr + i *4,NULL);memcpy(laddr, data.chars, len % LONGSIZE);}
    str[len]='\0';}
因为对于断点来说,破坏了原来的字节码,所以如果中断后想继续运行,就要把opcode恢复,那么我们就把原本的opcode保存下来,等恢复
另外其中
if(j!=0)
那句,注释写清楚了,以防不爱看英文的同学不乐意,我再说一下,就是不一定字节码正好是LONGSIZE的整数倍,拿缓存来说,一共1010字节的文件,一次读取500字节存缓存里,那么两次之后还有10字节,此时就是if里的情况了
改变字节码
voidputdata(pid_t child,long addr,char*str,int len){char*laddr;int i, j;union u {long val;char chars[LONGSIZE];}data;
    i =0;
    j = len/LONGSIZE;
    laddr = str;while(i < j){memcpy(data.chars, laddr, LONGSIZE);ptrace(PTRACE_POKEDATA, child,
               addr + i *4, data.val);++i;
        laddr += LONGSIZE;}
    j = len % LONGSIZE;if(j !=0){memcpy(data.chars, laddr, j);ptrace(PTRACE_POKEDATA, child,
               addr + i *4, data.val);}}
和上面的很类似,就是把数据放被调试进程里
下面是主体流程,freespaceaddr是另外一个函数,但是我选则执行的opcode回造成栈不平衡,要在几条opcode,把插入的指令放到原本指令上,再把原来指令回复回来就行,原理明白的差不读多了,改改opcode就行,先凑合看吧,有空了再实现一个复杂点的
#include<sys/ptrace.h>#include<sys/types.h>#include<sys/wait.h>#include<unistd.h>#include<sys/user.h>#include<stdio.h>#define LONGSIZE sizeof(long)intmain(int argc,char*argv[]){
pid_t traced_process;struct user_regs_struct regs, oldregs;long ins;char insertcode[]="\x68\x65\x6c\x6c\x6f\x20\x77\x6f""\x72\x6c\x64\x0a\x00\xb8\x04\x00""\x00\x00\xbb\x02\x00\x00\x00\xb9""\x00\x00\x00\x00\xba\x0c\x00\x00""\x00\xcd\x80\xb8\x01\x00\x00\x00""\x31\xdb\xcd\x80\xc3";char code[]={0xcd,0x80,0xcc,0};char backup[4];long addr;if(argc !=2){printf("Usage: %s <pid to be traced>\n",
argv[0], argv[1]);exit(1);}
traced_process =atoi(argv[1]);ptrace(PTRACE_ATTACH, traced_process,NULL,NULL);wait(NULL);/* get the rip and for reback */ptrace(PTRACE_GETREGS, traced_process,NULL,®s);
addr =freespaceaddr(traced_process);puts(addr);/* copy instruction for reback */getdata(traced_process, regs.rip, backup,45);/* inject the breakpoint */putdata(traced_process, regs.rip, insertcode,45);/* back the rip */memcpy(&oldregs,®s,sizeof(regs));
regs.rip = addr;ptrace(PTRACE_SETREGS, traced_process,NULL,®s);/* Let the process continue and execute
the int 3 instruction */ptrace(PTRACE_CONT, traced_process,NULL,NULL);wait(NULL);printf("The process stopped, putting back\n");printf("Press <enter> to continue\n");getchar();putdata(traced_process, regs.rip, backup,3);/* Setting the rip back to the original
instruction to let the process continue */ptrace(PTRACE_SETREGS, traced_process,NULL,&oldregs);ptrace(PTRACE_DETACH, traced_process,NULL,NULL);return0;}
版权归原作者 ret2ddme 所有, 如有侵权,请联系我们删除。