
自动构建用于时间序列异常值检测的机器学习管道。

时间序列异常值检测旨在识别数据中意外或罕见的实例。作为数据分析最重要的任务之一,异常值检测在时间序列数据上有多种应用,例如欺诈检测、故障检测和网络安全攻击检测。例如,雅虎 [1] 和微软 [2] 已经建立了自己的时间序列异常值检测服务来监控他们的业务数据并触发异常值警报。在时间序列数据上,异常值可以分为三种情况:逐点异常值、模式(集体)异常值和系统异常值。
在本文中,我想介绍一个开源项目,用于构建机器学习管道以检测时间序列数据中的异常值。本文将简要介绍三种常见的异常值以及相应的检测策略。然后将提供基于两个支持的 API 的示例代码:用于开发时间序列异常值检测管道的 TODS API 和用于使用第三方包进行实验的 scikit-learn API。
概述
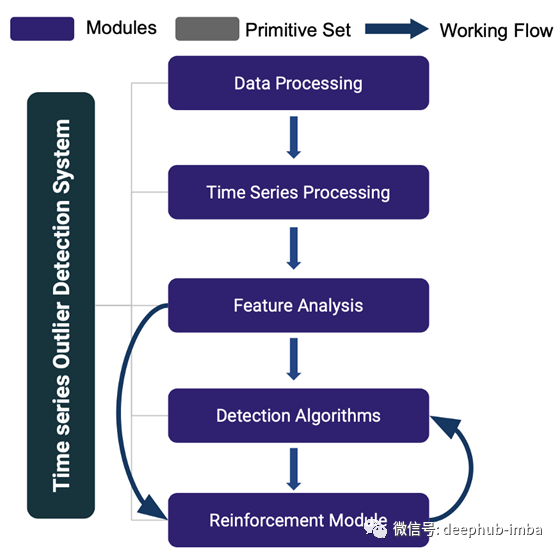
TODS [3] 是一个全栈机器学习系统,用于对多元时间序列数据进行异常值检测。TODS 为构建基于机器学习的异常值检测系统提供了详尽的模块,包括:数据处理、时间序列处理、特征分析、检测算法和强化模块。通过这些模块提供的功能包括:通用数据预处理、时间序列数据平滑/转换、从时域/频域中提取特征、各种检测算法,以及涉及人类专业知识来校准系统。可以对时间序列数据执行三种常见的异常值检测场景:逐点检测(时间点作为异常值)、模式检测(子序列作为异常值)和系统检测(时间序列集作为异常值)。
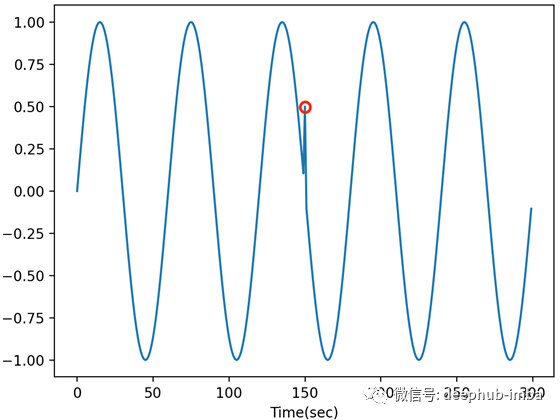
当时间序列中存在潜在的系统故障或小故障时,通常会出现逐点异常值。这种异常值存在于全局(与整个时间序列中的数据点相比)或局部(与相邻点相比)的单个数据点上。全局异常值通常很明显,检测全局异常值的常见做法是获取数据集的统计值(例如,最小值/最大值/平均值/标准偏差)并设置检测异常点的阈值。局部异常值通常出现在特定上下文中,具有相同值的数据点如果不在特定上下文中显示,则不会被识别为异常值。检测局部异常值的常用策略是识别上下文(通过季节性趋势分解、自相关),然后应用统计/机器学习方法(例如 AutoRegression、IsolationForest、OneClassSVM)来检测异常值。
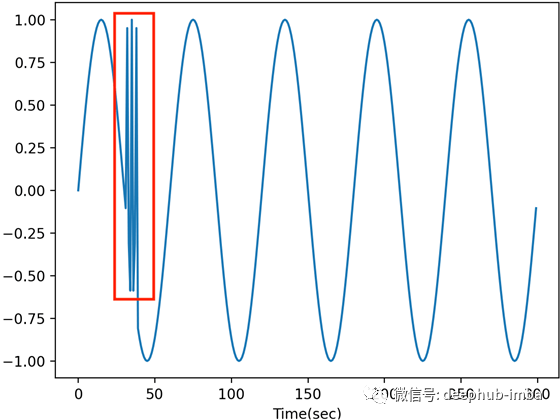
当数据中存在异常行为时,通常会出现模式异常值。模式异常值是指与其他子序列相比其行为异常的时间序列数据的子序列(连续点)。检测模式异常值的常见做法,包括不和谐分析(例如,矩阵配置文件 [6]、HotSAX [7])和子序列聚类 [4]。Discords 分析利用滑动窗口将时间序列分割成多个子序列,并计算子序列之间的距离(例如,欧几里德距离)以找到时间序列数据中的不一致。子序列聚类也将子序列分割应用于时间序列数据,并采用子序列作为每个时间点的特征,其中滑动窗口的大小为特征的数量。然后,采用无监督机器学习方法,例如聚类(例如,KMeans、PCA)或逐点异常值检测算法来检测模式异常值。
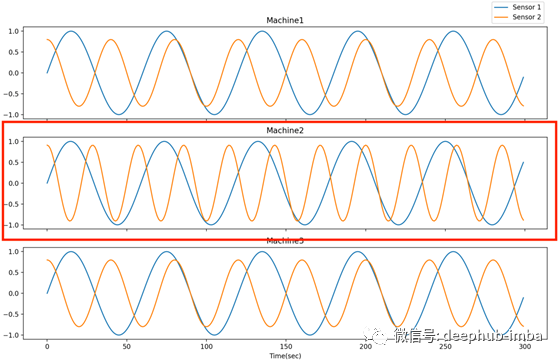
当许多系统之一处于异常状态时,系统异常值会不断发生,其中系统被定义为多元时间序列数据。检测系统异常值的目标是从许多类似的系统中找出处于异常状态的系统。例如,从具有多条生产线的工厂检测异常生产线。检测这种异常值的常用方法是执行逐点和模式异常值检测以获得每个时间点/子序列的异常值分数,然后采用集成技术为每个系统生成整体异常值分数以进行比较和检测。
通过 Scikit-learn API 进行实验
在构建机器学习管道的开始,需要进行大量实验来调整或分析算法。在 TODS 中,Scikit-learn 类似 API 可用于大多数模块,允许用户灵活地将单个函数调用到实验脚本中。这是一个调用矩阵配置文件的示例,用于使用 UCR 数据集识别模式异常值 [5]。
 import numpy as np
 from tods.sk_interface.detection_algorithm.MatrixProfile_skinterface import MatrixProfileSKI
 from sklearn.metrics import precision_recall_curve
 from sklearn.metrics import accuracy_score
 from sklearn.metrics import confusion_matrix
 from sklearn.metrics import classification_report

 #prepare the data
 data = np.loadtxt("./500_UCR_Anomaly_robotDOG1_10000_19280_19360.txt")

 X_train = np.expand_dims(data[:10000], axis=1)
 X_test = np.expand_dims(data[10000:], axis=1)

 transformer = MatrixProfileSKI()
 transformer.fit(X_train)
 prediction_labels_train = transformer.predict(X_train)
 prediction_labels = transformer.predict(X_test)
 prediction_score = transformer.predict_score(X_test)

 y_true = prediction_labels_train
 y_pred = prediction_labels

 print('Accuracy Score: ', accuracy_score(y_true, y_pred))

 confusion_matrix(y_true, y_pred)

 print(classification_report(y_true, y_pred))
结果如下:
 Accuracy Score:  0.89
     precision    recall  f1-score   support
 0       0.90      0.98      0.94      9005
 1       0.21      0.04      0.06       995

 accuracy                               0.89     10000
    macro avg       0.55      0.51      0.50     10000
 weighted avg       0.83      0.89      0.85     10000
使用 TODS API 构建管道
在管道探索的后期阶段,需要在没有开发工作的情况下以可重复的方式管理实验,因为会有更多的超参数和组件组合。在 TODS 中,我们的管道构建和执行 API 允许用户使用单个脚本生成各种可重现的管道。生成的管道将存储为 .json 或 .yml 文件等类型的描述文件,这些文件可以轻松地使用不同的数据集进行复制/执行以及共享给同事。下面的示例利用 TODS API 以 .json 格式建立自动编码器管道,并使用 TODS 后端引擎运行管道以检测雅虎网络入侵数据集中的点异常值 [1]。
Step1:生成管道描述文件管道生成脚本提供如下。虽然它看起来比 Scikit-learn 界面更长,但用户可以轻松地添加带有候选的超参数
 from d3m import index
 from d3m.metadata.base import ArgumentType
 from d3m.metadata.pipeline import Pipeline, PrimitiveStep

 # Creating pipeline
 pipeline_description = Pipeline()
 pipeline_description.add_input(name='inputs')

 # Step 0: dataset_to_dataframe
 step_0 = PrimitiveStep(primitive=index.get_primitive('d3m.primitives.tods.data_processing.dataset_to_dataframe'))
 step_0.add_argument(name='inputs', argument_type=ArgumentType.CONTAINER, data_reference='inputs.0')
 step_0.add_output('produce')
 pipeline_description.add_step(step_0)

 # Step 1: column_parser
 step_1 = PrimitiveStep(primitive=index.get_primitive('d3m.primitives.tods.data_processing.column_parser'))
 step_1.add_argument(name='inputs', argument_type=ArgumentType.CONTAINER, data_reference='steps.0.produce')
 step_1.add_output('produce')
 pipeline_description.add_step(step_1)

 # Step 2: extract_columns_by_semantic_types(attributes)
 step_2 = PrimitiveStep(primitive=index.get_primitive('d3m.primitives.tods.data_processing.extract_columns_by_semantic_types'))
 step_2.add_argument(name='inputs', argument_type=ArgumentType.CONTAINER, data_reference='steps.1.produce')
 step_2.add_output('produce')
 step_2.add_hyperparameter(name='semantic_types', argument_type=ArgumentType.VALUE,
   data=['https://metadata.datadrivendiscovery.org/types/Attribute'])
 pipeline_description.add_step(step_2)

 # Step 3: extract_columns_by_semantic_types(targets)
 step_3 = PrimitiveStep(primitive=index.get_primitive('d3m.primitives.tods.data_processing.extract_columns_by_semantic_types'))
 step_3.add_argument(name='inputs', argument_type=ArgumentType.CONTAINER, data_reference='steps.0.produce')
 step_3.add_output('produce')
 step_3.add_hyperparameter(name='semantic_types', argument_type=ArgumentType.VALUE,
 data=['https://metadata.datadrivendiscovery.org/types/TrueTarget'])
 pipeline_description.add_step(step_3)

 attributes = 'steps.2.produce'
 targets = 'steps.3.produce'

 # Step 4: processing
 step_4 = PrimitiveStep(primitive=index.get_primitive('d3m.primitives.tods.timeseries_processing.transformation.axiswise_scaler'))
 step_4.add_argument(name='inputs', argument_type=ArgumentType.CONTAINER, data_reference=attributes)
 step_4.add_output('produce')
 pipeline_description.add_step(step_4)

 # Step 5: algorithm`
 step_5 = PrimitiveStep(primitive=index.get_primitive('d3m.primitives.tods.detection_algorithm.pyod_ae'))
 step_5.add_argument(name='inputs', argument_type=ArgumentType.CONTAINER, data_reference='steps.4.produce')
 step_5.add_output('produce')
 pipeline_description.add_step(step_5)

 # Step 6: Predictions
 step_6 = PrimitiveStep(primitive=index.get_primitive('d3m.primitives.tods.data_processing.construct_predictions'))
 step_6.add_argument(name='inputs', argument_type=ArgumentType.CONTAINER, data_reference='steps.5.produce')
 step_6.add_argument(name='reference', argument_type=ArgumentType.CONTAINER, data_reference='steps.1.produce')
 step_6.add_output('produce')
 pipeline_description.add_step(step_6)

 # Final Output
 pipeline_description.add_output(name='output predictions', data_reference='steps.6.produce')

 # Output to json
 data = pipeline_description.to_json()
 with open('autoencoder_pipeline.json', 'w') as f:
     f.write(data)
     print(data)
Step2:运行管道
创建管道描述文件后,我们可以按如下方式运行管道描述文件并评估无监督管道:
 import sys
 import argparse
 import os
 import pandas as pd

 from tods import generate_dataset, load_pipeline, evaluate_pipeline

 this_path = os.path.dirname(os.path.abspath(__file__))
 table_path = os.path.join(this_path, '../../datasets/anomaly/raw_data/yahoo_sub_5.csv') # file path to the dataset
 target_index = 6 # which column is the label
 pipeline_path = "./autoencoder_pipeline.json"
 metric = "ALL"

 # Read data and generate dataset
 df = pd.read_csv(table_path)
 dataset = generate_dataset(df, target_index)

 # Load the default pipeline
 pipeline = load_pipeline(pipeline_path)

 # Run the pipeline
 pipeline_result = evaluate_pipeline(dataset, pipeline, metric)
 print(pipeline_result.scores)
虽然这个API需要一个脚本来生成管道描述文件,但它提供了灵活的接口来生成多个管道。
带有标签信息的自动模型发现
除了手动创建管道之外,TODS 还利用 TODS API 提供自动模型发现。自动模型发现的目标旨在根据验证集中的标签信息和给定的计算时间限制搜索最佳管道。
 import pandas as pd
 from axolotl.backend.simple import SimpleRunner
 from tods import generate_dataset, generate_problem
 from tods.searcher import BruteForceSearch

 table_path = '../../datasets/anomaly/raw_data/yahoo_sub_5.csv'
 target_index = 6 # what column is the target
 time_limit = 30 # How many seconds you wanna search

 metric = 'F1_MACRO' # F1 on label 1

 # Read data and generate dataset and problem
 df = pd.read_csv(table_path)
 dataset = generate_dataset(df, target_index=target_index)
 problem_description = generate_problem(dataset, metric)

 # Start backend
 backend = SimpleRunner(random_seed=0)

 # Start search algorithm
 search = BruteForceSearch(problem_description=problem_description,
                           backend=backend)

 # Find the best pipeline
 best_runtime, best_pipeline_result = search.search_fit(input_data=[dataset], time_limit=time_limit)
 best_pipeline = best_runtime.pipeline
 best_output = best_pipeline_result.output

 # Evaluate the best pipeline
 best_scores = search.evaluate(best_pipeline).scores


 print('*' * 52)
 print('Search History:')
 for pipeline_result in search.history:
     print('-' * 52)
     print('Pipeline id:', pipeline_result.pipeline.id)
     print(pipeline_result.scores)
 print('*' * 52)

 print('')

 print('*' * 52)
 print('Best pipeline:')
 print('-' * 52)
 print('Pipeline id:', best_pipeline.id)
 print('Pipeline json:', best_pipeline.to_json())
 print('Output:')
 print(best_output)
 print('Scores:')
 print(best_scores)
 print('*' * 52)
管道搜索完成后,用户可以通过管道id访问所有搜索到的管道,并保存任何管道描述文件以供后续使用。更多细节可以在官方演示 jupyter notebook 中找到。https://github.com/datamllab/tods/blob/master/examples/Demo%20Notebook/TODS%20Official%20Demo%20Notebook.ipynb
总结
该项目团队正在为该项目积极开发更多功能,包括带有可视化工具的图形用户界面、半监督学习算法和高级管道搜索器。目标是使时间序列数据的异常值检测变得可访问且更容易。我希望你喜欢阅读这篇文章,在接下来的文章中,我将详细介绍在时间序列数据中检测不同类型异常值的常见策略,并介绍 TODS 中具有合成标准的数据合成器。
引用
[1] Thill, Markus, Wolfgang Konen, and Thomas Bäck. “Online anomaly detection on the webscope S5 dataset: A comparative study.” 2017 Evolving and Adaptive Intelligent Systems (EAIS). IEEE, 2017.[2] Ren, Hansheng, et al. “Time-series anomaly detection service at microsoft.” Proceedings of the 25th ACM SIGKDD International Conference on Knowledge Discovery & Data Mining. 2019.[3] Lai, K.-H., Zha, D., Wang, G., Xu, J., Zhao, Y., Kumar, D., Chen, Y., Zumkhawaka, P., Wan, M., Martinez, D., & Hu, X. (2021). TODS: An Automated Time Series Outlier Detection System. Proceedings of the AAAI Conference on Artificial Intelligence, 35(18), 16060–16062.[4] Keogh, Eamonn, et al. “Segmenting time series: A survey and novel approach.” Data mining in time series databases. 2004. 1–21[5] https://wu.renjie.im/research/anomaly-benchmarks-are-flawed/arxiv/[6] Yeh, Chin-Chia Michael, et al. “Matrix profile I: all pairs similarity joins for time series: a unifying view that includes motifs, discords and shapelets.” 2016 IEEE 16th international conference on data mining (ICDM). Ieee, 2016.[7] Keogh, Eamonn, Jessica Lin, and Ada Fu. “Hot sax: Efficiently finding the most unusual time series subsequence.” Fifth IEEE International Conference on Data Mining (ICDM’05). Ieee, 2005.
本文作者:Henry Lai
原文地址:https://towardsdatascience.com/tods-detecting-outliers-from-time-series-data-2d4bd2e91381