
最近项目涉及好几种echarts的图表,特此记录一下
涉及点:横向柱状图、不显示x轴标签、柱子渐变色、数量及单位显示在柱子内部。
效果图: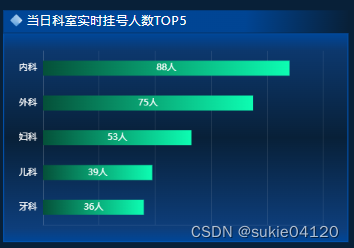
echarts配置:option我是放置在data内部,然后再动态获取y轴和数值(series)的数据再进行图表的渲染
option: {
    tooltip: {
        trigger: 'axis',
        axisPointer: {
        type: 'shadow'
        }
    },
    grid: {
        left: 0,
        top: '8%',
        right: '3%',
        bottom: '8%',
        containLabel: true
    },
    xAxis: {
        type: 'value',
        axisLabel: {
            show: false // 不显示x轴标签
        },
        axisLine: {
            // x轴线的颜色以及宽度
            show: true,
            lineStyle: {color: 'rgba(255,255,255,0.1)'}
            },
        axisTick: {
            show: false // x轴刻度线
        },
        splitLine: { // x轴网格线
            show: true,
                lineStyle: {color: 'rgba(255,255,255,0.1)'}
            }
        },
        yAxis: {
            type: 'category',
            axisTick: { show: false }, // y轴刻度线
            axisLabel: { color: '#fff' }, // y轴文字的配置
            axisLine: {
                //x轴线的颜色
                show: true,
                lineStyle: {color: 'rgba(255,255,255,0.1)'}
            },
            data: ['内科','外科','妇科','儿科','牙科']
        },
        series: [
            {
            name: '人数',
            type: 'bar',
            stack: '总量',
            label: {
                normal: {
                    show: true,
                    position: 'inside', //显示在柱子内部
                    textStyle: { color: '#fff' },
                    formatter: '{c}人' //单位
                }
            },
            itemStyle: {
                color: {
                    colorStops:[ //柱子的渐变色
                    {
                        offset: 0,
                        color: 'rgba(5, 80, 57, 1)' // 0% 处的颜色
                    },
                    {
                        offset: 1,
                        color: 'rgba(13, 253, 178, 1)' // 100% 处的颜色
                    }
                    ],
                global: false
                }
            },
            barWidth: 20, //柱子的宽度
            data: [88,75,53,39,36]
          }
    ]
}
渲染图表方法及HTML:
//html:
    <div class="echartDiv" ref="chart"></div>

//方法(渲染图表):
    initEcharts() {
            this.myChart && this.myChart.dispose();
            let chartDom = this.$refs.chart;
            this.myChart = echarts.init(chartDom);
            this.myChart.setOption(this.option);
            let that = this;
            window.addEventListener('resize', function() {
                that.myChart.resize();
            });
        },
本文转载自: https://blog.csdn.net/qq_40905132/article/details/129206456
版权归原作者 sukie04120 所有, 如有侵权,请联系我们删除。
版权归原作者 sukie04120 所有, 如有侵权,请联系我们删除。