完整数据及代码:数学建模+时间序列预测+LSTM+股票数据分析-机器学习文档类资源-CSDN下载
1.数据概况
股票数据由代码、简称、时间、开盘价、收盘价、最高价、最低价、前收盘价、成交量、成交金额、PE、市净率、换手率组成,其中,代码、简称、时间不用于建模,PE、市净率、换手率数据类型为object,需要转换成float.


2.数据可视化
    我们建立5日均线数据和10日均线数据进行数据可视化, 由于数据有2433条,无法全部展示,因此,我们只展示绘制2020年11月9日-2021年4月1日的上证指数股票日K线图。

     可以看出,股价波动还是比较大的
plt.rcParams['font.sans-serif'] = ['SimHei']  # 用来正常显示中文标签

plt.rcParams['axes.unicode_minus'] = False  # 用来正常显示负号

ax,graph_SH = plt.subplots(figsize=(15, 6))  # 创建fig对象

mpf.candlestick2_ochl(graph_SH, opens=data_sh[:,3],
                      closes=data_sh[:,4],highs=data_sh[:,5],lows=data_sh[:,6],width=0.6,colordown='g',colorup='r',alpha=1.0) # 绘制K线走势

graph_SH.set_title("上证指数-日K线")

graph_SH.set_xlabel("日期")

graph_SH.set_ylabel("价格")

graph_SH.set_xlim(len(data_sh[:,2])-90, len(data_sh[:,2]))  # 设置一下x轴的范围

graph_SH.set_ylim(3300,3800) # y轴范围

graph_SH.set_xticks(range(len(data_sh[:,2])-90, len(data_sh[:,2]), 5))  # X轴刻度设定,每15天标一个日期

graph_SH.grid(True, color='k')

graph_SH.set_xticklabels(
    [data_sh[:,2][index] for index in graph_SH.get_xticks()])  # 标签设置为日期

# X轴每个ticker标签都向右倾斜45度

for label in graph_SH.xaxis.get_ticklabels():
    label.set_rotation(45)

    label.set_fontsize(10)  # 设置标签字号

plt.plot(mean_5[-90:],'b') # 5日均线
plt.plot(mean_10[-90:],'y') # 10日均线

plt.show()

3.股票市盈率与其他指标的相关性

我们可以看到,股票市盈率与其他指标均存在较强的线性相关关系,尤其是与股价相关的数据
4.稳健性评估
    PSI反映了**验证样本**在各分数段的分布与**建模样本**分布的稳定性。在建模中,我们常用来**筛选特征量、评估模型稳定性.**

    那么,PSI的计算逻辑是怎样的呢?很多博客文章都会直接告诉我们,**稳定性是有参照的**,因此**需要有两个分布——实际分布**(actual)**和预期分布**(expected)。其中,在建模时通常以训练样本(In the Sample, INS)作为预期分布,而验证样本通常作为实际分布。验证样本一般包括样本外(Out of Sample,OOS)和跨时间样本(Out of Time,OOT)

   们从直觉上理解,可以**把两个分布重叠放在一起,比较下两个分布的差异有多大**

PSI = SUM( (实际占比 - 预期占比) ln(实际占比 / 预期占比) )*
PSI构建流程:
- step1:将变量预期分布(excepted)进行分箱(binning)离散化,统计各个分箱里的样本占比。 注意: a) 分箱可以是等频、等距或其他方式,分箱方式不同,将导致计算结果略微有差异; b) 对于连续型变量(特征变量、模型分数等),分箱数需要设置合理,一般设为10或20;对于离散型变量,如果分箱太多可以提前考虑合并小分箱;分箱数太多,可能会导致每个分箱内的样本量太少而失去统计意义;分箱数太少,又会导致计算结果精度降低。
- step2: 按相同分箱区间,对实际分布(actual)统计各分箱内的样本占比。
- step3:计 算各分箱内的A - E和*Ln(A / E),计算index = (实际占比 - 预期占比)* ln(实际占比 / 预期占比) 。*
- step4: 将各分箱的index进行求和,即得到最终的PSI。
def calculate_psi(base_list, test_list, bins=20, min_sample=10):
    try:
        base_df = pd.DataFrame(base_list, columns=['score'])
        test_df = pd.DataFrame(test_list, columns=['score'])

        # 1.去除缺失值后,统计两个分布的样本量
        base_notnull_cnt = len(list(base_df['score'].dropna()))
        test_notnull_cnt = len(list(test_df['score'].dropna()))

        # 空分箱
        base_null_cnt = len(base_df) - base_notnull_cnt
        test_null_cnt = len(test_df) - test_notnull_cnt

        # 2.最小分箱数
        q_list = []
        if type(bins) == int:
            bin_num = min(bins, int(base_notnull_cnt / min_sample))
            q_list = [x / bin_num for x in range(1, bin_num)]
            break_list = []
            for q in q_list:
                bk = base_df['score'].quantile(q)
                break_list.append(bk)
            break_list = sorted(list(set(break_list))) # 去重复后排序
            score_bin_list = [-np.inf] + break_list + [np.inf]
        else:
            score_bin_list = bins

        # 4.统计各分箱内的样本量
        base_cnt_list = [base_null_cnt]
        test_cnt_list = [test_null_cnt]
        bucket_list = ["MISSING"]
        for i in range(len(score_bin_list)-1):
            left  = round(score_bin_list[i+0], 4)
            right = round(score_bin_list[i+1], 4)
            bucket_list.append("(" + str(left) + ',' + str(right) + ']')

            base_cnt = base_df[(base_df.score > left) & (base_df.score <= right)].shape[0]
            base_cnt_list.append(base_cnt)

            test_cnt = test_df[(test_df.score > left) & (test_df.score <= right)].shape[0]
            test_cnt_list.append(test_cnt)

        # 5.汇总统计结果
        stat_df = pd.DataFrame({"bucket": bucket_list, "base_cnt": base_cnt_list, "test_cnt": test_cnt_list})
        stat_df['base_dist'] = stat_df['base_cnt'] / len(base_df)
        stat_df['test_dist'] = stat_df['test_cnt'] / len(test_df)

        def sub_psi(row):
            # 6.计算PSI
            base_list = row['base_dist']
            test_dist = row['test_dist']
            # 处理某分箱内样本量为0的情况
            if base_list == 0 and test_dist == 0:
                return 0
            elif base_list == 0 and test_dist > 0:
                base_list = 1 / base_notnull_cnt
            elif base_list > 0 and test_dist == 0:
                test_dist = 1 / test_notnull_cnt

            return (test_dist - base_list) * np.log(test_dist / base_list)

        stat_df['psi'] = stat_df.apply(lambda row: sub_psi(row), axis=1)
        stat_df = stat_df[['bucket', 'base_cnt', 'base_dist', 'test_cnt', 'test_dist', 'psi']]
        psi = stat_df['psi'].sum()

    except:
        print('error!!!')
        psi = np.nan
        stat_df = None
    return psi, stat_df
PSI评估标准:
PSI数值越小,两个分布之间的差异就越小,代表越稳定。

4.建立市盈率与其他指标的模型
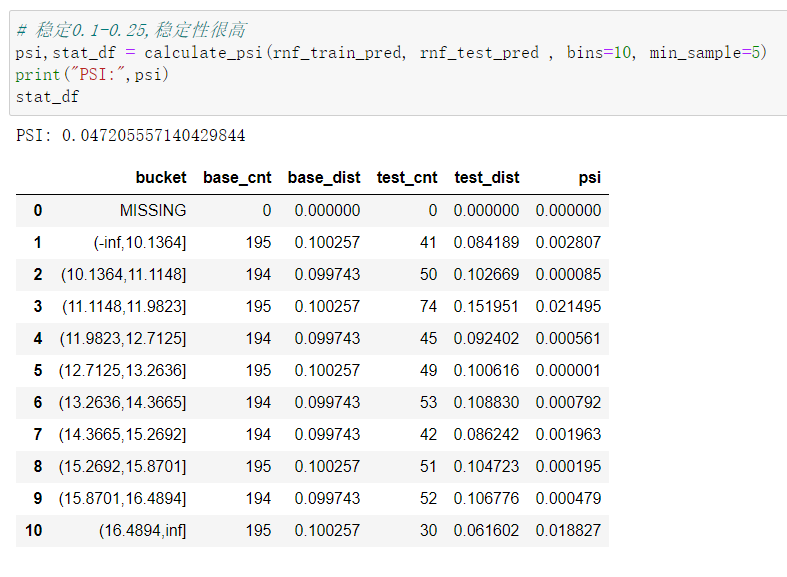
首先,我们对数据划分为训练集和测试集,其中,测试集比例为0.2,然后我们对训练集和测试集的特征进行PSI评估,结果发现,特征均很稳定。

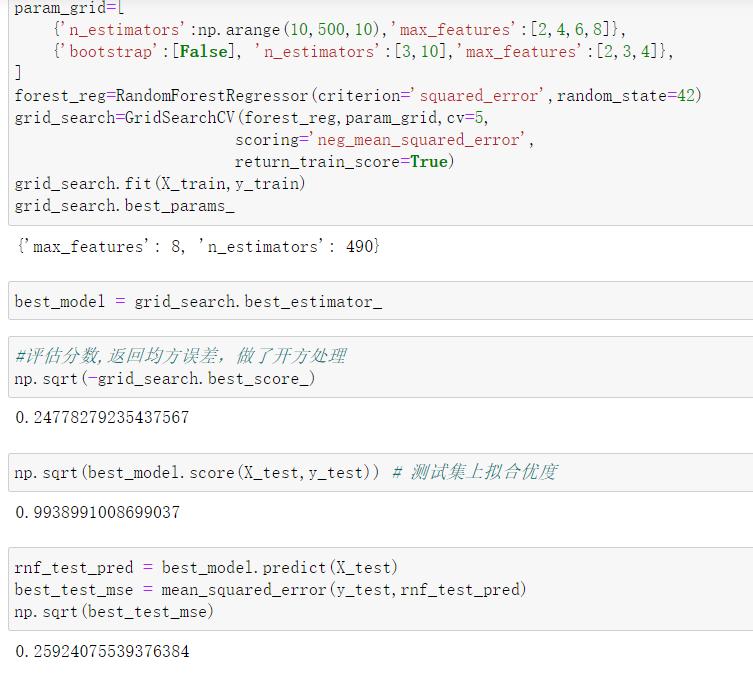
然后,我们对数据进行归一化,分别使用线性模型和随机森林训练模型,在测试集进行评估,结果发现,随机森林的拟合效果更好,我们在使用网格搜索,搜索出效果最优的参数。最后,对模型进行稳健性评估。


4.预测下一天的收盘价
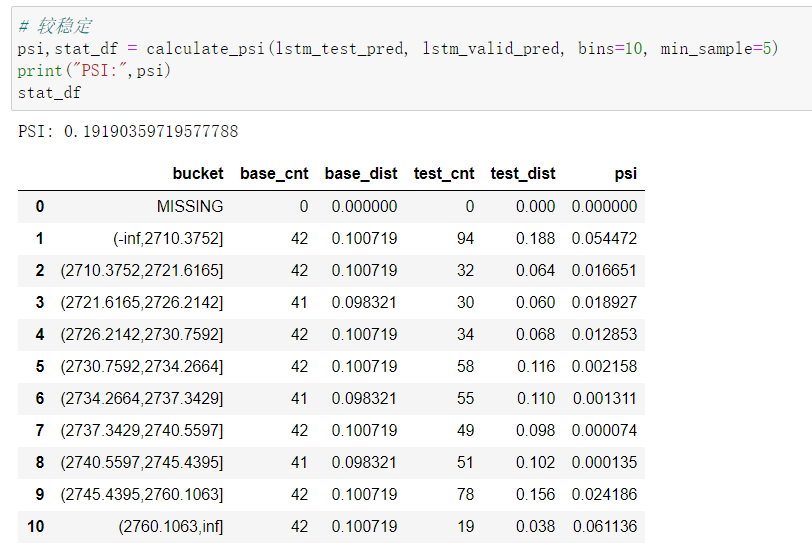
我们将数据划分为每15天为一个时间序列,对数据进行标准化,通过构建LSTM模型,激活函数使用selu并使用he_normal初始化,正则化使用l2正则化,训练网络,然后再测试集进行评估并评估模型的稳健性,模型比较稳定。
np.random.seed(42)

model = keras.models.Sequential([
    keras.layers.LSTM(50, return_sequences=True,kernel_initializer="he_normal",kernel_regularizer='l2',
                      input_shape=[None,train_x.shape[2]]),
    keras.layers.BatchNormalization(),
    keras.layers.Activation("selu"),
    keras.layers.LSTM(50,kernel_initializer="he_normal",kernel_regularizer='l2', return_sequences=True),
    keras.layers.BatchNormalization(),
    keras.layers.Activation("selu"),
    keras.layers.TimeDistributed(keras.layers.Dense(1))
])

ear_stop = keras.callbacks.EarlyStopping(patience=10)
model.compile(loss="mse", optimizer="sgd", metrics=["mae"])
history = model.fit(train_x, train_y, epochs=100,callbacks=[ear_stop],
                    validation_data=(valid_x, valid_y))


版权归原作者 樱花的浪漫 所有, 如有侵权,请联系我们删除。