
*以下操作基于Ubuntu-22.04.2 LST
1. 安装Perf
打开一个命令终端,并运行以下命令,这个命令需要sudo或者root权限。如果系统提示缺省其他的依赖库,则一并安装即可。
sudo apt install linux-tools-$(uname -r) linux-cloud-tools-$(uname -r)
2. Perf简介
Perf是基于Linux内核perf_events接口实现的性能分析工具。我们可以用它来分析一个程序的性能,找出影响程序性能的瓶颈,并在此基础上对程序性能进行改进。
3. Perf命令
3.1 perf --help
- 帮助命令用来列出perf支持的所有子命令
perf --help

 usage: perf [--version] [--help] [OPTIONS] COMMAND [ARGS]

 The most commonly used perf commands are:
   annotate        Read perf.data (created by perf record) and display annotated code
   archive         Create archive with object files with build-ids found in perf.data file
   bench           General framework for benchmark suites
   buildid-cache   Manage build-id cache.
   buildid-list    List the buildids in a perf.data file
   c2c             Shared Data C2C/HITM Analyzer.
   config          Get and set variables in a configuration file.
   daemon          Run record sessions on background
   data            Data file related processing
   diff            Read perf.data files and display the differential profile
   evlist          List the event names in a perf.data file
   ftrace          simple wrapper for kernel's ftrace functionality
   inject          Filter to augment the events stream with additional information
   iostat          Show I/O performance metrics
   kallsyms        Searches running kernel for symbols
   kmem            Tool to trace/measure kernel memory properties
   kvm             Tool to trace/measure kvm guest os
   list            List all symbolic event types
   lock            Analyze lock events
   mem             Profile memory accesses
   record          Run a command and record its profile into perf.data
   report          Read perf.data (created by perf record) and display the profile
   sched           Tool to trace/measure scheduler properties (latencies)
   script          Read perf.data (created by perf record) and display trace output
   stat            Run a command and gather performance counter statistics
   test            Runs sanity tests.
   timechart       Tool to visualize total system behavior during a workload
   top             System profiling tool.
   version         display the version of perf binary
   probe           Define new dynamic tracepoints
   trace           strace inspired tool

 See 'perf help COMMAND' for more information on a specific command.
3.2 perf list
- 列举所有Linux内核支持的perf_events, 用户可以根据自己的需求选择合适的事件进行记录。我们常用的events有硬件类、软件类和缓存类。
- 硬件类事件
sudo perf list hw

List of pre-defined events (to be used in -e):

  branch-instructions OR branches                    [Hardware event]
  branch-misses                                      [Hardware event]
  bus-cycles                                         [Hardware event]
  cache-misses                                       [Hardware event]
  cache-references                                   [Hardware event]
  cpu-cycles OR cycles                               [Hardware event]
  instructions                                       [Hardware event]
  ref-cycles                                         [Hardware event]
- 软件类事件
 sudo perf list sw
[sudo] password for kevinzhu:

List of pre-defined events (to be used in -e):

  alignment-faults                                   [Software event]
  bpf-output                                         [Software event]
  cgroup-switches                                    [Software event]
  context-switches OR cs                             [Software event]
  cpu-clock                                          [Software event]
  cpu-migrations OR migrations                       [Software event]
  dummy                                              [Software event]
  emulation-faults                                   [Software event]
  major-faults                                       [Software event]
  minor-faults                                       [Software event]
  page-faults OR faults                              [Software event]
  task-clock                                         [Software event]

  duration_time                                      [Tool event]
  user_time                                          [Tool event]
  system_time                                        [Tool event]
- 缓存类事件
 sudo perf list cache

List of pre-defined events (to be used in -e):

  L1-dcache-load-misses                              [Hardware cache event]
  L1-dcache-loads                                    [Hardware cache event]
  L1-dcache-stores                                   [Hardware cache event]
  L1-icache-load-misses                              [Hardware cache event]
  branch-load-misses                                 [Hardware cache event]
  branch-loads                                       [Hardware cache event]
  dTLB-load-misses                                   [Hardware cache event]
  dTLB-loads                                         [Hardware cache event]
  dTLB-store-misses                                  [Hardware cache event]
  dTLB-stores                                        [Hardware cache event]
  iTLB-load-misses                                   [Hardware cache event]
3.3 perf stat
- 统计命令的事件数据
比如,下面这个命令统计了执行ls时消耗的CPU时钟和产生的页错误。在这个例子中,命令ls总共用时0.003045465秒,其中用户空间用时0.00313秒,内核空间基本没消耗什么时间,一共消耗了2178591个CPU时钟周期,产生了94次页错误。
sudo perf stat -e cycles,page-faults ls
linux-3.14.79  linux-3.14.79.tar.bz2  linux-3.14.79.tar.xz  linux-5.15  linux-5.15.tar.bz2  linux-5.15.tar.xz  perf.data  perf.data.3.14  perf.data.5.15

 Performance counter stats for 'ls':

         2,178,591      cycles
                94      page-faults

       0.003045465 seconds time elapsed

       0.003130000 seconds user
       0.000000000 seconds sys
3.4 perf top
- 这个命令类似Shell的top命令,用来实时显示系统各个命令/函数的CPU开销百分比。
以下这个命令时运行"sudo perf top -F 999"时某一时刻的数据。第一行显示,到此刻一共产生了432K的CPU时钟周期事件,采样周期是999Hz.
这些数据一共有三列,第一列Overhead表示开销百分比,第二列Shared Object表示命令或者动态库,第三列表示符号表,其中[.]表示该符号属于用户空间的,[k]则表示改符号属于内核空间的。例如第一行数据表示,命令cc1(此刻系统在编译代码,调用gcc)中的函数ht_lookup_with_hash消耗了2.13%的CPU时钟周期。
如果你发现程序里面的某个函数CPU占用率很高,就可以想办法提高该函数的效率进而提高这个程序的运行效率了。
Samples: 432K of event 'cycles', 999 Hz, Event count (approx.): 70818582256 lost: 0/0 drop: 0/0
Overhead  Shared Object                          Symbol
   2.13%  cc1                                    [.] ht_lookup_with_hash
   2.05%  perf                                   [.] hpp__sort_overhead
   1.69%  libc.so.6                              [.] ____wcstold_l_internal
   1.41%  perf                                   [.] rb_next
   1.31%  libxul.so                              [.] aom_iwht4x4_16_add_sse2
   1.30%  libc.so.6                              [.] ____wcstof_l_internal
   0.88%  libc.so.6                              [.] 0x00000000001af28c
   0.88%  [kernel]                               [k] native_write_msr
   0.83%  cc1                                    [.] _cpp_lex_direct
   0.76%  cc1                                    [.] ggc_internal_alloc
   0.71%  cc1                                    [.] htab_find_slot_with_hash
   0.63%  [kernel]                               [k] asm_exc_page_fault
   0.59%  libc.so.6                              [.] ____wcstod_l_internal
   0.49%  firefox                                [.] malloc
   0.45%  genksyms                               [.] yylex
   0.43%  [kernel]                               [k] clear_page_erms
   0.43%  [kernel]                               [k] zap_pte_range
   0.41%  cc1                                    [.] linemap_lookup_macro_index
   0.39%  genksyms                               [.] find_symbol
   0.37%  [kernel]                               [k] sync_regs
   0.37%  [kernel]                               [k] lzma_literal
   0.37%  perf                                   [.] output_resort
   0.36%  libc-2.31.so                           [.] 0x000000000018b941
   0.36%  [kernel]                               [k] psi_group_change
   0.35%  firefox                                [.] free
   0.34%  libc.so.6                              [.] round_and_return
...
3.5 perf record
- 用来记录命令运行的性能数据,进而帮助分析命令的性能瓶颈。在默认情况下,数据被记录在perf.data里面,可以供perf report等命令使用。我们通过-e选项选择想要记录的事件,通常可以选择跟时间相关的cycle事件,跟执行指令数量相关的instructions事件,以及跟内存缺页访问相关的page-faults事件。
# 例如,我们想分析以下这个打包命令是哪里的开销最多,可以用下面的命令把性能事件记录下来,
# 等命令运行完后再通过perf report等命令进行分析。
sudo perf record -e cycles,page-faults tar -jcf linux-3.14.79.tar.bz2 linux-3.14.79
# 以下两行是命令运行完后的输出,显示产生了13.799MB的数据
[ perf record: Woken up 55 times to write data ]
[ perf record: Captured and wrote 13.799 MB perf.data (293472 samples) ]
3.6 perf report
- 分析命令perf record产生的数据记录perf.data,找到程序性能的瓶颈。
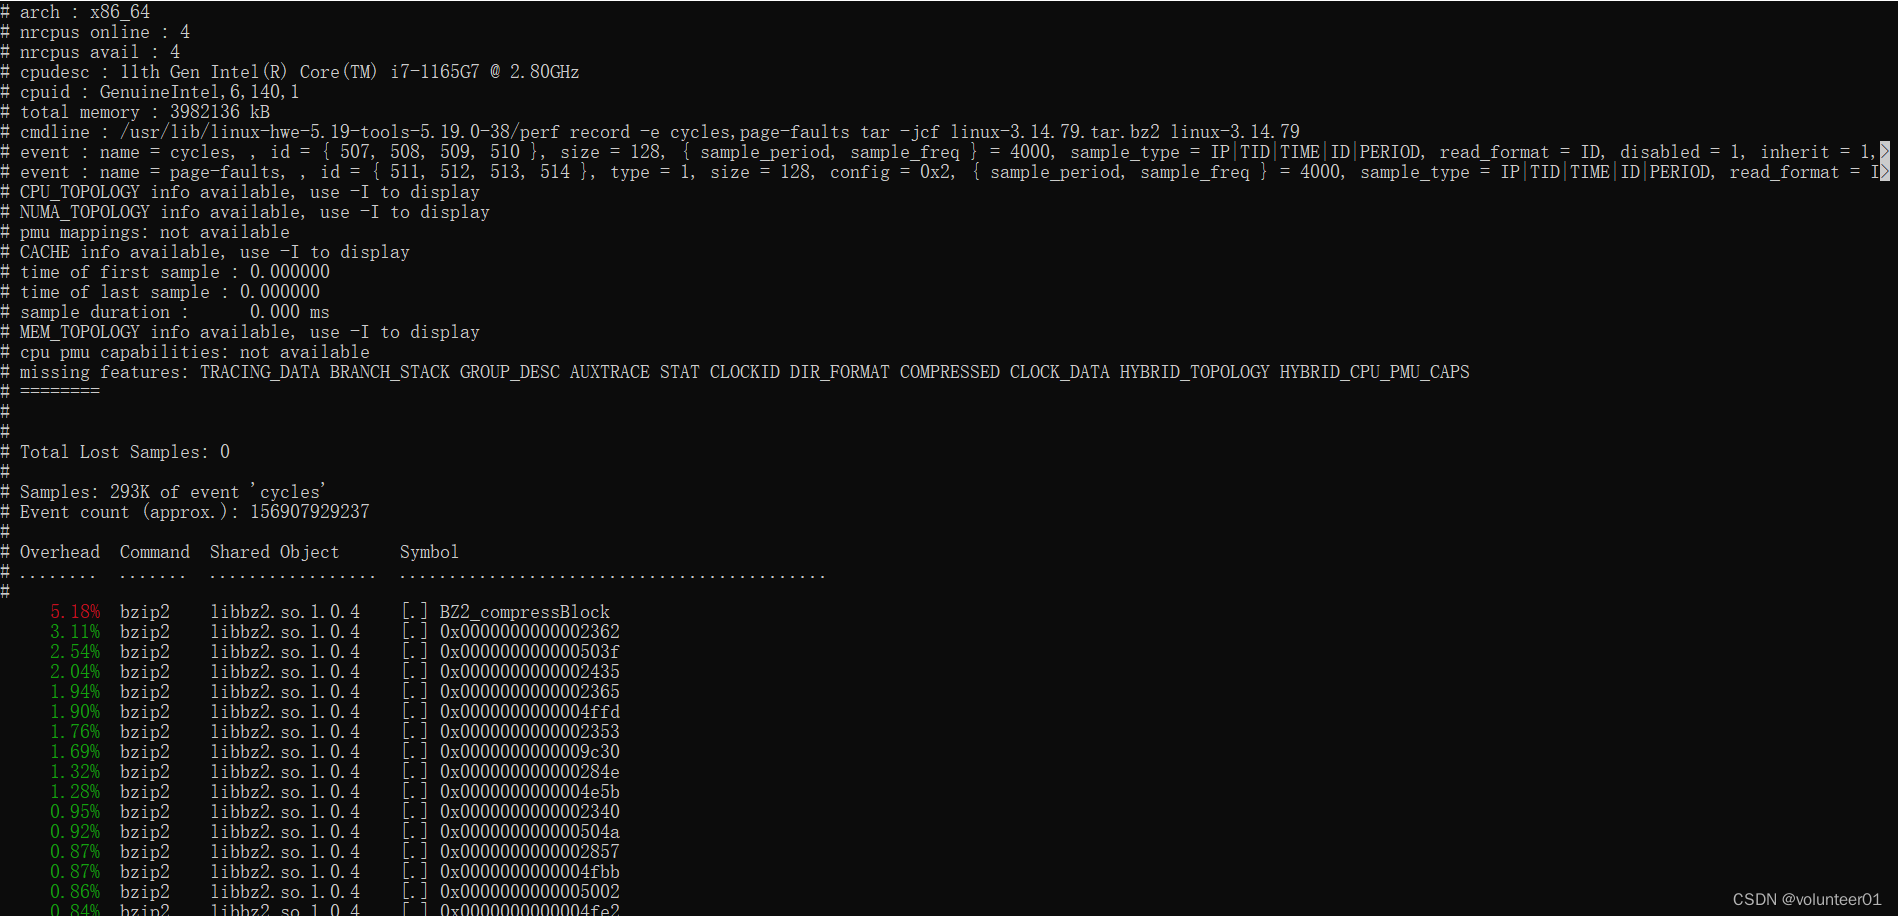
我们先用'perf report --header'命令来看看这个文件的概况。由于这个文件实在太大了,包涵的信息很多,我截取了其中一部分,显示如下,包括了电脑的基本硬件配置以及被用来分析的命令的运行情况。
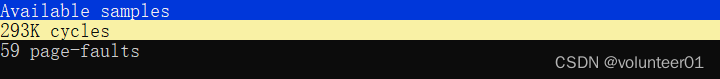
另外,我们可以通过'sudo perf report'命令看看采用的事件数据,以下是运行的结果,一共有293K的CPU时钟周期样本数据和59K的页错误样本数据。
- perf report --stdio --sort comm,dso
接下来,我们用这个命令看看程序中那部分消耗的CPU最多。
sudo perf report --stdio --sort comm,dso
# To display the perf.data header info, please use --header/--header-only options.
#
#
# Total Lost Samples: 0
#
# Samples: 293K of event 'cycles'
# Event count (approx.): 156907929237
#
# Overhead  Command  Shared Object
# ........  .......  .................
#
    91.60%  bzip2    libbz2.so.1.0.4
     6.35%  tar      [kernel.kallsyms]
     1.17%  bzip2    [kernel.kallsyms]
     0.44%  tar      tar
     0.21%  tar      libc.so.6
     0.20%  bzip2    libc.so.6
     0.02%  bzip2    bzip2
     0.00%  tar      libselinux.so.1
     0.00%  sh       [kernel.kallsyms]
     0.00%  perf-ex  [kernel.kallsyms]

# Samples: 59  of event 'page-faults'
# Event count (approx.): 4261
#
# Overhead  Command  Shared Object
# ........  .......  ....................
#
    69.35%  bzip2    libbz2.so.1.0.4
    13.68%  tar      ld-linux-x86-64.so.2
     8.12%  sh       ld-linux-x86-64.so.2
     6.01%  bzip2    ld-linux-x86-64.so.2
     1.78%  tar      libc.so.6
     0.99%  tar      [kernel.kallsyms]
     0.07%  bzip2    [kernel.kallsyms]
由上面的输出可见,bzip2命令中的动态库libbz2.so.1.0.4占用了91.6%的CPU时钟周期。因此,如果要优化这个命令的性能,我们应该从这个库入手,进一步查看哪里占用的CPU最多。接下来我们通过下面这个命令看看到底哪个函数耗掉了大部分的时间。
- sudo perf report --stdio --dsos=libbz2.so.1.0.4
# To display the perf.data header info, please use --header/--header-only options.
#
# dso: libbz2.so.1.0.4
#
# Total Lost Samples: 0
#
# Samples: 293K of event 'cycles'
# Event count (approx.): 156907929237
#
# Overhead  Command  Symbol
# ........  .......  .........................
#
     5.18%  bzip2    [.] BZ2_compressBlock
     3.11%  bzip2    [.] 0x0000000000002362
     2.54%  bzip2    [.] 0x000000000000503f
     2.04%  bzip2    [.] 0x0000000000002435
     1.94%  bzip2    [.] 0x0000000000002365
     1.90%  bzip2    [.] 0x0000000000004ffd
     1.76%  bzip2    [.] 0x0000000000002353
     1.69%  bzip2    [.] 0x0000000000009c30
     1.32%  bzip2    [.] 0x000000000000284e
     1.28%  bzip2    [.] 0x0000000000004e5b
     0.95%  bzip2    [.] 0x0000000000002340
     0.92%  bzip2    [.] 0x000000000000504a
...
这时,我们看到了,原来是BZ2_compressBlock这个函数开销最大(5.18%)。如果要优化,可以从它入手了。
3.7 perf annotate
- 这个命令可以分析代码各部分的开销
sudo perf annotate --stdio --dsos=libbz2.so.1.0.4 --symbol=BZ2_compressBlock

 Percent |      Source code & Disassembly of libbz2.so.1.0.4 for cycles (12262 samples, percent: local period)
--------------------------------------------------------------------------------------------------------------
         :
         :
         :
         : 3    Disassembly of section .text:
         :
         : 5    0000000000005a10 <BZ2_compressBlock@@Base>:
    0.00 :   5a10:   endbr64
    0.00 :   5a14:   push   %r15
    0.00 :   5a16:   push   %r14
    0.00 :   5a18:   push   %r13
    0.00 :   5a1a:   push   %r12
    0.00 :   5a1c:   push   %rbp
    0.00 :   5a1d:   push   %rbx
    0.00 :   5a1e:   mov    %rdi,%rbx
    0.00 :   5a21:   sub    $0x118,%rsp
    0.00 :   5a28:   mov    %esi,0xac(%rsp)
    0.00 :   5a2f:   mov    %fs:0x28,%rax
    0.00 :   5a38:   mov    %rax,0x108(%rsp)
    0.00 :   5a40:   xor    %eax,%eax
    0.00 :   5a42:   movslq 0x6c(%rdi),%rax
    0.00 :   5a46:   test   %eax,%eax
    0.00 :   5a48:   jle    5e9d <BZ2_compressBlock@@Base+0x48d>
    0.00 :   5a4e:   mov    0x288(%rdi),%r8d
    0.00 :   5a55:   mov    0x28c(%rdi),%r9d
    0.00 :   5a5c:   mov    0x294(%rdi),%ecx
    0.00 :   5a62:   not    %r8d
    0.00 :   5a65:   rol    %r9d
    0.00 :   5a68:   xor    %r8d,%r9d
    0.00 :   5a6b:   mov    %r8d,0x288(%rdi)
    0.00 :   5a72:   mov    %r9d,0x28c(%rdi)
    0.00 :   5a79:   cmp    $0x1,%ecx
    0.00 :   5a7c:   jle    5a85 <BZ2_compressBlock@@Base+0x75>
...
    0.58 :   6f70:   movzwl (%r14,%rax,2),%edx
    1.54 :   6f75:   cmp    %esi,%edx
    0.00 :   6f77:   jge    6f7e <BZ2_compressBlock@@Base+0x156e>
    1.67 :   6f79:   mov    %edx,%esi
    1.03 :   6f7b:   mov    %eax,%r10d
    1.45 :   6f7e:   add    $0x1,%rax
    0.95 :   6f82:   cmp    %eax,%r13d
    0.00 :   6f85:   jg     6f70 <BZ2_compressBlock@@Base+0x1560>
...

 Percent |      Source code & Disassembly of libbz2.so.1.0.4 for page-faults (3 samples, percent: local period)
---------------------------------------------------------------------------------------------------------------
         :
         :
         :
         : 3    Disassembly of section .text:
         :
         : 5    0000000000005a10 <BZ2_compressBlock@@Base>:
    0.00 :   5a10:   endbr64
    0.00 :   5a14:   push   %r15
    0.00 :   5a16:   push   %r14
    0.00 :   5a18:   push   %r13
    0.00 :   5a1a:   push   %r12
...
    0.00 :   6f8a:   add    %esi,0x10(%rsp)
    0.00 :   6f8e:   mov    %r8d,%r15d
    0.00 :   6f91:   addl   $0x1,0xd0(%rsp,%rdx,4)
   66.67 :   6f99:   mov    %r10b,0x6a7(%rbx,%r8,1)
    0.00 :   6fa1:   cmp    $0x6,%r13d
    0.00 :   6fa5:   jne    73cc <BZ2_compressBlock@@Base+0x19bc>
    0.00 :   6fab:   mov    %edi,%eax
    0.00 :   6fad:   sub    %ecx,%eax
在这个分析中,我们没有看到那部分代码集中消耗大量CPU时钟的,但却看到其中一个地方产生大量的缺页错误的(66.67%)。如果我们自己写一个性能比较差的算法(比如多层for循环嵌套的浮浮点乘法运算),就可以看到程序的某部分占用大量的CPU资源了。
4. 其他事项
- perf是基于处理器的性能计数器(Performance Counters)来工作的,不同的处理器支持的事件可能不一样。
- 性能计数器一般由两种工作模式,分别是统计模式和采样模式;统计模式可以通过'perf stat'命令触发,而采样模式可以用'perf record'命令启动;统计模式的额外开销比采样模式要低一点。这是由他们不同的工作方式决定的。在统计模式下,只要把计算器设置好,然后清零并开启就可以了,等多一段时间之后,计算器停止了,再把数值读出来就可以了;而在采样模式下,虽然也是配置、清零和启动计算器,但计数器是配置成每隔固定数量的样本就产生一个中断的模式的,这个中断也需要CPU去处理并记录相关的数据,并在适当的时候写入到文件中,这就造成了比较大的额外开销。
- perf分析不一定是最好的提高程序性能的方法,有时找到合适的编译选项反而是更好的选择
- 在通过perf对程序进行性能分析的时候,工具本身会对程序或者系统造成额外的开销,因此选择合适的采样频率也相当重要。一般来说,要确保额外开销小于5%才不会对程序造成太大影响而影响分析的结果。
- 通过perf进行性能分析的时候,要先确定比较基准,以便判断优化后是否确实有效。
- 性能优化是一项长期艰辛的工作,只有通过不断的尝试和分析才能找到更好的方案。
版权归原作者 volunteer01 所有, 如有侵权,请联系我们删除。