
通过Jmeter快速将已有的Selenium 代码以性能测试的方式组织起来,并使用JMeter 丰富的报表展示测试结果
from selenium import webdriver
from selenium.webdriver.common.action_chains import ActionChains
from selenium.webdriver.common.by import By
driver = webdriver.Chrome()
driver.get("https://www.baidu.com")
ActionChains(driver).click(driver.find_element(By.XPATH,"//*[text()='新闻']")).perform()
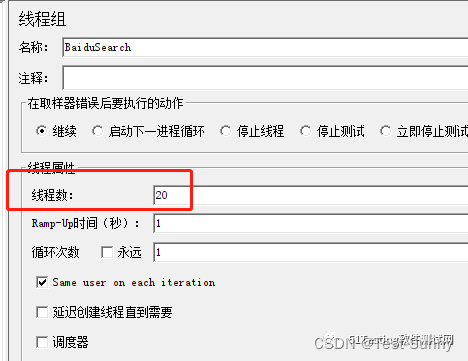
打开JMeter 创建一个【线程组】
- 修改线程数
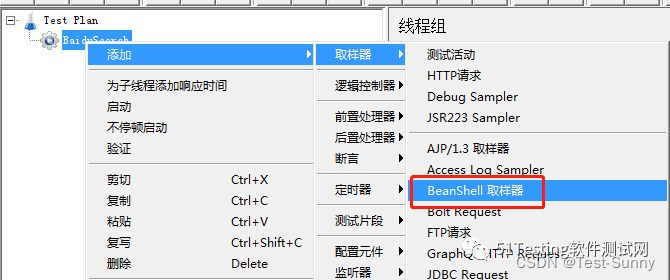
- 右击BaiduSearch线程组,创建BeanShell取样器:
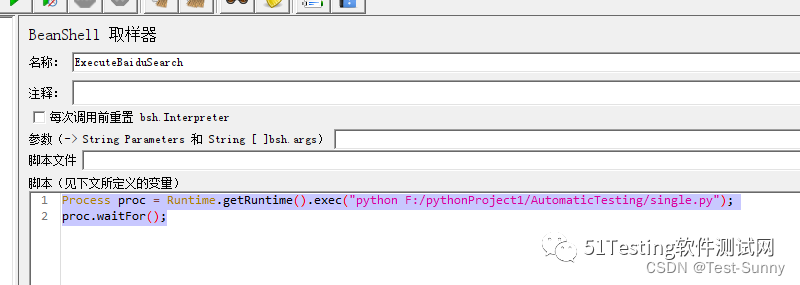
- 然后在Script区域填入脚本,设置Bean Shell取样器的信息:
Process proc = Runtime.getRuntime().exec("python F:/pythonProject1/AutomaticTesting/single.py");// Process proc = Runtime.getRuntime().exec("cmd /c python "+"python F:/pythonProject1/AutomaticTesting/single.py");
proc.waitFor();
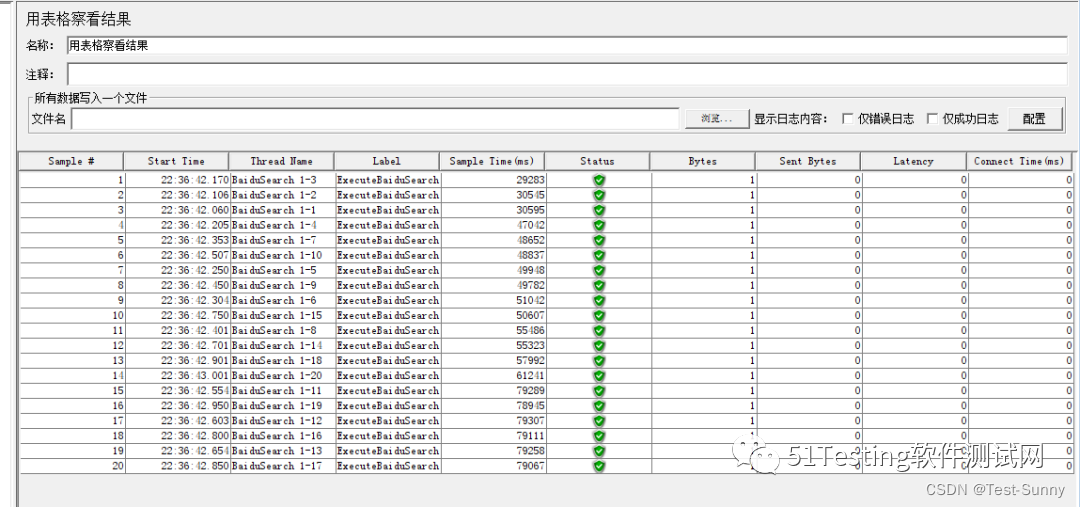
- 创建监听器并运行 基本的性能测试就组织好了,接下来可以创建监听器来查看运行结果。JMeter支持多种多样的监听器,可以根据自己的需求选择。 在本例中,我们将使用“表格结果”监听器来查看运行结果。
本文转载自: https://blog.csdn.net/weixin_50614575/article/details/132366936
版权归原作者 Test-Sunny 所有, 如有侵权,请联系我们删除。
版权归原作者 Test-Sunny 所有, 如有侵权,请联系我们删除。