
综合实验:网站访问日志采集、处理及分析
概述
当前互联网应用中,万维网(World Wide Web)应用占据了绝大部分的份额。万维网应用对外提供服务需要架设Web服务器软件。典型的Web服务器软件有Apache、Nginx等。Web服务器软件在运行过程中会写入各种日志到磁盘文件中。例如,Apache Web服务器软件运行过程中,会产生access.log文件,记录用户访问日志。
繁忙的Web服务器软件每天产生大量的日志记录。日积月累之后,这些日志所占据的存储会变得非常大。此时,单机无法满足分析处理日志的需求。因此,我们需要将日志文件存储在HDFS分布式文件系统中。使用开源的Apache Flume软件,能够从Web服务器集群导入日志到HDFS集群。
通过Apache Flume采集到HDFS的日志文件是原始的格式,这种格式通常并不利于分析统计。因此,下一步要做的是对日志文件进行预处理,产生更规整的数据。这个过程可以使用MapReduce来进行,从HDFS中读取原始日志文件,处理之后的数据仍然存放在HDFS上。
经过前面的准备,接下来可以对日志数据进行分析和统计了。最开始,人们直接使用MapReduce进行统计的工作。但是很快,大家发现编写MapReduce程序是一件很麻烦的事情,而且,部分数据分析人员不具备Java编程的能力。为了解决这个问题,Apache Hive软件被创建出来。借助Apache Hive,可以使用SQL语言读写和管理HDFS上的数据。在本次实践的最后一个环节,你将使用Apache Hive,对预处理之后的规整数据进行分析统计。
总体流程架构如图: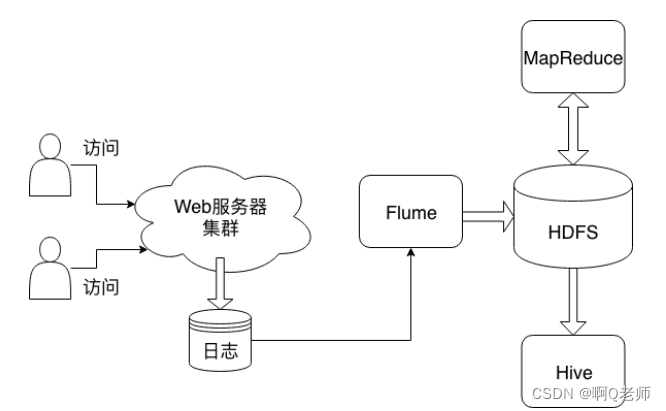
监控日志文件
日志文件数据是某个高校WWW服务器七个月的HTTP请求数据 (时间是从1995/6/1 00:00:00到1995/12/31 23:59:59)。日志数据分别存在文件xaa、xab、xac中,首先将它保存到/home/ubuntu/com_experiment目录中。
1. 启动hadoop进行实验操作:
hadoop namenode -format
start-all.sh
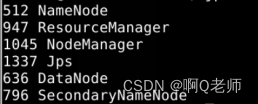
jps
成功启动如图:
2. 在/home/ubuntu目录下创建flume.conf文件,内容配置如下(注:本地路径与hdfs路径):
# Name the components on this agent
a1.sources = r1
a1.sinks = k1
a1.channels = c1

# 定义源: spooldir
a1.sources.r1.type = spooldir
# 指定监控目录(本地路径)
a1.sources.r1.spoolDir = /home/ubuntu/com_experiment
a1.sources.r1.decodeErrorPolicy = IGNORE

# Describe the sink(hdfs路径)
a1.sinks.k1.type = hdfs
a1.sinks.k1.hdfs.path =  /flume/20220706/
a1.sinks.k1.hdfs.fileType = DataStream
a1.sinks.k1.hdfs.useLocalTimeStamp = true
a1.sinks.k1.hdfs.rollSize = 0
a1.sinks.k1.hdfs.rollCount = 0

# Use a channel which buffers events in memory
a1.channels.c1.type = memory

# Bind the source and sink to the channel
a1.sources.r1.channels = c1
a1.sinks.k1.channel = c1
3. 运行flume配置的命令,代码如下:
flume-ng agent -f /home/ubuntu/flume.conf -n a1
运行结果如图:
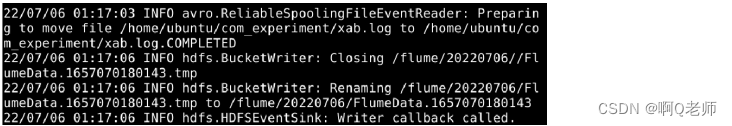
Apache Flume是一种分布式的可靠的系统,主要用于高效地收集、聚合和移动大量来自不同来源的日志数据到一个集中的数据存储区。可以通过运行“flume-ng -h”了解上述命令各选项的含义。
4. 日志导入到HDFS后,查看HDFS目录下某个文件的前几条内容:
#查看HDFS目录内容的命令
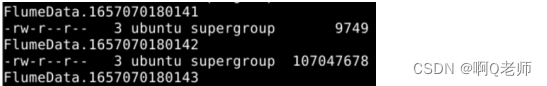
hdfs dfs -ls /flume/20220706
HDFS目录内容部分如图:
#查看HDFS目录下某文件的前几行内容的命令
hdfs dfs -cat /flume/20220706/FlumeData.1657070180143 | head -n 3
查看HDFS目录下某文件的前三行内容如图:
日志数据预处理
日志文件导入HDFS之后,为了方便Hive加载和分析数据,需要进一步对日志文件进行预处理,产生格式整齐的数据文件。
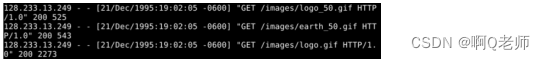
原日志示例如图:
这是典型的Apache服务器软件的日志格式。每一行记录用户对Web服务器的一次访问。一条记录有七个栏位,各栏位之间使用空格字符分隔。各栏位的含义如下:
- 远程主机IP:该栏是请求的请求方IP地址。其示例值为:131.235.141.48。
- E-mail:该栏现在已经弃用,其值恒为“-”。
- 登录名:该栏现在已经弃用,其值恒为“-”。
- 请求时间:该栏是接收到请求的时间。时间信息用方括号包围,而且采用所谓的 “公共日志格式” 或 “标准英文格式” 。时间信息最后的 “-0600” 表示服务器所处时区位于UTC之前的6小时。
- HTTP请求信息:该栏是典型的 ”METHOD RESOURCE PROTOCOL” ,即 ”方法 资源 协议”。METHOD是一般浏览器通过GET或POST方法来传输表单信息,RESOURCE是指浏览者向服务器请求的文档地址,即URL。PROTOCOL通常是HTTP,后面再加上版本号。
- 状态代码:该栏是请求信息的状态。一般地说,以2开头的状态代码表示成功,以3开头的状态代码表示由于各种不同的原因用户请求被重定向到了其他位置,以4开头的状态代码表示客户端存在某种错误,以5开头的状态代码表示服务器遇到了某个错误。
- 发送字节数:该栏是发送给客户端的总字节数。通过检查该数值是否和实际文件的大小相同,可以知道这次传输是否被打断。把日志记录中的这些值加起来就可以得知服务器在一天、一周或者一月内发送了多少数据。其示例值为:2273。

日志处理后示例如图:
作出的处理如下:
- 丢弃第2栏和第3栏
- 第5栏—HTTP请求信息拆分为三个字段,分别表示:方法、资源、协议
- 将文件转换为csv格式,即每个字段之间使用英文逗号分隔
其中输入是Flume导入到HDFS的目录,输出结果存放于HDFS的另外一个目录。

1.了解到日志数据需要如何处理后,使用MapReduce进行处理,只需map即可,代码如下:
#路径/home/ubuntu/map.pyimport sys
import csv

withopen("Output.csv",'w',encoding='utf-8',newline="")asfile:for line in sys.stdin:if line[0]!='':
            line = line.strip()
            line = line.replace('- - ','').replace('[','').replace(']','').replace('"','').replace('"','')
            line = line.replace(' ',',')
            line = line.replace(',-',' -')print(line)file.write(line)file.write('\n')
2.然后使用Hadoop-streaming运行MapReduce的命令,代码如下:
$HADOOP_HOME/bin/hadoop jar \
$HADOOP_HOME/share/hadoop/tools/lib/hadoop-streaming-2.7.3.jar \
-files "/home/ubuntu/map.py" \
-input /flume/20220706/* \
-output /20220706/out001 \
-mapper "python3 map.py"
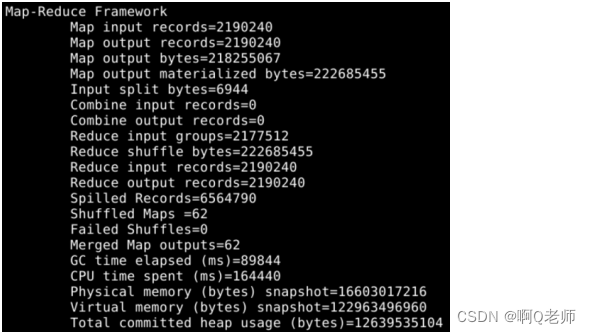
成功执行MapReduce结果如图:

数据处理后部分如图:
#查看该目录下前五行内容
hdfs dfs -cat /20220706/out001/* | tail -n 5

日志数据分析与统计
日志数据预处理后,使用Hive为HDFS上的csv文件建表并使用HQL分析问题。
Apache Hive是一种建立在Hadoop文件系统上的数据仓库架构,并对存储在HDFS中的数据进行分析和管理。Hive通过一种类似SQL的查询语言(称为HiveSQL,简称HQL)分析与管理数据。
#首先,进入Hive操作
hive
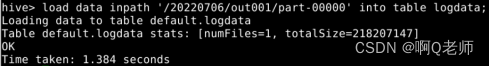
#然后,创logdata表对应日志数据处理后的字段createtableifnotexists logdata(ip string,request_time string,method string,url string,state int,num int)row format delimited fieldsterminatedby',';#再将处理后输出的数据导入到logdata表loaddata inpath '/20220706/out001/part-00000'intotable logdata;
最后成功执行结果如图:
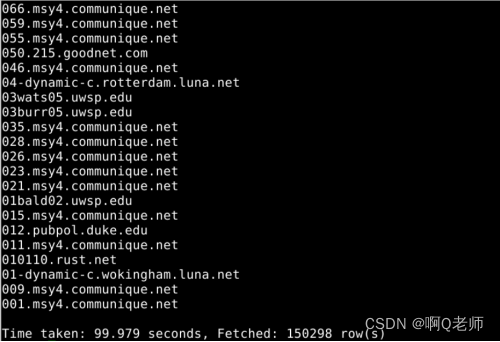
1.IP地址(域名) 访问次数最多
select ip from(select ip,rank()over(orderby sum desc)as rank from(select ip,COUNT(*)as sum from logdata groupby ip orderby sum desc)a)b where b.rank=1;
结果如图:

2.IP地址(域名) 产生的流量最大
select a.ip from(selectdistinct b.ip,b.newtable from(select ip,sum(num)over(partitionby ip)newtable from logdata)b orderby b.newtable desc)a limit1;
结果如图:

3.产生流量最大的前10% IP地址(域名)
select a.ip from(select*,ntile(10)over(orderby b.newtable desc) d from(selectdistinct c.ip,c.newtable from(select ip,sum(num)over(partitionby ip)newtable from logdata)c)b)a;
结果如图:
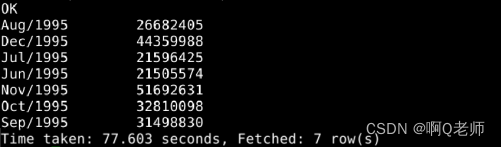
4.统计每个月的流量
selectdistinct a.month,a.month_total from(select substr(request_time,4,8)asmonth,sum(num)over(partitionby substr(request_time,4,8))month_total from logdata)a where a.month_total isnotNULL;
结果如图:
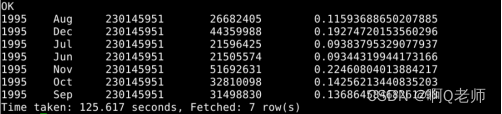
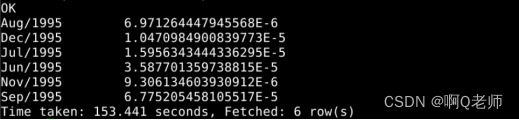
5.统计每个月的流量 month_total 、当年的总流量 year_total及每月流量占比 ( month_total /year_total )
selectdistinctyear,mon,year_total,month_total,month_total/year_total from(select*,sum(num)over(partitionby mon)month_total from(select*,substr(request_time,4,3)as mon from(select*,sum(num)over(partitionbyyear)year_total from(select*,substr(request_time,8,4)asyearfrom logdata)a)b)c)d where year_total isnotNULL;
结果如图:
6.日志记录的时期,一共有多少错误的请求?(响应码以4或5开头)
selectcount(state)from logdata where state like'4%'or state like'5%';
结果如图:

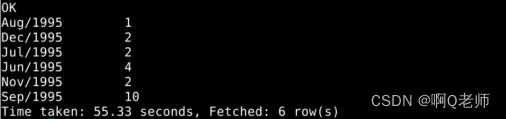
7.
查询每个月中错误请求的次数
selectdistinct a.month,a.erro_total from(select substr(request_time,4,8)asmonth,count(state)over(partitionby substr(request_time,4,8))erro_total from logdata where state like'4%'or state like'5%')a;
结果如图:
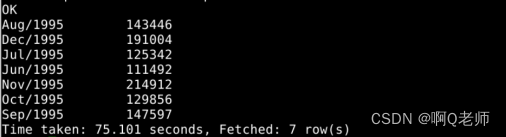
查询每个月中请求的总次数
selectdistinct b.month,b.total from(select substr(request_time,4,8)asmonth,count(state)over(partitionby substr(request_time,4,8))total from logdata)b where total !=0;
结果如图:
嵌套获取每个月错误请求占当月总请求数量的占比
select aa.month,aa.erro_total/bb.total from(selectdistinct a.month,a.erro_total from(select substr(request_time,4,8)asmonth,count(state)over(partitionby substr(request_time,4,8))erro_total from logdata where state like'4%'or state like'5%')a)aa ,(selectdistinct b.month,b.total from(select substr(request_time,4,8)asmonth,count(state)over(partitionby substr(request_time,4,8))total from logdata)b where total !=0)bb where aa.month==bb.month;
结果以科学计算法的方式表示如图:
日志数据可视化
将上一步5的分析结果保存到本地文件并进行数据可视化。
数据可视化的功能是帮助人们更好地分析数据,具有较高的识别效率,有效明确地传递信息,可以强化认知理解,能够帮助人们提高理解与处理数据的效率
1.将第五题查询结果保存到本地,代码如下:
insert overwrite local directory '/home/ubuntu/20220706_ComExperiment/'row format delimited fieldsterminatedby','select b.month,b.month_total/b.year_total from(selectdistinct a.month_total,a.year_total,substr(a.request_time,4,8)asmonthfrom(select*,sum(num)over(partitionby substr(request_time,4,8))month_total,sum(num)over(partitionby substr(request_time,8,4))year_total from logdata)a)b where year_total isnotNULL;
成功执行结果如图:

查看文件如图:
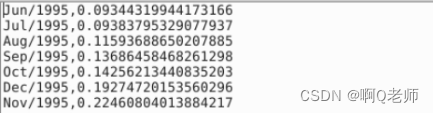
查看内容如图:
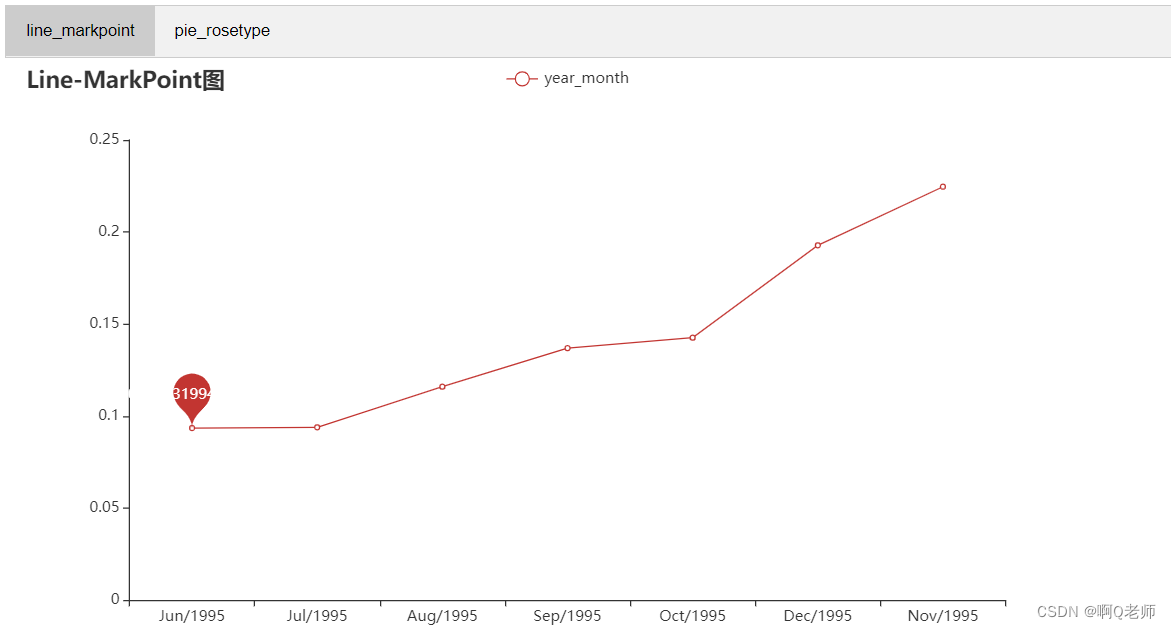
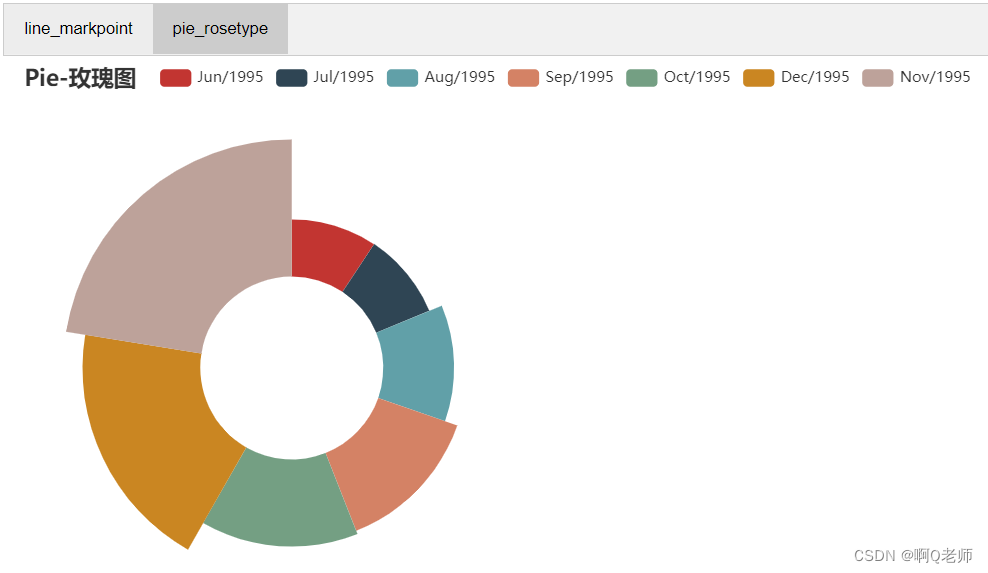
2.用分页组件Tab实现饼图与折线图,代码如下:
from pyecharts import options as opts
from pyecharts.charts import Line, Tab, Pie
import pandas as pd

data = pd.read_csv('/home/ubuntu/20220706_ComExperiment/000000_0', header=None)
data.columns =['year_month','rate']
year_month = data['year_month'].tolist()
rate = data['rate'].tolist()defline_markpoint()-> Line:
    c =(
        Line().add_xaxis(year_month).add_yaxis("year_month",
            rate,
            label_opts=opts.LabelOpts(is_show=False),
            markpoint_opts=opts.MarkPointOpts(data=[opts.MarkPointItem(type_="min")]),).set_global_opts(title_opts=opts.TitleOpts(title="Line-MarkPoint图")))return c

defpie_rosetype()-> Pie:
    v = year_month
    c =(
        Pie().add("year_month",[list(z)for z inzip(v, rate)],
            radius=["30%","75%"],
            center=["25%","50%"],
            rosetype="radius",
            label_opts=opts.LabelOpts(is_show=False),).set_global_opts(title_opts=opts.TitleOpts(title="Pie-玫瑰图")))return c

tab = Tab()
tab.add(line_markpoint(),"line_markpoint")
tab.add(pie_rosetype(),"pie_rosetype")
tab.render("/home/ubuntu//tab_base.html")
结果如图:
版权归原作者 啊Q老师 所有, 如有侵权,请联系我们删除。