文章目录
一、安装使用streamlit
pip install streamlit
创建一个python文件
demo.py
,使用命令行运行在浏览器上
streamlit run demo.py
。
import streamlit as st
import numpy as np
import pandas as pd
st.title("This is my first app")
st.write("hello")


二、streamlit使用
官方文档 Streamlit documentation
中文文档
可参考博客1-专栏
streamlit
提供了基于
python
的
web应用程序框架
,以高效灵活的方式可视化数据。主要功能
streamlit对数据可视化渲染,表格、地图、折线图等方法web页面需要的UI 组件、会话、侧边栏、多页展示的用法。- 缓存数据,更快的加载页面和操作。可用于数据计算、数据库查询、接口调用、运行ML模型。
- 支持渲染
markdown字符串,展示文档。 - Markdown 是一种轻量级标记语言,它允许人们使用易读易写的纯文本格式编写文档(提供了标题、段落、列表、代码、图片表格、数学公式等标记)。
1.展示和数据样式
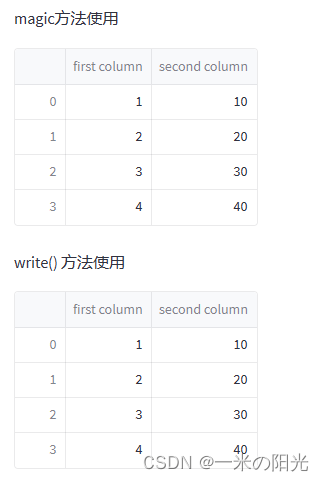
magic方法
和
write()方法
import streamlit as st
import numpy as np
import pandas as pd
st.title("This is my first app")# 有很多方式展示数据 (表格、数组、pandas的表格数据结构),magic方法、st.write()方法# magic方法
st.write("magic方法使用")
df = pd.DataFrame({'first column':[1,2,3,4],'second column':[10,20,30,40]})# pd.DataFrame( data, index, columns, dtype, copy)# data数据,index 行标签,columns列标签 默认为np.arange(n),dtype 每一列数据类型,copy 能复制数据默认false

df  # 每当Streamlit在自己的行中看到变量或文字值时,它都会使用st.write()自动将其写入您的应用程序。# st.write()方法,可以自动渲染 文本、数据、Matplotlib图形、Altair图表等等。
st.write("write() 方法使用")
st.write(pd.DataFrame({'first column':[1,2,3,4],'second column':[10,20,30,40]}))
2.
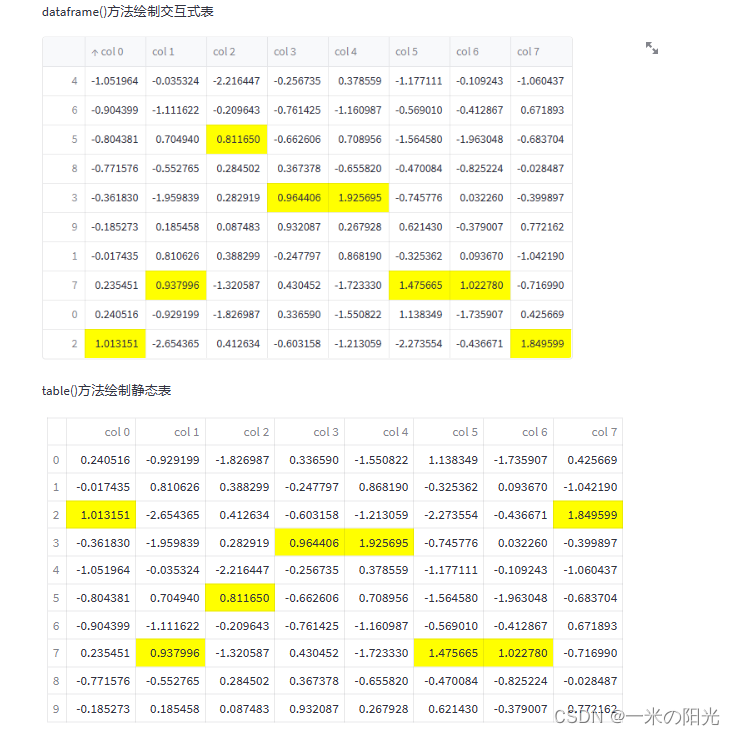
dataframe()
生成交互表和
table()
方法生成静态表
# 其他特定功能函数 st.dataframe() st.table()

st.write("dataframe()方法绘制交互式表")
dataframe = np.random.randn(5,3)
st.dataframe(dataframe)

dataframe = pd.DataFrame(
    np.random.randn(10,8),
    columns=('col %d'% i for i inrange(8)))# 这里定义了列号
st.dataframe(dataframe.style.highlight_max(axis=0))# 高亮每列最大值# 默认的dataframe功能太少,st_aggrid 插件功能更多

st.write("table()方法绘制静态表")
st.table(dataframe.style.highlight_max(axis=0))
3.绘制折线图
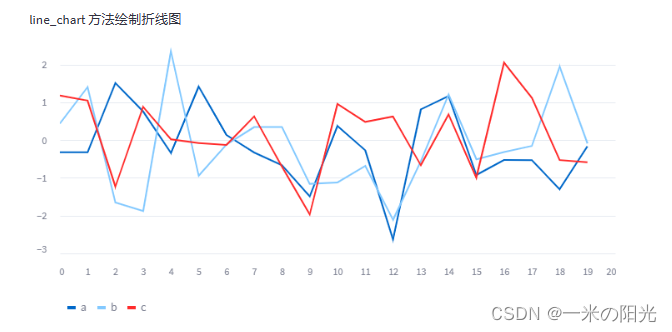
st.write("line_chart 方法绘制折线图")
chart_data = pd.DataFrame(
    np.random.randn(20,3),
    columns=['a','b','c'])
st.line_chart(chart_data)
4.绘制地图
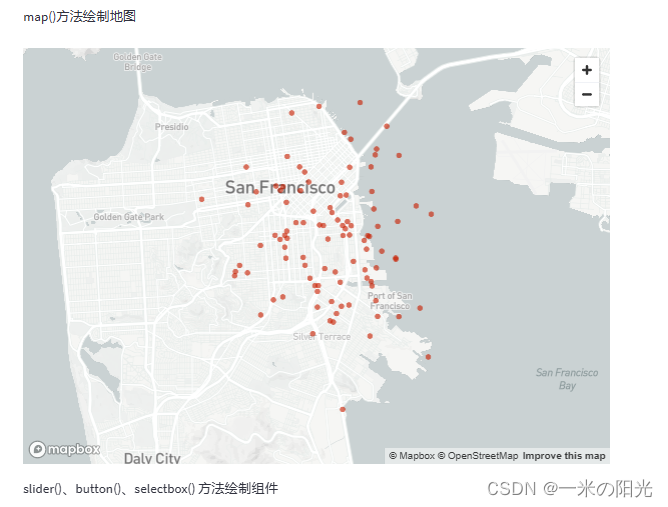
st.write("map()方法绘制地图")
map_data = pd.DataFrame(
    np.random.randn(100,2)/[50,50]+[37.76,-122.4],
    columns=['lat','lon'])# 生成100个旧金山附近符合正态分布的坐标
st.map(map_data)
5.一些组件
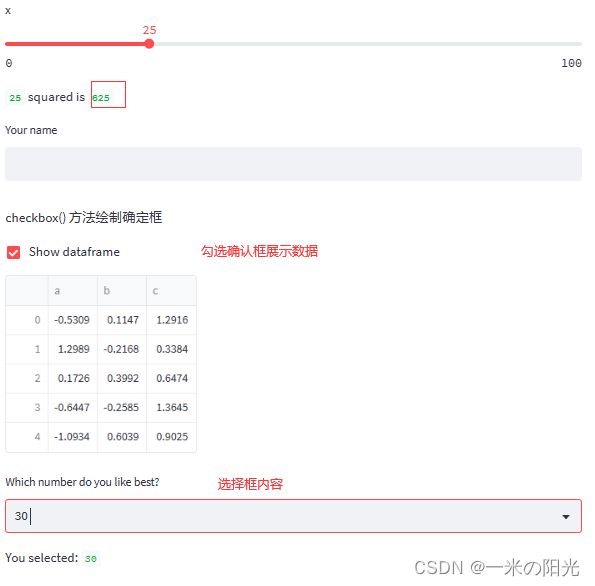
slider()滑动条 checkbox()确认框 selectbox()选择器
# 组件
st.write("slider()、button()、selectbox() 方法绘制组件")

x = st.slider('x')# 👈 this is a widget
st.write(x,'squared is', x * x)

st.text_input("Your name", key="name")# 任何带键的组件会自动的加载到会话状态中
st.session_state.name  # name是# 确认框
st.write("checkbox() 方法绘制确定框")if st.checkbox('Show dataframe'):
    chart_data = pd.DataFrame(
        np.random.randn(20,3),
        columns=['a','b','c'])
    chart_data

df = pd.DataFrame({'first column':[1,2,3,4],'second column':[10,20,30,40]})

option = st.selectbox('Which number do you like best?',
    df['second column'])'You selected: ', option
6.侧边栏
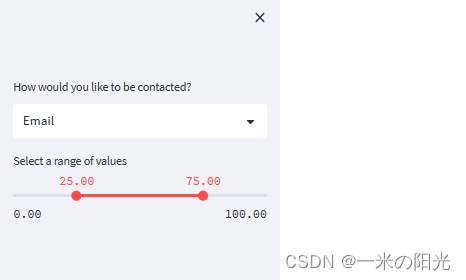
# 添加侧边栏组件--选择器
add_selectbox = st.sidebar.selectbox('How would you like to be contacted?',('Email','Home phone','Mobile phone'))# 添加侧边栏组件滑动条
add_slider = st.sidebar.slider('Select a range of values',0.0,100.0,(25.0,75.0))
7.布局分列
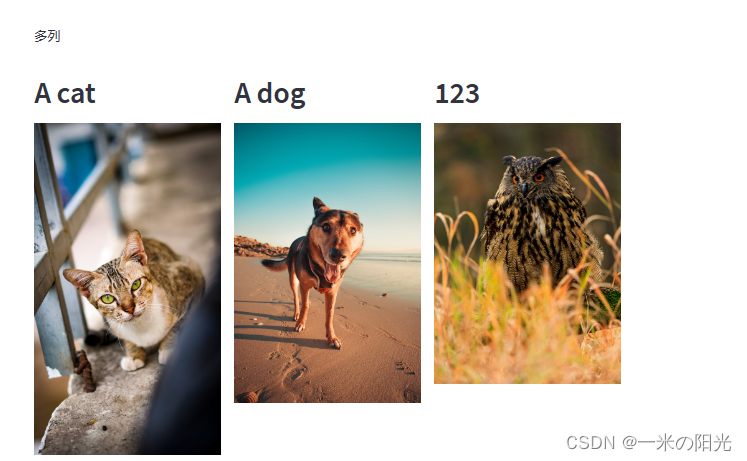
st.write("多列")
col1, col2, col3 = st.columns(3)# 分三列 col1,col2,col3with col1:
    st.header("A cat")
    st.image("https://static.streamlit.io/examples/cat.jpg")with col2:
    st.header("A dog")
    st.image("https://static.streamlit.io/examples/dog.jpg")with col3:
    st.header(test1.getData())
    st.image("https://static.streamlit.io/examples/owl.jpg")
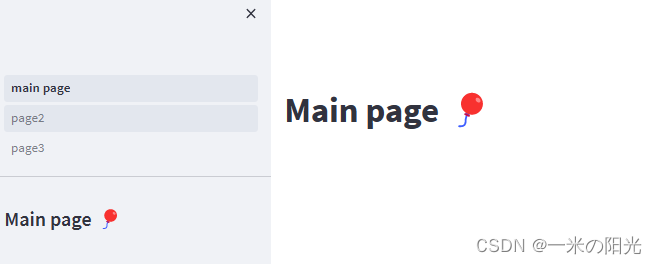
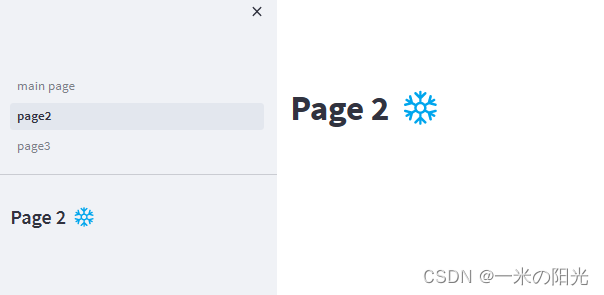
8.多页
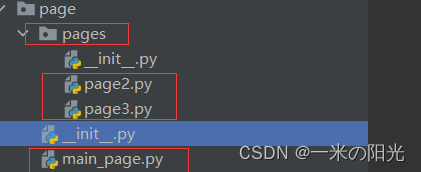
定义三个
python
页面
main_page.py
,新文件夹一定取名字为
pages
子文件
page2.py、page3.py
# main_page.py内容import streamlit as st

st.markdown("# Main page 🎈")
st.sidebar.markdown("# Main page 🎈")# page2.py内容import streamlit as st

st.markdown("# Page 2 ❄️")
st.sidebar.markdown("# Page 2 ❄️")# page3.py内容import streamlit as st

st.markdown("# Page 3 🎉")
st.sidebar.markdown("# Page 3 🎉")
三、Steamlit可视化简单应用–冒泡排序可视化
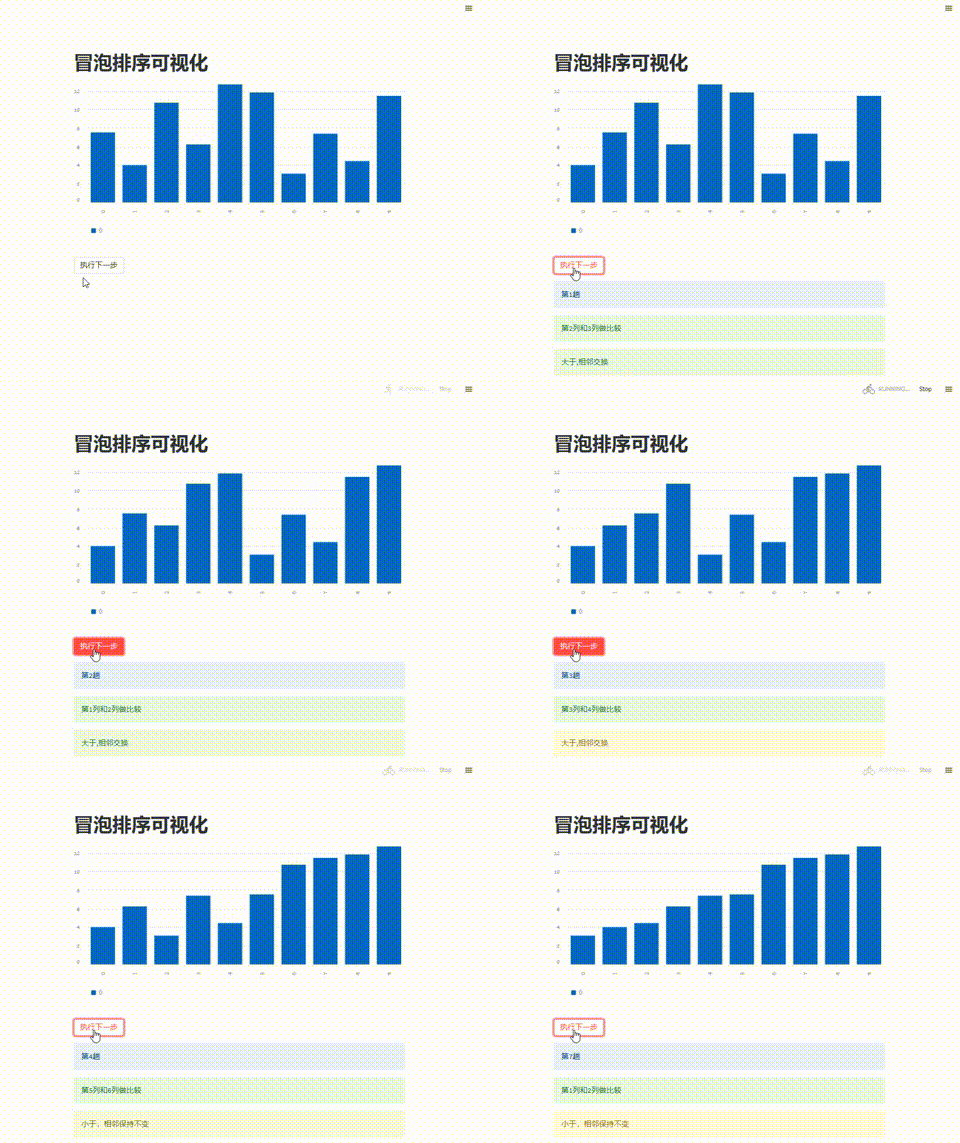
streamlit
可以专门针对机器学习和数据科学开发可视化界面。在使用时可以引用
python
、
sklearn
、
pytorch
、
tensorflow
、
numpy
、
opencv
等库,下面基于
streamlit
实现了冒泡排序可视化。
详细实现
版权归原作者 一米の阳光 所有, 如有侵权,请联系我们删除。