
文章目录

⭐前言
大家好,我是yma16,本文分享关于 前端vite+vue3——可视化页面性能耗时(fmp、fp)。
fmp的定义
FMP(First Meaningful Paint)是一种衡量网页加载性能的指标。它表示在加载过程中,浏览器首次渲染出有意义的内容所花费的时间。有意义的内容指的是用户可以看到和交互的元素,如文本、图片、按钮等。
首次渲染的定义可以根据具体的要求和场景而有所不同。通常情况下,首次渲染是指在页面加载过程中,浏览器首次绘制出用户能够理解和识别的内容,而不是空白页面或加载指示符。
FMP的计算方法可以根据不同的标准和工具而有所差异,但通常会考虑页面上可见的内容和用户可交互的元素。在计算FMP时,一般会排除一些延迟加载的元素,如懒加载的图片或动态加载的内容,以确保测量的是真正有意义的渲染时间。
fp的定义
FP(First Paint)是指浏览器首次将像素渲染到屏幕上的时间点
传统性能指标 Performance
Performance 接口可以获取到当前页面中与性能相关的信息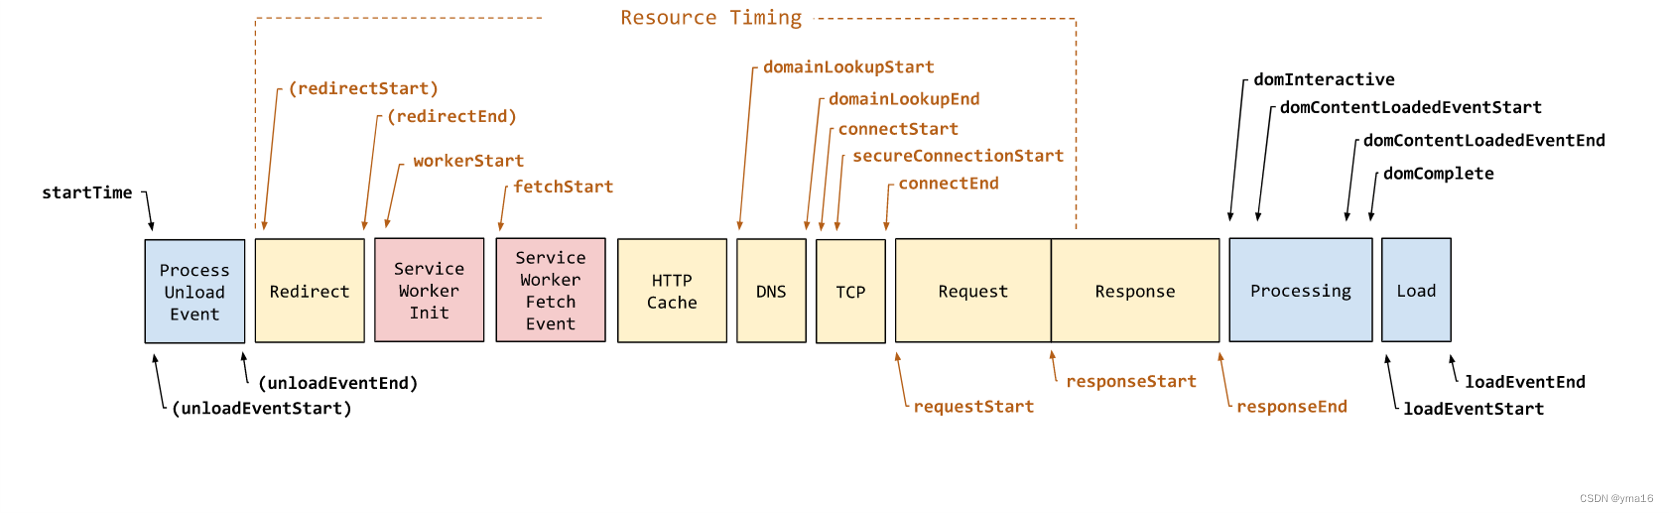
performance 参数解析
domLoading: 浏览器即将开始解析第一批收到的 HTML 文档字节,Document.readyState 变为 loading。
domInteractive: 当前网页 DOM结构结束解析、开始加载内嵌资源的时间点。Document.readyState 变为 interactive。
domContentLoadedEventStart: 当解析器发送 DomContentLoaded 事件,所有需要被执行的脚本已经被解析。
domContentLoadedEventEnd: 所有需要立即执行的脚本已经被执行。
domComplete: 当前文档解析完成, Document.readyState 变为 complete。
loadEventStart: 作为每个网页加载的最后一步,浏览器会触发 load 事件,以便触发额外的应用逻辑。如果这个事件还未被发送,它的值将会是 0。
loadEventEnd:load 事件执行完成。如果这个事件还未被发送,或者尚未完成,它的值将会是 0。

💖vue3系列文章
vue3 + fastapi 实现选择目录所有文件自定义上传到服务器
前端vue2、vue3去掉url路由“ # ”号——nginx配置
csdn新星计划vue3+ts+antd赛道——利用inscode搭建vue3(ts)+antd前端模板
认识vite_vue3 初始化项目到打包
python_selenuim获取csdn新星赛道选手所在城市用echarts地图显示
让大模型分析csdn文章质量 —— 提取csdn博客评论在文心一言分析评论区内容
前端vue3——html2canvas给网站截图生成宣传海报
vue3+echarts可视化——记录我的2023编程之旅
前端vite+vue3——自动化配置路由布局
⭐可视化fmp、fp指标
由于vue是SPA(single-page application)单页面项目,会导致首次加载时间长:SPA需要加载整个应用的代码和资源,首次加载时间可能会比传统的多页面应用长。
以下是我个人计算fmp的逻辑
- fmp:监听 vue挂载的节点(dom的id为root)首次变化时间
- fp: 监听 beforeMounted的时间为白屏结束时间
计算的单位使用performance.now
performance.now()是一个JavaScript方法,用于获取当前时间戳,精确到毫秒级。它返回一个DOMHighResTimeStamp对象,表示从性能测量器启动到调用performance.now()的时间间隔。这个方法通常用于性能测量和性能优化,可以用于计算代码执行时间、动画帧率、网络请求延迟等。
💖 MutationObserver 计算 dom的变化
MutationObserver 接口提供了监视对 DOM 树所做更改的能力
使用示例:
// 选择需要观察变动的节点const targetNode = document.getElementById("some-id");// 观察器的配置(需要观察什么变动)const config ={attributes:true,childList:true,subtree:true};// 当观察到变动时执行的回调函数constcallback=function(mutationsList, observer){// Use traditional 'for loops' for IE 11for(let mutation of mutationsList){if(mutation.type ==="childList"){
      console.log("A child node has been added or removed.");}elseif(mutation.type ==="attributes"){
      console.log("The "+ mutation.attributeName +" attribute was modified.");}}};// 创建一个观察器实例并传入回调函数const observer =newMutationObserver(callback);// 以上述配置开始观察目标节点
observer.observe(targetNode, config);// 之后,可停止观察
observer.disconnect();
在vue的入口页面app.vue编写监听rootDom变化的逻辑
mutationAction 函数如下(将节点的高度大于0作为结束监听的条件即fmp的结束时间)
// 监听 dom变化mutationAction(listenDom, callbackAction){// 观察器的配置(需要观察什么变动)const config ={attributes:true,childList:true,subtree:true};// 当观察到变动时执行的回调函数constcallback=function(mutationsList, observer){// 渲染高度const renderHeight = listenDom.offsetHeight
        if(parseInt(renderHeight)){// 第一次监听dom 存在高度则判定已经渲染完root节点callbackAction()// 停止观察
            observer.disconnect();}};// 创建一个观察器实例并传入回调函数const observer =newMutationObserver(callback);// 以上述配置开始观察目标节点
    observer.observe(listenDom, config);}
在App.vue的声明周期onBerforeMount运行
<script setup>import{ ref, onBeforeMount }from"vue";// 查找次数,用于统计最大查找次数避免奔溃const findAppCount =ref(0)// 监听 dom变化mutationAction(listenDom, callbackAction){// 观察器的配置(需要观察什么变动)const config ={attributes:true,childList:true,subtree:true};// 当观察到变动时执行的回调函数constcallback=function(mutationsList, observer){// 渲染高度const renderHeight = listenDom.offsetHeight
        if(parseInt(renderHeight)){// 第一次监听dom 存在高度则判定已经渲染完root节点callbackAction()// 停止观察
            observer.disconnect();}};// 创建一个观察器实例并传入回调函数const observer =newMutationObserver(callback);// 以上述配置开始观察目标节点
    observer.observe(listenDom, config);}constfindAppDom=()=>{const appDom = document.getElementById('app')
  findAppCount.value +=1if(appDom){mutationAction(appDom,()=>{const fmp=performance.now()})}elseif(findAppCount <=1000){findAppDom()}}onBeforeMount(()=>{// 白屏时间const fp = performance.now()findAppDom();})</script>
💖 使用条形图展示 fmp、fp时间
使用条形图对性能指标耗时进行可视化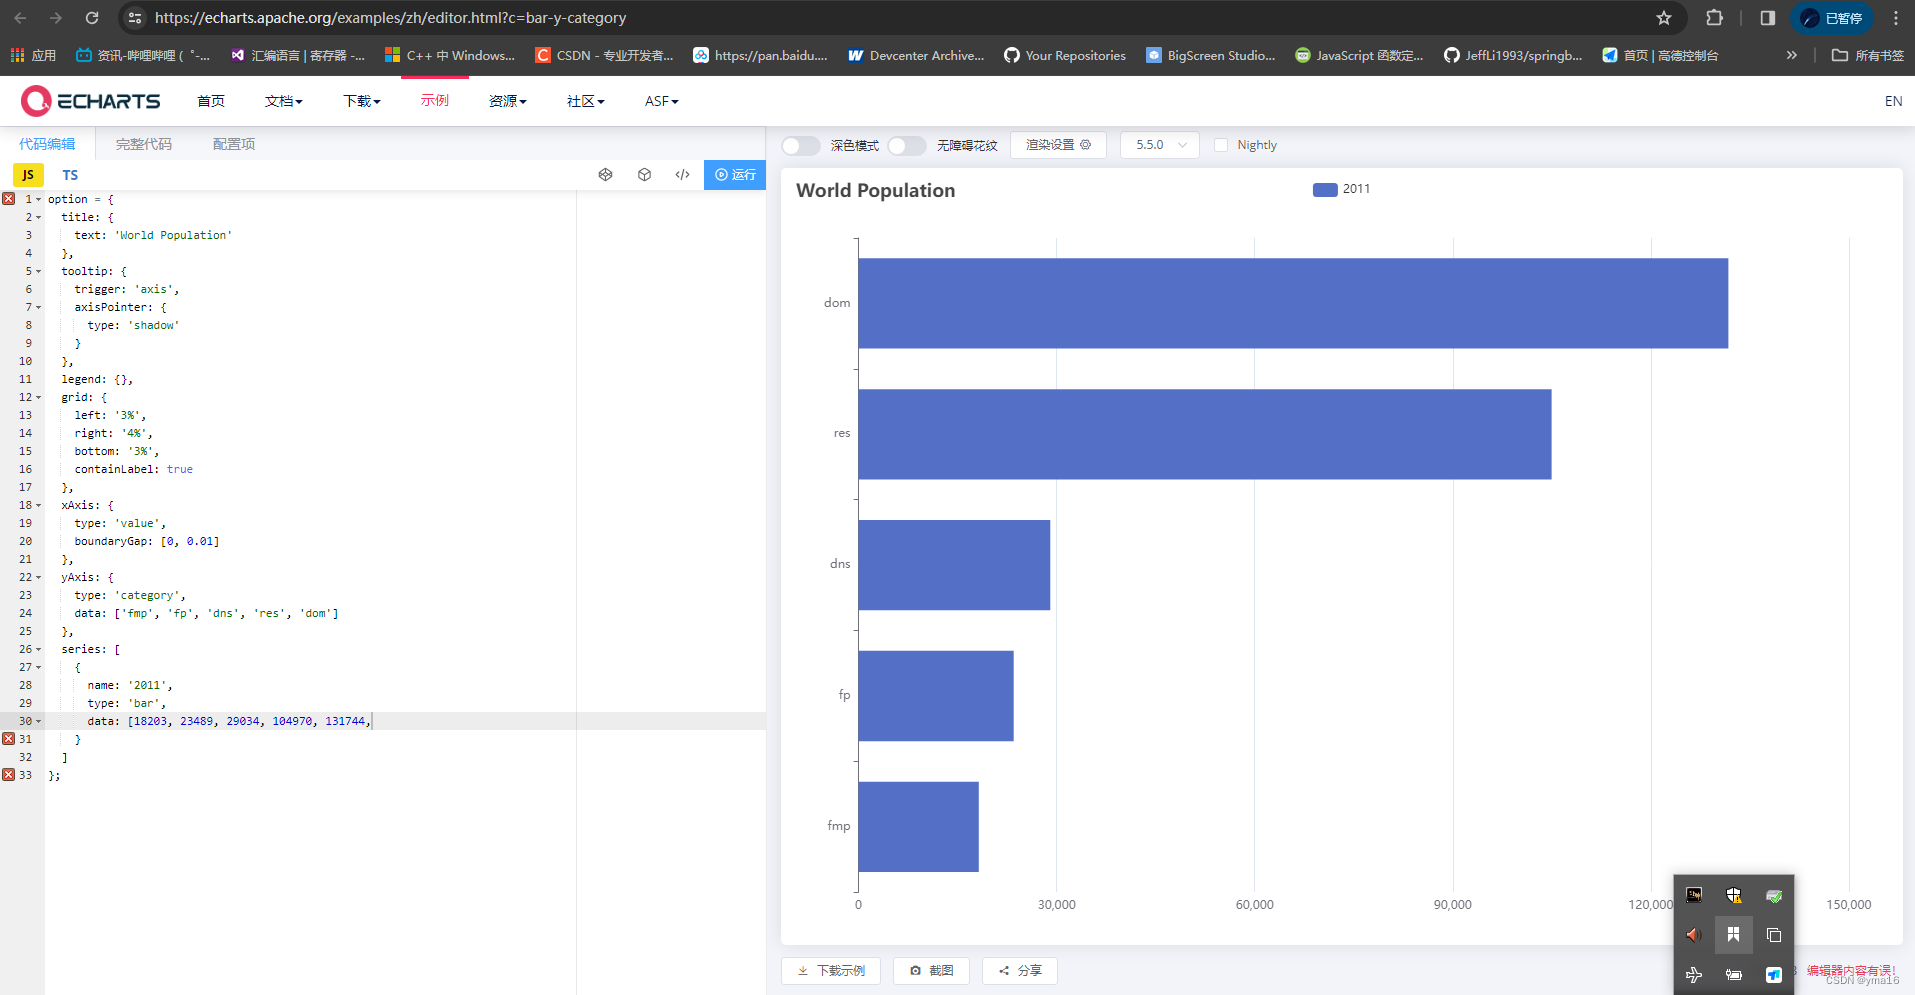
条形图展示数据的vue界面编写
<script lang="js" setup>import{ reactive, onMounted }from'vue';import*as echarts from'echarts';import{ useStore }from"vuex";const store =useStore();const state =reactive({leftTitle:'原生的performance',leftDomId:'visual-performance-id',rightTitle:'性能指标可视化',rightDomId:'visual-performance-id-right',chartTitle:'性能指标',echartInstance:null,})constinitLeftChart=()=>{// 基于准备好的dom,初始化echarts实例const domInstance = document.getElementById(state.leftDomId)if(domInstance){
        domInstance.removeAttribute('_echarts_instance_')}else{return}
    console.log(performance)
    console.log(Object.keys(performance.timing))const label =[]const data =[]for(let key in performance.timing){if(key !='toJSON'){
            label.push(key)
            data.push(performance.timing[key])}}const myChart = echarts.init(domInstance);const option ={title:{text:'performance'},tooltip:{trigger:'axis',axisPointer:{type:'shadow'}},legend:{},grid:{left:'3%',right:'4%',bottom:'3%',containLabel:true},xAxis:{type:'value',boundaryGap:[0,0.01]},yAxis:{type:'category',data: label
        },series:[{name:'performance',type:'bar',data: data
            }]};
    console.log('option', option)// 使用刚指定的配置项和数据显示图表。
    myChart.setOption(option,true);// 监听
    state.echartInstance = myChart;
    myChart.on('click',function(params){
        console.log('params', params)});
    window.onresize = myChart.resize;}constinitRightChart=()=>{// 基于准备好的dom,初始化echarts实例const domInstance = document.getElementById(state.rightDomId)if(domInstance){
        domInstance.removeAttribute('_echarts_instance_')}else{return}const performanceConfig = store.getters["common/performanceConfig"]

    console.log('performanceConfig________________', performanceConfig)const label =[]const data =[]

    Object.keys(performanceConfig).forEach(key=>{
        data.push(performanceConfig[key])
        label.push(key)})const myChart = echarts.init(domInstance);const option ={title:{text:'自定义计算fmp'},tooltip:{trigger:'axis',axisPointer:{type:'shadow'}},legend:{},grid:{left:'3%',right:'4%',bottom:'3%',containLabel:true},xAxis:{type:'value',boundaryGap:[0,0.01]},yAxis:{type:'category',data: label
        },series:[{name:'fmp计算',type:'bar',data: data
            }]};
    console.log('option', option)// 使用刚指定的配置项和数据显示图表。
    myChart.setOption(option,true);// 监听
    state.echartInstance = myChart;
    myChart.on('click',function(params){
        console.log('params', params)});
    window.onresize = myChart.resize;}onMounted(()=>{initLeftChart()initRightChart()})</script><template><div><div style="display:flex;"><a-card :title="state.leftTitle" style="width: 600px"><div :id="state.leftDomId" style="width: 500px;height:600px;"></div></a-card><a-card :title="state.rightTitle" style="width: 600px;margin-left:20px"><div :id="state.rightDomId" style="width: 500px;height:600px;"></div><div></div></a-card><a-card style="margin-left:20px" title="定义"><div><div>
                        fetchStart:浏览器发起资源请求时,有缓存时,则返回读取缓存的开始时间。<br>

                        domainLookupStart:查询 DNS 的开始时间。<br>

                        domainLookupEnd:查询 DNS 的结束时间。<br>

                        connectStart:浏览器开始与服务器连接时的时间。<br>

                        secureConnectionStart:如果页面使用 HTTPS,它的值是安全连接握手之前的时刻。<br>

                        connectEnd:当浏览器端完成与服务器端建立连接的时刻。<br>

                        responseStart:指客户端收到从服务器端(或缓存、本地资源)响应回的第一个字节的数据的时刻。<br>

                        responseEnd:指客户端收到从服务器端(或缓存、本地资源)响应回的最后一个字节的数据的时刻。<br></div></div></a-card></div></div></template>
效果: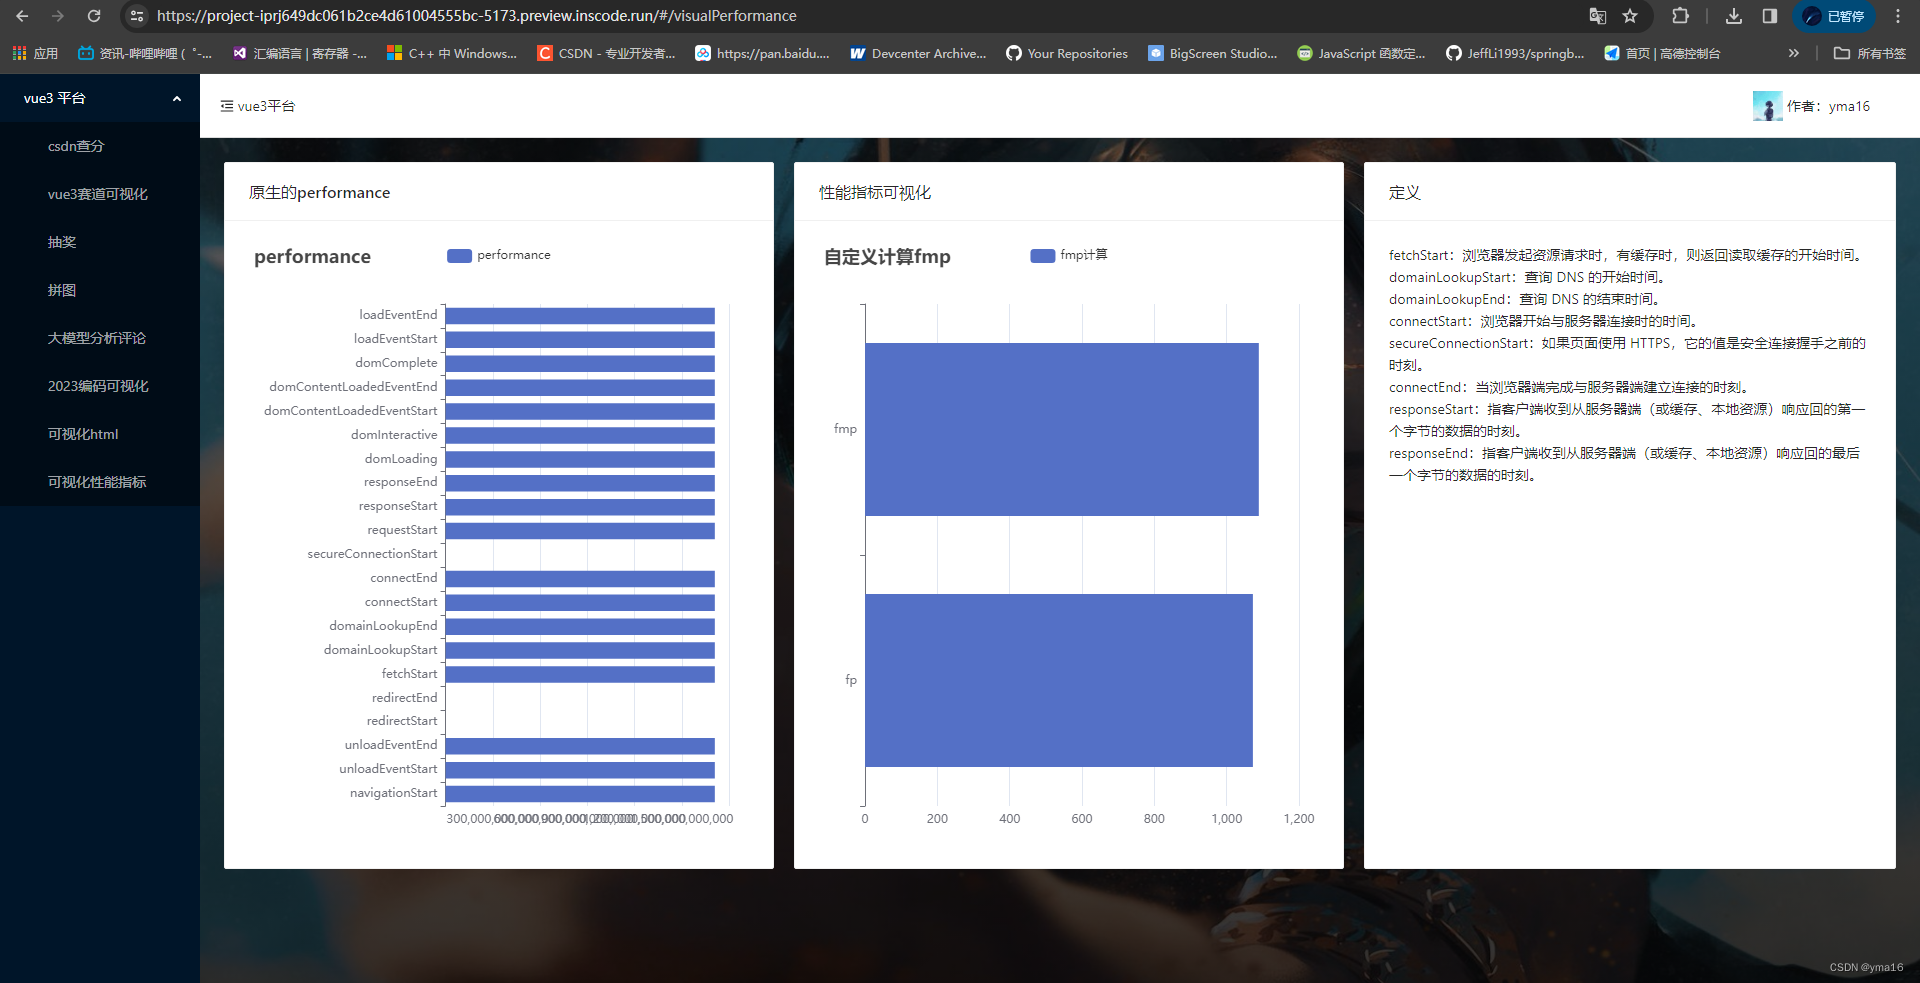
⭐项目代码
前端项目inscode如下:
⭐结束
本文分享到这结束,如有错误或者不足之处欢迎指出!
👍 点赞,是我创作的动力!
⭐️ 收藏,是我努力的方向!
✏️ 评论,是我进步的财富!
💖 最后,感谢你的阅读!
版权归原作者 yma16 所有, 如有侵权,请联系我们删除。