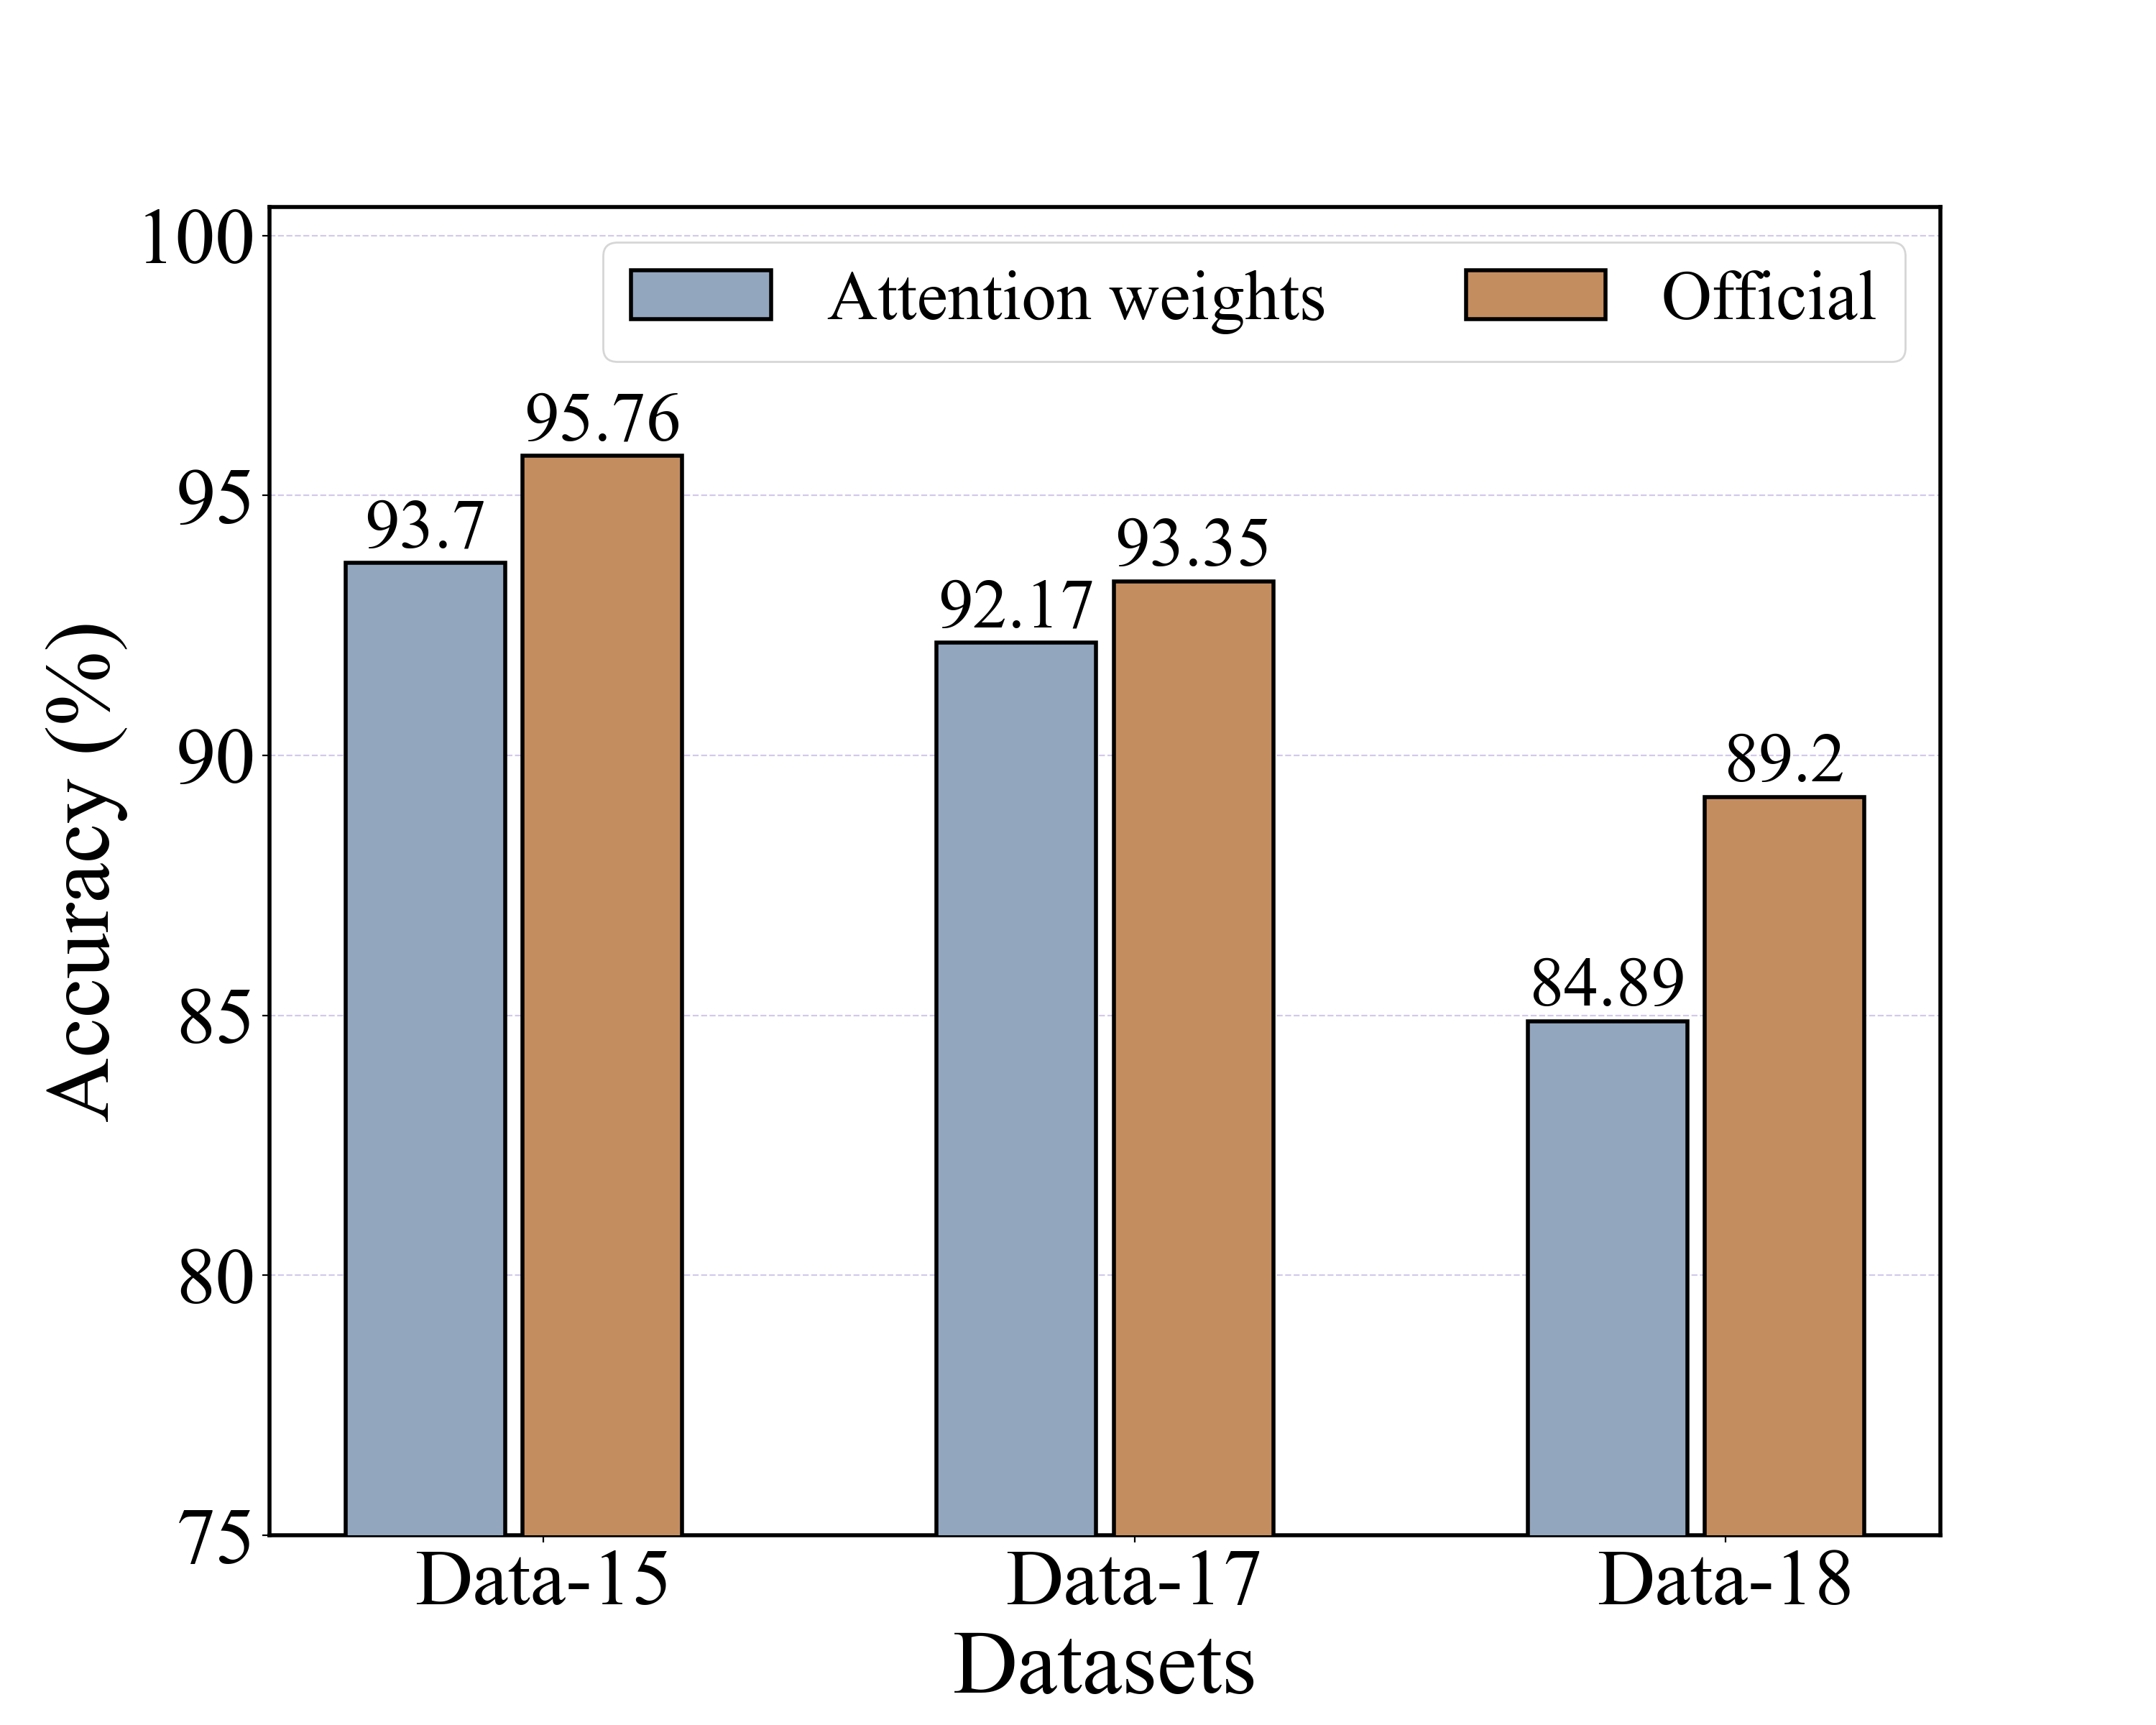
本人写论文时画的图,总结一下方法: 安心看下去,你应该就可以画出一个好看的柱状图,基本上需要的设置都有哦!!!
1 首先引入画图所需要的包Matplotlib
Matplotlib 是 Python 的绘图库,它能让使用者很轻松地将数据图形化,并且提供多样化的输出格式。
Matplotlib 可以绘制线图、散点图、等高线图、条形图、柱状图、3D 图形、甚至是图形动画等等。
Matplotlib 通常与 NumPy 和 SciPy(Scientific Python)一起使用
2 Matplotlib Pyplot
Pyplot 是 Matplotlib 的子库,提供了和 MATLAB 类似的绘图 API。
Pyplot 是常用的绘图模块,能很方便让用户绘制 2D 图表。
使用 import 导入 pyplot 库,并设置一个别名 plt:
import matplotlib.pyplot as plt
3 画柱状图
这里我画的柱状图有以下设置:(应该包含了对柱状图画图的所有基本设置)
- 图的边框要设置成黑色,边框线宽为2;
- 图内部要包含网格线;
- 柱状图中柱子也要包含边框,边框颜色为黑色;
- 网格线要位于柱子的下方;
- 图片字体要设置成‘Times New Roman’,要对图片所有字体的大小进行设置;
- y轴域值也要进行设置,不是从0开始;
- 图片的标签(图标)要横着排列(不是竖着排列);
- 柱子上方要显示具体数值;
- 一个标签对应多个柱子(为了做对比)
画出的图片展示:

(1) 首先,设置X轴标签,以及X轴标签对应的y值。
import matplotlib.pyplot as plt

# X轴标签
x = ['Data-15','Data-17','Data-18']

# 这里是一个标签对应两个柱子,所以有两个数组(这实际上是不同模型在同一数据集上的的f1值对比)
f1_1 = [93.70,92.17,84.89]
f1_2 = [95.76,93.35,89.20]
(2)要定位好柱子的开始位置(因为上述设置了3个X轴标签,所以这里要定位3个柱子的开始位置)
x_len = np.arange(len(x))
total_width, n = 0.9, 3
width = total_width/n
# xticks 就是三个柱子的开始位置
xticks = x_len - (total_width - width) / 2
可以看一下 x_len 和 xticks具体对应的值:
x_len
Out[1]: array([0, 1, 2])
xticks
Out[2]: array([-0.3,  0.7,  1.7])
(3)定义图片大小,为图片画上网格
具体的解释,代码里有写;
plt.figure(figsize=(15, 12), dpi=200)
# 这里定义ax,是为了后面画图的边框所用
ax = plt.axes()
# axis取值可以为'both','x','y', both是网格,x是只有垂直于x轴的线,y是只有垂直于yz轴的线
# c是设置线的颜色,linestyle 是画出的线的类型, zorder 是让线位于柱子下面而设置的,其值越小,线越靠下
plt.grid(axis="y", c='#d2c9eb', linestyle = '--',zorder=0)
(4)开始画柱子,并设置画柱子所需要的属性
    因为每个X轴标签都对应了两个柱子,所以这里要调用两个plt.bar;

    也就是说调用几个plt.bar,每个x轴标签就画几个柱子;

    具体属性的解释,看下面代码中的注释;
# 画第一个柱子,是批量画的,X轴的每个标签都开始画第一个柱子
# f1_1就是X轴所有标签对应的第一个柱子的y值
# width是设置柱子的宽度
# label就是图例
# color设置颜色
# edgecolor是设置柱子框的颜色
# linewidth是设置柱子框的线宽
# zorder 是保证柱子位于网格线的上方

plt.bar(xticks, f1_1, width=0.9*width, label="Attention weights", color="#7e728c",edgecolor='black',linewidth = 2,  zorder=10)

# xticks + width,表示的是X轴所有标签第二个柱子的起始位置
plt.bar(xticks + width, f1_2, width=0.9*width, label="Official", color="#46513c",edgecolor='black',linewidth = 2, zorder=10)
(4)为柱子上方添加数值
顺便设置数字的字体;
# 这是为X轴所有标签的第一个柱子写上值
# f1_1[0] + 0.3 表示写的值要距离柱子0.3个单位
# f1_1[0]是具体要写的值
# ha='center' 表示值要居中写
# fontproperties 是设置字体类型
# fontsize 设置字体大小
# zorder=10 表示位于网格线上方

plt.text(xticks[0], f1_1[0] + 0.3, f1_1[0], ha='center',fontproperties='Times New Roman',  fontsize=35,  zorder=10)
plt.text(xticks[1], f1_1[1] + 0.3, f1_1[1], ha='center', fontproperties='Times New Roman', fontsize=35,  zorder=10)
plt.text(xticks[2], f1_1[2] + 0.3, f1_1[2], ha='center', fontproperties='Times New Roman', fontsize=35,  zorder=10)

# 这是为X轴所有标签的第二个柱子写上值

plt.text(xticks[0] + width, f1_2[0] + 0.3, f1_2[0], ha='center',fontproperties='Times New Roman', fontsize=35,  zorder=10)
plt.text(xticks[1] + width, f1_2[1] + 0.3, f1_2[1], ha='center',fontproperties='Times New Roman', fontsize=35,  zorder=10)
plt.text(xticks[2] + width, f1_2[2] + 0.3, f1_2[2], ha='center', fontproperties='Times New Roman',fontsize=35,  zorder=10)
(5)设置图例的字体
# ncol = 2 表示图例要放两列
plt.legend(prop={'family' : 'Times New Roman', 'size': 35}, ncol = 2)
(6)设置X轴,Y轴标签的字体及大小
# x_len表示X轴的标签写在哪个坐标位置,有事可能x_len有变差,需要手动调一下他的值,不过偏差不会很大
plt.xticks(x_len, x, fontproperties='Times New Roman',fontsize = 40)
plt.yticks(fontproperties='Times New Roman',fontsize = 40)
(7)控制Y轴的值
plt.ylim(75,90)
# 或者只设置最小值
plt.ylim(ymin=75)
(8)设置对柱状图X轴的说明和Y轴的说明
plt.xlabel("Datasets", fontproperties='Times New Roman',fontsize=45)
plt.ylabel("Accuracy (%)",fontproperties='Times New Roman', fontsize=45)
(9)为柱状图画黑色的框
# 底部线
ax.spines['bottom'].set_linewidth('2.0')#设置边框线宽为2.0
ax.spines['bottom'].set_color('black')
# 顶部线
ax.spines['top'].set_linewidth('2.0')#设置边框线宽为2.0
ax.spines['top'].set_color('black')
# 右侧线
ax.spines['right'].set_linewidth('2.0')#设置边框线宽为2.0
ax.spines['right'].set_color('black')
# 左侧线
ax.spines['left'].set_linewidth('2.0')#设置边框线宽为2.0
ax.spines['left'].set_color('black')
(10)显示图
plt.show()
4 整体代码
大家可以在这里复制全部代码,跑出上面的柱状图。
import json
import torch
import numpy as np
import pandas as pd
import matplotlib.pyplot as plt

f1_1 = [93.70,92.17,84.89]
f1_2 = [95.76,93.35,89.20]

x = ['Data-15','Data-17','Data-18']
x_len = np.arange(len(x))
total_width, n = 0.9, 3
width = 0.3
xticks = x_len - (total_width - width) / 2
plt.figure(figsize=(15, 12), dpi=200)

ax = plt.axes()
plt.grid(axis="y", c='#d2c9eb', linestyle = '--',zorder=0)
plt.bar(xticks, f1_1, width=0.9*width, label="Attention weights", color="#92a6be",edgecolor='black',linewidth = 2,  zorder=10)
plt.bar(xticks + width, f1_2, width=0.9*width, label="Official", color="#c48d60",edgecolor='black',linewidth = 2, zorder=10)
plt.text(xticks[0], f1_1[0] + 0.3, f1_1[0], ha='center',fontproperties='Times New Roman',  fontsize=35,  zorder=10)
plt.text(xticks[1], f1_1[1] + 0.3, f1_1[1], ha='center', fontproperties='Times New Roman', fontsize=35,  zorder=10)
plt.text(xticks[2], f1_1[2] + 0.3, f1_1[2], ha='center', fontproperties='Times New Roman', fontsize=35,  zorder=10)

plt.text(xticks[0] + width, f1_2[0] + 0.3, f1_2[0], ha='center',fontproperties='Times New Roman', fontsize=35,  zorder=10)
plt.text(xticks[1] + width, f1_2[1] + 0.3, f1_2[1], ha='center',fontproperties='Times New Roman', fontsize=35,  zorder=10)
plt.text(xticks[2] + width, f1_2[2] + 0.3, f1_2[2], ha='center', fontproperties='Times New Roman',fontsize=35,  zorder=10)

plt.legend(prop={'family' : 'Times New Roman', 'size': 35}, ncol = 2)
x_len = [-0.1,0.9,1.9]
x_len = np.array(x_len)
plt.xticks(x_len, x, fontproperties='Times New Roman',fontsize = 40)
plt.yticks(fontproperties='Times New Roman',fontsize = 40)
plt.ylim(ymin=75)
plt.xlabel("Datasets", fontproperties='Times New Roman',fontsize=45)
plt.ylabel("Accuracy (%)",fontproperties='Times New Roman', fontsize=45)
ax.spines['bottom'].set_linewidth('2.0')#设置边框线宽为2.0
ax.spines['bottom'].set_color('black')
ax.spines['top'].set_linewidth('2.0')#设置边框线宽为2.0
ax.spines['top'].set_color('black')
ax.spines['right'].set_linewidth('2.0')#设置边框线宽为2.0
ax.spines['right'].set_color('black')
ax.spines['left'].set_linewidth('2.0')#设置边框线宽为2.0
ax.spines['left'].set_color('black')

plt.show()
版权归原作者 无脑敲代码,bug漫天飞 所有, 如有侵权,请联系我们删除。