
基本思路:首先求出中心点的位置,然后判断一下当前label的位置是左边还是右边,如果是左边的话,中心点的位置 减去 label的宽度,如果是右边的话 中心点的位置加上 label的宽度。 因为图的大小不一样 可根据实际情况添加 一个数值,我这边添加的是50
labelLayout:标签的统一布局配置。
该配置项是在每个系列默认的标签布局基础上,统一调整标签的(x, y)位置,标签对齐等属性以实现想要的标签布局效果。
该配置项也可以是一个有如下参数的回调函数
// 标签对应数据的 dataIndexdataIndex: number
// 标签对应的数据类型,只在关系图中会有 node 和 edge 数据类型的区分
dataType?: string
// 标签对应的系列的 indexseriesIndex: number
// 标签显示的文本text: string
// 默认的标签的包围盒,由系列默认的标签布局决定labelRect:{x: number,y: number,width: number,height: number}// 默认的标签水平对齐align:'left'|'center'|'right'// 默认的标签垂直对齐verticalAlign:'top'|'middle'|'bottom'// 标签所对应的数据图形的包围盒,可用于定位标签位置rect:{x: number,y: number,width: number,height: number}// 默认引导线的位置,目前只有饼图(pie)和漏斗图(funnel)有默认标签位置// 如果没有该值则为 null
labelLinePoints?: number[][]
代码如下:
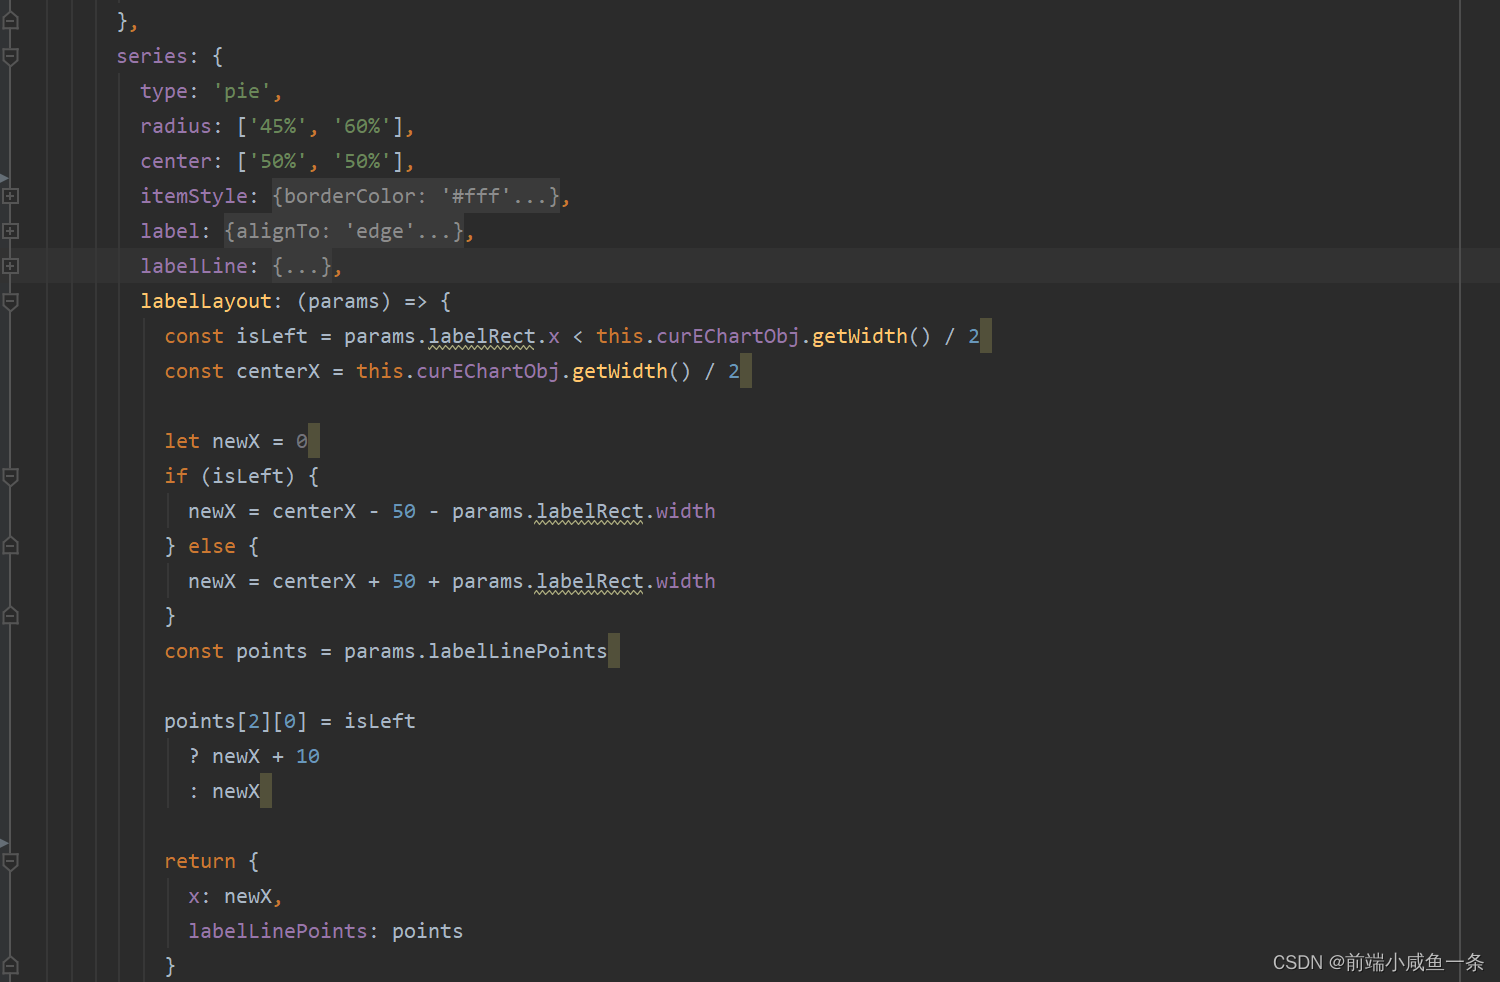
labelLayout:(params)=>{const isLeft = params.labelRect.x <this.curEChartObj.getWidth()/2const centerX =this.curEChartObj.getWidth()/2let newX =0if(isLeft){
              newX = centerX -50- params.labelRect.width
            }else{
              newX = centerX +50+ params.labelRect.width
            }const points = params.labelLinePoints

            points[2][0]= isLeft
              ? newX +10: newX

            return{x: newX,labelLinePoints: points
            }},
完整代码如下:
const option ={color:['#94b6f3','#5087ec','#b9cff7'],legend:{show:false},grid:{top:'1px',right:'1px',bottom:'1px',left:'2px'},series:{type:'pie',radius:['45%','60%'],center:['50%','50%'],itemStyle:{borderColor:'#fff',borderWidth:1},label:{alignTo:'edge',formatter:'{name|{b}}\n{time|{c}人}',minMargin:5,edgeDistance:10,lineHeight:15,width:58,padding:[0,6,0,10],// 关键代码!关键代码!关键代码!rich:{name:{align:'left'},time:{fontSize:12,color:'#333',align:'left'}}},labelLine:{length:15,length2:0,maxSurfaceAngle:80},labelLayout:(params)=>{const isLeft = params.labelRect.x <this.curEChartObj.getWidth()/2const centerX =this.curEChartObj.getWidth()/2let newX =0if(isLeft){
              newX = centerX -50- params.labelRect.width
            }else{
              newX = centerX +50+ params.labelRect.width
            }const points = params.labelLinePoints

            points[2][0]= isLeft
              ? newX +10: newX

            return{x: newX,labelLinePoints: points
            }},data: pieData
        }}
本文转载自: https://blog.csdn.net/xiaoxiannvh/article/details/128583236
版权归原作者 前端小咸鱼一条 所有, 如有侵权,请联系我们删除。
版权归原作者 前端小咸鱼一条 所有, 如有侵权,请联系我们删除。