
Go语言-测试与性能分析

在接触的几门计算机编程语言中,都会有与之对应的单元测试与性能分析方法或者工具。Go语言当然也不例外,本文将记录Go语言中测试与性能分析的内容,其目的是为了掌握Go语言中测试和性能分析和提出一些容易出现的问题。
目录
1. 测试
Go语言里有几种方法可用于单元测试:
- 基础测试 - 一组参数和结果测试代码
- 表组测试 - 多组参数和结果测试代码
1.1 单元测试
Go语言中要想进行单元测试,就必须使用
testing
包,它提供自动化测试工具。通过
go test
命令能够自动执行以下形式的函数:
funcTestXXX(*testing.T){...}
1.1.1 第一个单元测试
在使用单元测试之前,先写一个用于被测试的方法,这里写一个打乱slice得函数。
funcRandSlice(originSlice []interface{}){
    rand.Seed(time.Now().UnixNano())forlen(originSlice)>0{
        last :=len(originSlice)
        randIndex := rand.Intn(last)
        originSlice[last -1], originSlice[randIndex]= originSlice[randIndex], originSlice[last -1]
        originSlice = originSlice[:last-1]}}
创建一个test_test.go文件
package testFunc

import("testing")//*testing.T// The other reporting methods, such as the variations of Log and Error,// may be called simultaneously from multiple goroutines.funcTestRandSlice(t *testing.T){
    slice :=[]interface{}{1,2,3,4,5,6,7,8}RandSlice(slice)
    t.Errorf("预期不足 %v", slice)}
1.2 表组测试
所谓表组测试,就是用for循环去做测试,当一次测试结果失败的时候,应该继续还是退出,前面用的是
t.Errorf
测试失败不会退出,会在最后的时候输出。
总结几个方法的含义:
方法含义Fail记录失败信息,然后继续执行后续用例FailNow记录失败信息,所有测试终止SkipNow不会记录失败的用例信息,然后中止测试Skip记录失败信息,中断后续测试Skipf比前面多一个格式化输出Log输出错误日志,默认不输出成功的用例,不会中断Logf不会中断ErrorLog + Fail ,不会中断Errorf同上FatalLog + FailNow, 中断Fatalf相当于Logf + FailNow
1.3 test main
上面的测试用例都是基于函数,方法等无需 stepup/teardown 机制。下面介绍另一种测试方法
funcTestMain(t *testing.M){// step up 初始化工作
    code := m.Run()//tearDown
    os.Exit(code)}
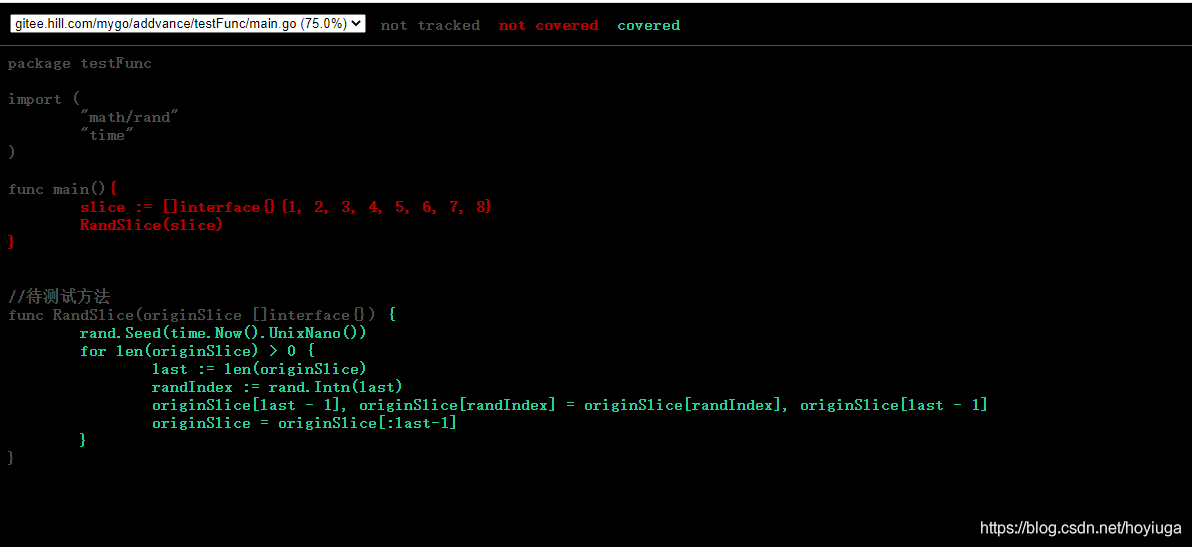
1.3 覆盖测试
Go提供分析单元测试覆盖率(触发运行的被测试diamante的代码行数占所有代码行数的比例,成为测试覆盖率)的工具,使用如下。
到达有
_test
结尾的目录下:
//执行
go test -v -coverprofile=c.out

### 输出:###=== RUN   TestRandSlice###--- PASS: TestRandSlice (0.00s)###PASS###coverage: 75.0% of statements###ok      gitee.hill.com/mygo/addvance/testFunc   0.664s

go tool cover -html=c.out -o=tag.html
执行最后一句后,当前目录会多一个
html
文件
小结
- 单元测试方法必须导出。
- 单元测试文件名以
_test结尾。 - 单元测试函数名以
Test_开头。 go test会自动忽略以“_” 或者“.开头的文件。build,intsall也会自动忽略测试文件。
2. 基准测试
基准测试(
benchmarking
)是一种测试和评估软件性能的活动。如何判断一段程序的性能,唯有从两个方面去考量,一个是
执行性能
,一个是
空间性能
。
benchmarking
可以很好的帮助我们找到一段代码的性能水平,Let’s get it。
在Go中,基准测试方法一般以
BenchmarkXXX
开头,并且通过
go test
命令,加上
-bench
来执行。
这里还是测试前面那一段打乱slice的代码,编写基准测试方法。
funcBenchmarkRandSlice(b *testing.B){
    slice :=[]interface{}{1,2,3,4,5,6,7,8}for i :=0; i < b.N; i++{RandSlice(slice)}}
这里循环的
i<b.N
,表示会循环这么多次
//终端输入:
shell>go test -bench=.-run=none // go test 默认执行单元测试,防止单元测试结果妨碍基准测试, 这里用none代替//输出:/*goos: windows
goarch: amd64
pkg: gitee.hill.com/mygo/addvance/testFunc
cpu: Intel(R) Core(TM) i5-8400 CPU @ 2.80GHz
BenchmarkRandSlice-6       18186             65075 ns/op
PASS
ok      gitee.hill.com/mygo/addvance/testFunc   2.253s*/
函数后面的
-6
表示GOMAXPROCES, 1秒执行了18133次,每次循环时65271 ns。 这里默认测试时一秒,也可以用
-benchtime
指定时间如:
go test -benchtime=3s
注意的时:
- 如果在基准测试的时候,前面初始化代码会有阻塞,或者加载时长比较长的时候,可以在想要测试语句加上:
funcBenchmarkResetTimer(b *testing.B){...//初始化代码 ,会耗时 b.ResetTimer()...//真正想要测试的代码} - 要并行测试性能的时候,用
RunParallel函数
2.1 分析代码
- 性能分析分析
int转string方法的性能var num =10funcBenchmarkI2S1(b *testing.B){for i :=0; i < b.N; i++{ fmt.Sprintf("%d", num)}}funcBenchmarkI2S2(b *testing.B){for i :=0; i < b.N; i++{ strconv.Itoa(num)}}funcBenchmarkI2S3(b *testing.B){for i :=0; i < b.N; i++{ strconv.FormatInt(int64(num),10)}}输出:shell>go test -bench=.-run=nonegoos: windowsgoarch: amd64pkg: gitee.hill.com/mygo/addvance/testFunccpu:Intel(R)Core(TM) i5-8400 CPU @ 2.80GHzBenchmarkI2S1-61679416270.59 ns/opBenchmarkI2S2-64481555022.664 ns/opBenchmarkI2S3-64616586692.616 ns/opPASSok gitee.hill.com/mygo/addvance/testFunc 4.612s由结果可以看到strconv.FormaInt性能最高,其次是strconv.Itoa,最后是fmt.Sprintf(), 为了分析更深层次的原因,用benchmem来分析输出:BenchmarkI2S1-61693372570.90 ns/op 2 B/op 1 allocs/opBenchmarkI2S2-64590210822.668 ns/op 0 B/op 0 allocs/opBenchmarkI2S3-64370750352.739 ns/op 0 B/op 0 allocs/opobviously,多了allocs/op, B/op这两列数据,前者的意思是每次操作分配的B数,后者表示每次操作从堆上分配内存的次数。可以看到BenchmarkI2S1比其他每次操作多2B数据,每次操作分配内存次数比其他多1次。当然,在程序中,我们不能一味的只看性能,当然在可用性和复用性允许的情况下,性能需要做出一些让步。 - pprof
在上面的例子中,只能查看函数的执行时间,不能进一步的分析程序。要用到
go test
的一些其他的参数,例如:
-bench regexp:regexp 可以是任何正则表达式,表示需要运行的函数-benchmem:输出内容包含内存分配统计信息-benchtime:指定单个测试累积耗时上线,默认1s-cpuprofile out:输出cpu profile到指定文件,pprof查看-memprofile out:输出内存profile到指定文件,pprof查看
基准测试输出cpu信息到文件:
go test -bench=. -run=none -benchmem -cpuprofile cpu.prof
输出的文件,不能直接从查看,需要用
pprof
来查看:
go tool pprof test_test.go cpu.prof
之后会进入一个交互模式:
test_test.go: parsing profile: unrecognized profile format
Fetched 1source profiles out of 2
Type: cpu
Time: Aug 9, 2021 at 8:22pm (CST)
Duration: 4.42s, Total samples =4.30s (97.23%)
Entering interactive mode (type "help"for commands, "o"for options)(pprof)
输入Top100看看CPU情况:
(pprof) top100
Showing nodes accounting for4.17s,96.98% of 4.30s total
Dropped 28 nodes (cum <=0.02s)
      flat  flat%   sum%        cum   cum%1.39s 32.33%32.33%2.33s 54.19%  strconv.FormatInt
     0.93s 21.63%53.95%0.93s 21.63%  strconv.small
     0.31s  7.21%61.16%1.45s 33.72%  gitee.hill.com/mygo/addvance/testFunc.BenchmarkI2S3
     0.20s  4.65%65.81%1.50s 34.88%  gitee.hill.com/mygo/addvance/testFunc.BenchmarkI2S2
     0.13s  3.02%68.84%0.20s  4.65%  runtime.mallocgc
     0.12s  2.79%71.63%0.51s 11.86%  fmt.(*pp).doPrintf
     0.12s  2.79%74.42%0.39s  9.07%  fmt.(*pp).printArg
     0.11s  2.56%76.98%0.20s  4.65%  fmt.(*fmt).fmtInteger
     0.11s  2.56%79.53%1.30s 30.23%  strconv.Itoa (inline)0.10s  2.33%81.86%0.10s  2.33%  runtime.memmove
     0.08s  1.86%83.72%0.22s  5.12%  fmt.(*pp).free
     0.08s  1.86%85.58%0.13s  3.02%  sync.(*Pool).Get
     0.08s  1.86%87.44%0.14s  3.26%  sync.(*Pool).Put
     0.07s  1.63%89.07%0.27s  6.28%  fmt.(*pp).fmtInteger
     0.06s  1.40%90.47%0.22s  5.12%  fmt.newPrinter
     0.05s  1.16%91.63%1.26s 29.30%  fmt.Sprintf
     0.05s  1.16%92.79%0.05s  1.16%  runtime.procPin
     0.03s   0.7%93.49%0.03s   0.7%  runtime.acquirem (inline)0.03s   0.7%94.19%0.03s   0.7%  runtime.nextFreeFast (inline)0.03s   0.7%94.88%0.26s  6.05%  runtime.slicebytetostring
     0.02s  0.47%95.35%0.03s   0.7%  fmt.(*fmt).init (inline)0.02s  0.47%95.81%0.09s  2.09%  fmt.(*fmt).pad
     0.02s  0.47%96.28%0.07s  1.63%  sync.runtime_procPin
     0.01s  0.23%96.51%1.29s 30.00%  gitee.hill.com/mygo/addvance/testFunc.BenchmarkI2S1
     0.01s  0.23%96.74%0.03s   0.7%  runtime.bgscavenge.func2
     0.01s  0.23%96.98%0.09s  2.09%  sync.(*Pool).pin
         00%96.98%0.07s  1.63%  fmt.(*buffer).write (inline)00%96.98%0.05s  1.16%  runtime.systemstack
         00%96.98%4.24s 98.60%  testing.(*B).launch
         00%96.98%4.24s 98.60%  testing.(*B).runN
pprof 实际上有两种应用方式,另一种就是
gofunc(){
        log.Debug(http.ListenAndServe(":6060",nil))}()
go tool pprof http://localhost:6060/debug/pprof/profile?seconds=60
然后就可以通过网页去访问啦~
pprof阅读还有另外一种方式: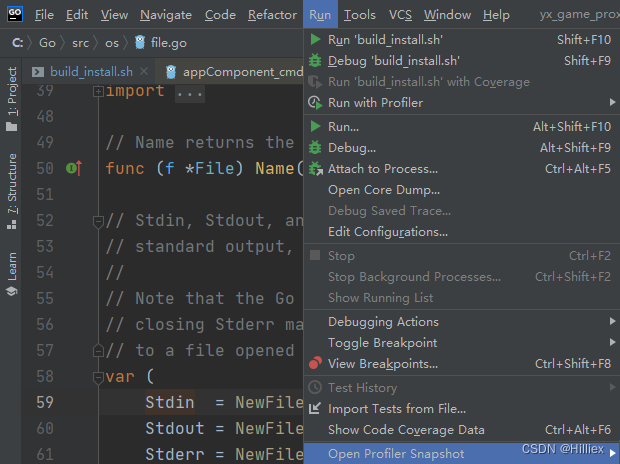
就是在Goland自带的工具去分析profile文件,可以生成火焰图、调用树、方法列表
FAQ:
1、在测试Web服务的时候,也会有
net/http
包,所以在进行压测的时候,不知道哪个端口才是用来做压测的,这个时候就要具体导入
net/http/pprof
包(3小时的教训)
版权归原作者 Hilliex 所有, 如有侵权,请联系我们删除。