
大家好,我是潘潘
今天为大家带来的是我已经写了很久了的canvas详细教程,对入门canvas很有帮助。
点击跳转原文:
canvas详细教程原文
canvas是什么?
简单来说,
<canvas>
是HTML5中的标签,它是一个容器,可以使用JS在其中绘制图形或文字。
MDN:
<canvas>
是一个可以使用脚本 (通常为JavaScript) 来绘制图形的 HTML 元素。例如,它可以用于绘制图表、制作图片构图或者制作简单的动画。主要聚焦于2D图形。
预备知识
canvas标签本身
canvas标签是一张画布,如果你写了一个canvas标签,打开live server,在支持canvas的浏览器上显示是这样的:
你可能会问怎么啥都没有呢?因为canvas标签只是一个默认长300像素,宽150像素的白色画布,你可以给它加上页面居中和
box-shadow
的css样式:
如果你觉得这个画布太小了,施展不开,那么你可以通过标签属性来自定义宽高:
<canvasheight="600"width="700"></canvas>
设置后:
这里注意,设置画布的宽高只能在html标签里通过height和width属性来设置(canvas标签有且只有这两个属性),如果你在css中设置:
canvas{height: 600px;width: 700px;}
上边的这种方式只是将画布拉伸变形了,就好像拿放大镜看一样,会导致失真,其实它本质上的大小并没有变化,比如:

所以canvas的宽高还是要在html中使用标签属性设置。
支持的浏览器
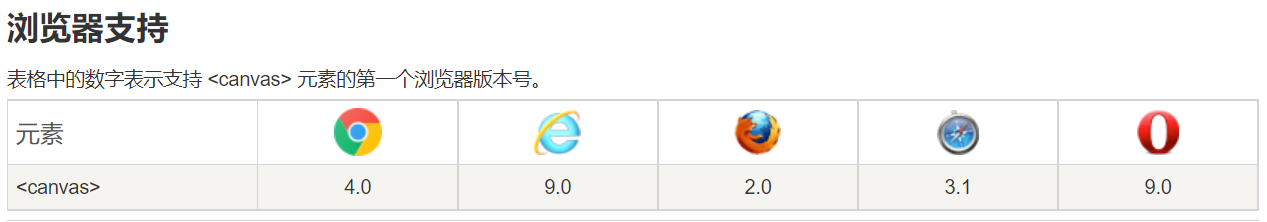
那么如果你的浏览器不支持canvas呢?那么你canvas标签中的文字就派上用场了,浏览器上会显示出你canvas标签里的文字,比如:
<canvas>你的浏览器不支持canvas,快去升级浏览器吧!</canvas>

(为了演示方便,以下教程全部默认浏览器支持canvas,且给画布加上了居中和阴影效果。)
详细教程
基本步骤
我们以现实生活中画水墨画为例:如果我们要画一幅画,要有以下的准备步骤:
①首先要有一用来画画的纸;
②找到这张纸;
③决定是画二维还是三维的画
类比于canvas,也是这样的几个步骤:
①首先要有一用来画画的纸:
<!-- 创建canvas标签: --><canvasid="canvas"height="600"width="700"></canvas>
②找到这张纸:
// 我们现在要使用JS获得这个canvas标签的DOM对象:
<script>
    const canvas = document.getElementById('canvas')
</script>
③决定是画二维还是三维的画:
// 通过getContext()方法来获得渲染上下文和它的绘画功能:<script>const ctx = canvas.getContext('2d')// 这里我们先聚焦于2D图形</script>
坐标系
Canvas
使用的是 W3C 坐标系 ,也就是遵循我们屏幕、报纸的阅读习惯,从上往下,从左往右。

已经做好了准备工作,接下来就可以开始画画了!
一、绘制基础图形
1. 画线段
画线之前你需要知道canvas上下文的以下几个api:
moveTo(x,y)
:定义画线的起始点;
lineTo(x,y)
:定义画线的折点;
stroke()
:通过线条来绘制图形轮廓
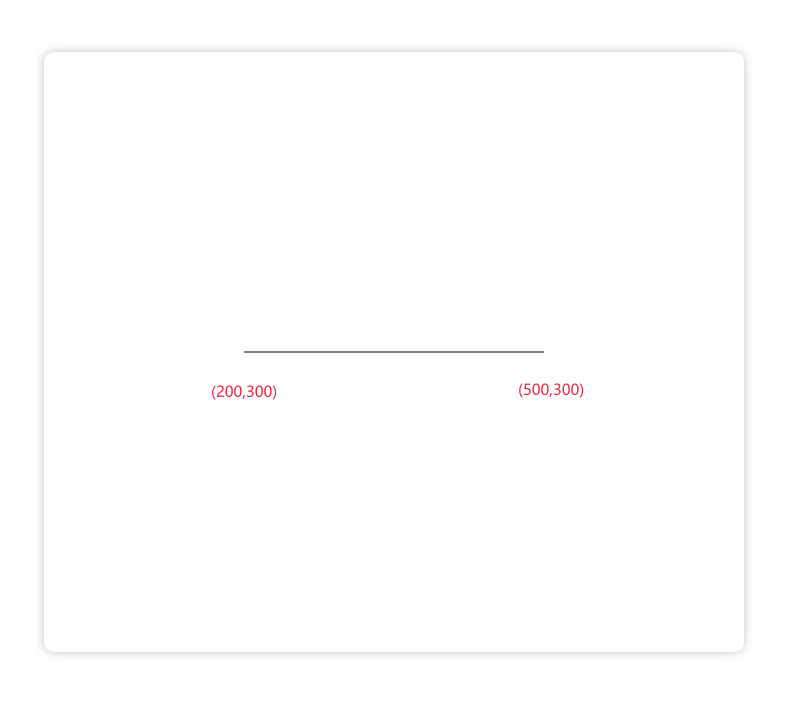
完整代码:
<canvasid="canvas"height="600"width="700"></canvas><script>const canvas = document.getElementById('canvas')const ctx = canvas.getContext('2d')
    ctx.moveTo(200,300)// 起点为(200,300)
    ctx.lineTo(500,300)
    ctx.stroke()</script>
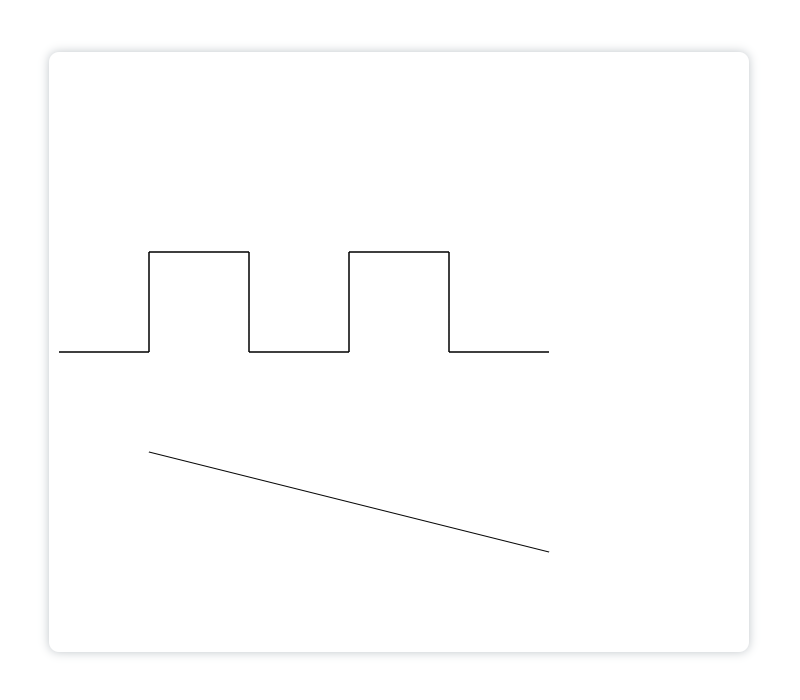
当然,你也可以同时画多条折线:
<canvasid="canvas"height="600"width="700"></canvas><script>const canvas = document.getElementById('canvas')const ctx = canvas.getContext('2d')
    ctx.moveTo(10,300)
    ctx.lineTo(100,300)
    ctx.lineTo(100,200)
    ctx.lineTo(200,200)
    ctx.lineTo(200,300)
    ctx.lineTo(300,300)
    ctx.lineTo(300,200)
    ctx.lineTo(400,200)
    ctx.lineTo(400,300)
    ctx.lineTo(500,300)
    ctx.stroke()// 绘制第二条:
    ctx.moveTo(100,400)
    ctx.lineTo(500,500)
    ctx.stroke()</script>
给线段设置样式
strokeStyle = '颜色'
:设置线的颜色;
lineWidth = 数字
:设置线的宽度;
lineCap = 'round/butt/square'
:设置线帽为圆型/默认/方形;
lineJoin = 'miter/round/bevel'
:设置线段连接处为默认/圆形/平直形式;
globalAlpha = 数字
:设置图案的透明度
一个简单的示例,设置一条线的线宽:
<canvasid="canvas"height="600"width="700"></canvas><script>
    canvas = document.getElementById("canvas");
    ctx = canvas.getContext("2d")
    ctx.moveTo(200,300)
    ctx.lineTo(500,300)
    ctx.lineWidth =10// 设置线宽为10像素
    ctx.stroke()</script>
显示:

这里有一个地方需要注意,就是样式的设置必须写在绘制图形轮廓(
stroke()
)方法之前!否则会不生效!(因为
stroke()
方法是进行绘制,如果已经绘制了再设置线段的样式,自然会不生效)
同时画多条线并分别设置样式
如果现在你画了两条宽20 像素圆角的线,并且想一条设置为红色,一条设置为天蓝色,那么你可能会这样写:
<canvasid="canvas"height="600"width="700"></canvas><script>const canvas = document.getElementById('canvas')const ctx = canvas.getContext('2d')
    ctx.moveTo(200,200)
    ctx.lineTo(500,200)
    ctx.strokeStyle ='skyblue'// 设置为天蓝色
    ctx.lineWidth =20
    ctx.lineCap ='round'
    ctx.stroke()// 绘制第二条线:
    ctx.moveTo(200,300)
    ctx.lineTo(500,300)
    ctx.strokeStyle ='red'
    ctx.lineWidth =20
    ctx.lineCap ='round'
    ctx.stroke()</script>
但是显示的会是这样:
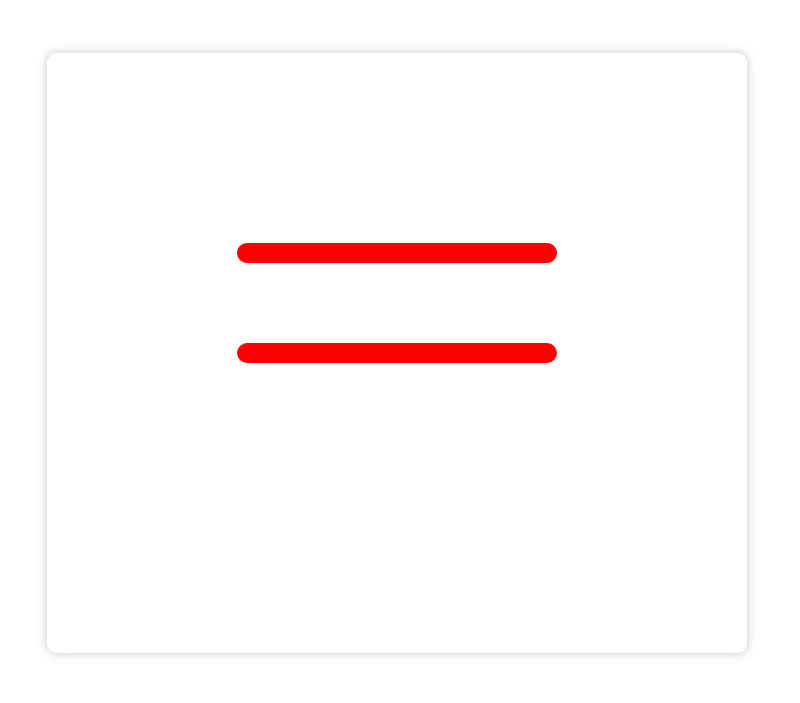
两条线都显示的是红色,这是因为第二条线的颜色“覆盖”了第一条线的颜色。如果我们想分别设置每条线的样式,就需要用到下面两个方法:
beginPath()
:开启一条新路径,生成之后,图形绘制命令会被指向到新路径上;
closePath()
:关闭上一条路径的绘制
在每条路径开始和结束的时候加上这两个方法即可分别设置两条线的样式:
<canvasid="canvas"height="600"width="700"></canvas><script>const canvas = document.getElementById('canvas')const ctx = canvas.getContext('2d')
    ctx.beginPath()
    ctx.moveTo(200,200)
    ctx.lineTo(500,200)
    ctx.strokeStyle ='skyblue'// 设置为天蓝色
    ctx.lineWidth =20
    ctx.lineCap ='round'
    ctx.stroke()
    ctx.closePath()// 绘制第二条线:
    ctx.beginPath()
    ctx.moveTo(200,300)
    ctx.lineTo(500,300)
    ctx.strokeStyle ='red'
    ctx.lineWidth =20
    ctx.lineCap ='round'
    ctx.stroke()
    ctx.closePath()</script>
显示:

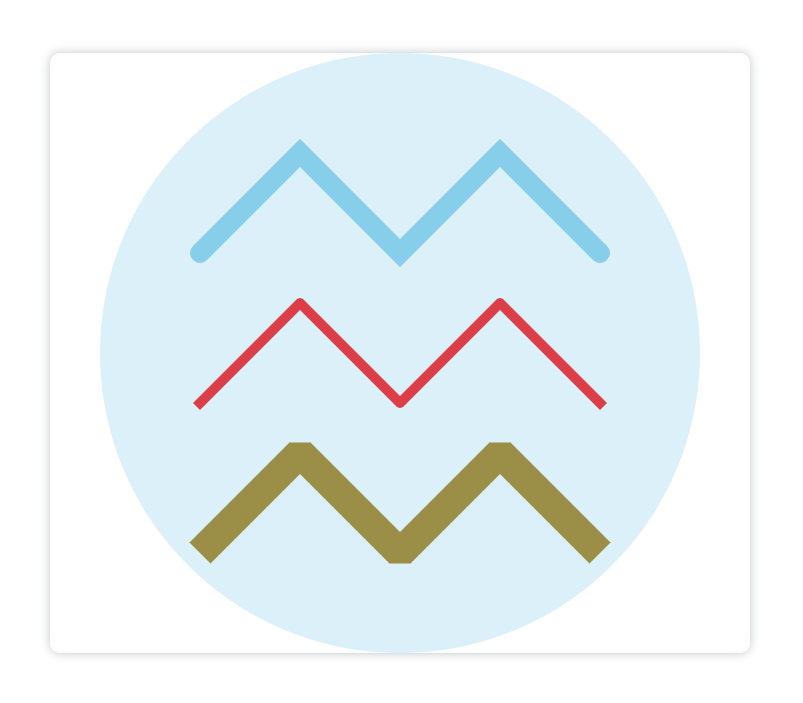
综合示例:
<canvasid="canvas"height="600"width="700"></canvas><script>
    canvas = document.getElementById("canvas");
    ctx = canvas.getContext("2d")
    ctx.beginPath()
    ctx.moveTo(150,200)
    ctx.lineTo(250,100)
    ctx.lineTo(350,200)
    ctx.lineTo(450,100)
    ctx.lineTo(550,200)
    ctx.lineWidth =20
    ctx.strokeStyle ='skyblue'// 设置颜色为天蓝色
    ctx.lineCap ='round'// 设置线帽为圆形
    ctx.lineJoin ='miter'// 设置线段连接处为默认形式
    ctx.stroke()
    ctx.beginPath()
    ctx.moveTo(150,350)
    ctx.lineTo(250,250)
    ctx.lineTo(350,350)
    ctx.lineTo(450,250)
    ctx.lineTo(550,350)
    ctx.lineWidth =10
    ctx.strokeStyle ='red'// 设置线段颜色为红色
    ctx.lineCap ='square'// 设置线帽为方形
    ctx.lineJoin ='round'// 设置线段连接处为圆形
    ctx.stroke()
    ctx.beginPath()
    ctx.moveTo(150,500)
    ctx.lineTo(250,400)
    ctx.lineTo(350,500)
    ctx.lineTo(450,400)
    ctx.lineTo(550,500)
    ctx.lineWidth =30
    ctx.strokeStyle ='#a37400'// 设置线段颜色
    ctx.lineCap ='butt'// 设置线帽为默认形式
    ctx.lineJoin ='bevel'// 设置线段连接处为平直的形式
    ctx.stroke()
    ctx.beginPath()
    ctx.arc(350,300,300,0,[(Math.PI)/180]*360)
    ctx.globalAlpha =0.3// 设置圆的透明度为0.3
    ctx.fillStyle ='skyblue'
    ctx.fill()</script>
显示:
p.s.:其实在画第二条线的时候只需要开启(
beginPath()
)新路径即可,两条线仍然可以分别设置样式,但是为了规范起见,还是建议写上
closePath()
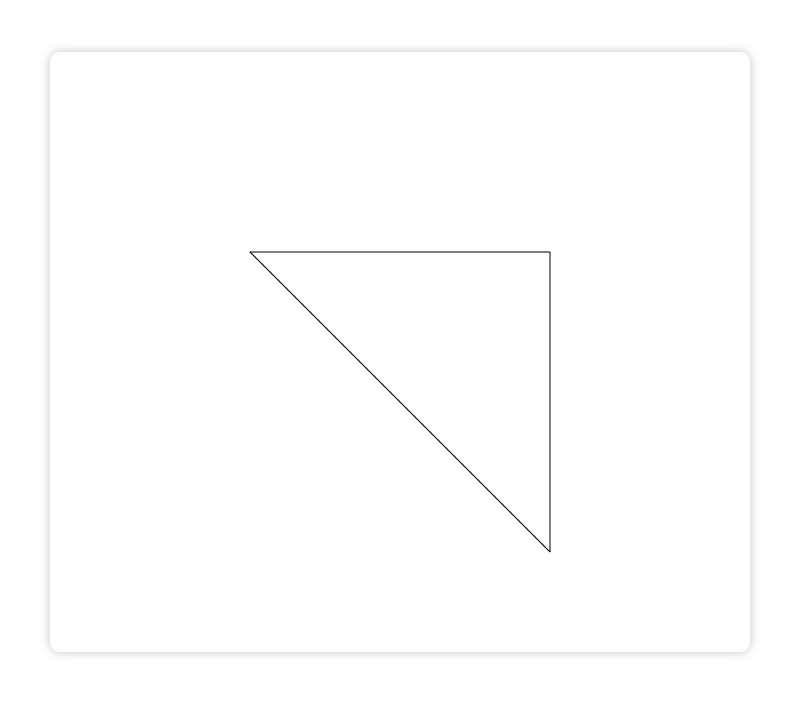
2. 画三角形
画三角形其实也是用画线的思路,只需要注意首尾点连接起来即可:
<canvasid="canvas"height="600"width="700"></canvas><script>const canvas = document.getElementById('canvas')const ctx = canvas.getContext('2d')
    ctx.beginPath()
    ctx.moveTo(200,200)
    ctx.lineTo(500,200)
    ctx.lineTo(500,500)
    ctx.lineTo(200,200)// 第四个点要和第一个点的坐标一致才能画出三角形
    ctx.stroke()
    ctx.closePath()</script>
显示:
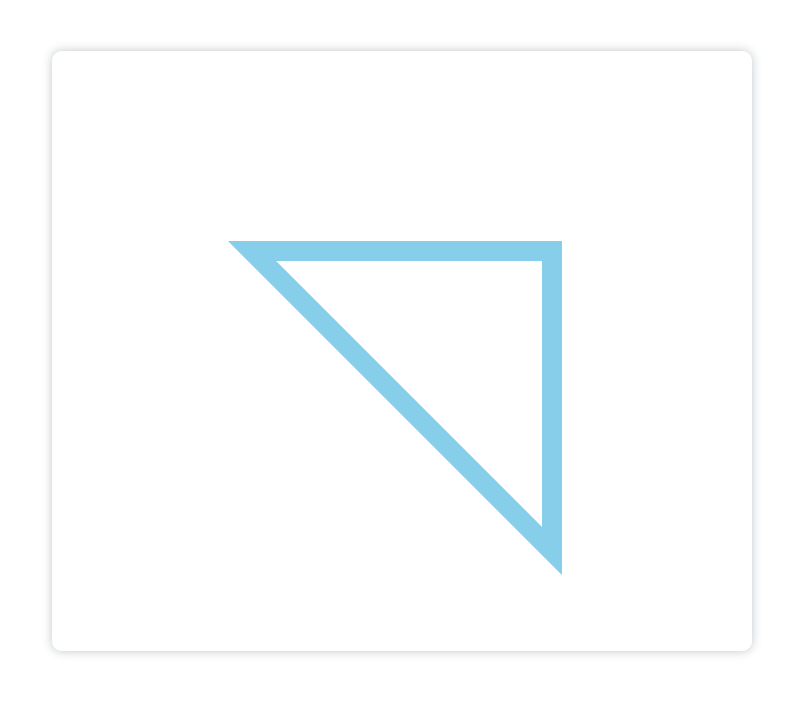
如果要设置样式也和画线是一样的:
<canvasid="canvas"height="600"width="700"></canvas><script>const canvas = document.getElementById('canvas')const ctx = canvas.getContext('2d')
    ctx.beginPath()
    ctx.moveTo(200,200)
    ctx.lineTo(500,200)
    ctx.lineTo(500,500)
    ctx.lineTo(200,200)
    ctx.strokeStyle ='skyblue'
    ctx.lineWidth =20
    ctx.stroke()
    ctx.closePath()</script>
显示:

可能有人会想把三角形左上角的闭合处显示的更衔接一点,那么我们可以使用
closePath()
方法,它会把线段的终点和起点连接起来,这样看上去就更更衔接了:
<canvasid="canvas"height="600"width="700"></canvas><script>const canvas = document.getElementById('canvas')const ctx = canvas.getContext('2d')
    ctx.beginPath()
    ctx.moveTo(200,200)
    ctx.lineTo(500,200)
    ctx.lineTo(500,500)
    ctx.closePath()
    ctx.strokeStyle ='skyblue'
    ctx.lineWidth =20
    ctx.stroke()</script>
显示:
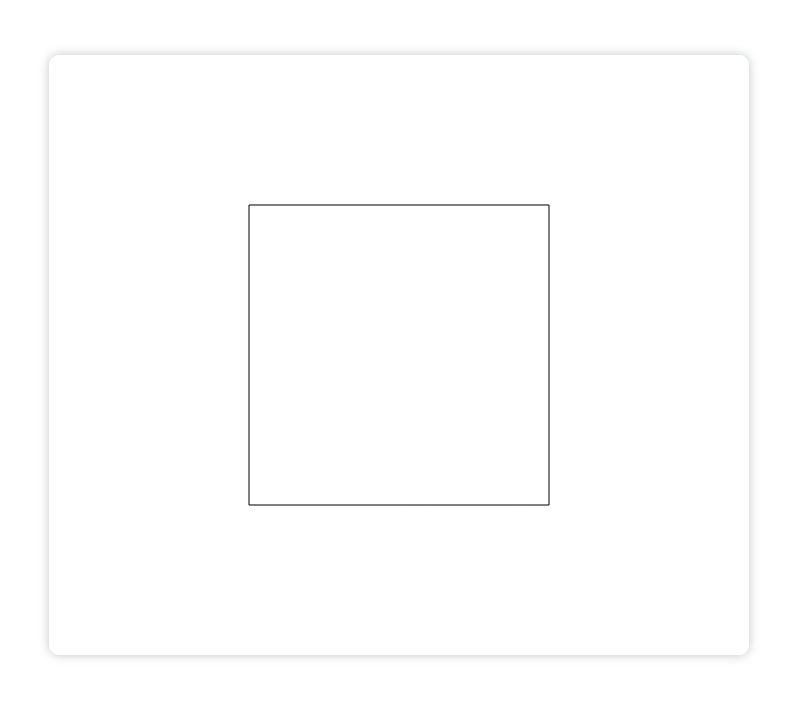
3. 画矩形
(1)空心矩形
绘制矩形有三种方法,第一种和画三角形的思路一样,比如:
<canvasid="canvas"height="600"width="700"></canvas><script>const canvas = document.getElementById('canvas')const ctx = canvas.getContext('2d')
    ctx.beginPath()
    ctx.moveTo(200,150)
    ctx.lineTo(500,150)
    ctx.lineTo(500,450)
    ctx.lineTo(200,450)
    ctx.lineTo(200,150)
    ctx.stroke()
    ctx.closePath()</script>
显示:
第二种方法是直接使用
ctx
身上的
strokeRect()
方法:
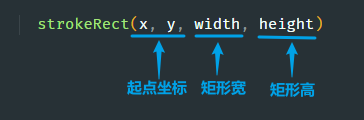
例如:
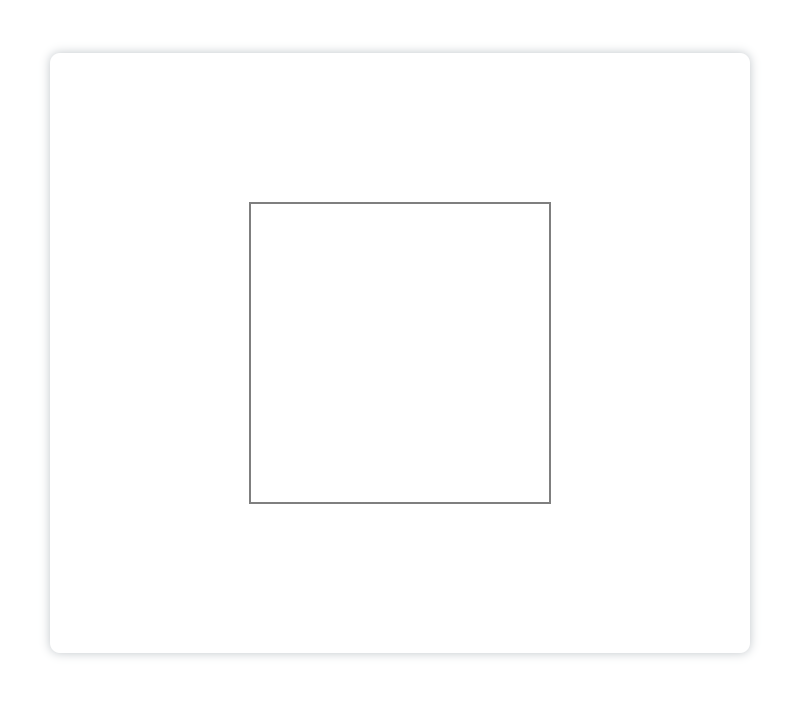
<canvasid="canvas"height="600"width="700"></canvas><script>const canvas = document.getElementById('canvas')const ctx = canvas.getContext('2d')
    ctx.beginPath()
    ctx.strokeRect(200,150,300,300)// 起点为(200,150),宽300像素,高300像素
    ctx.closePath()</script>
显示:
第三种方法和第二种类似,只是把
strokeRect()
方法拆成了
stroke()
和
rect()
方法,好处就是使用
rect()
暂时生成了矩形,但是必须调用
stroke()
方法才会绘制出来,比如可以使用下面的方式延迟两秒钟再绘制矩形:
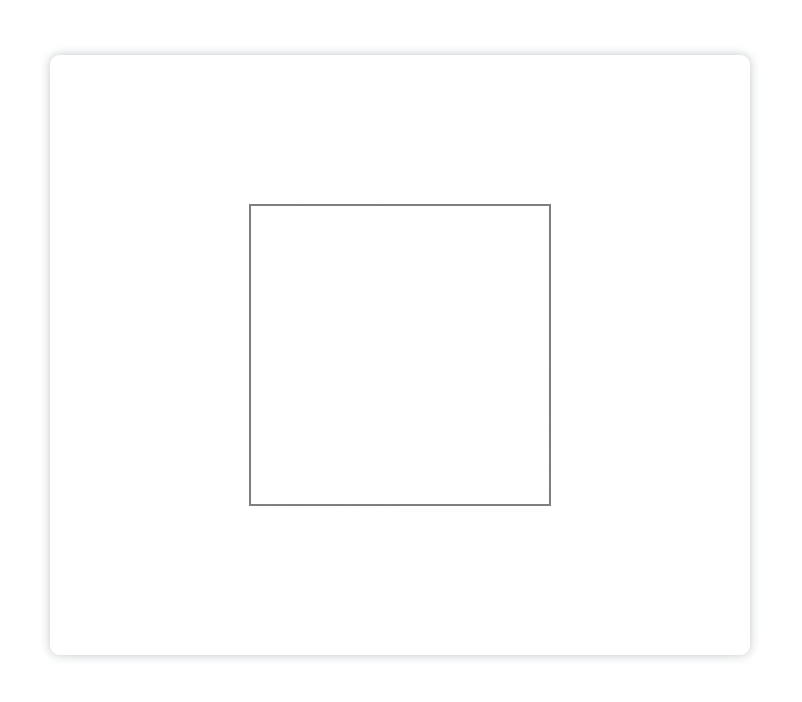
<canvasid="canvas"height="600"width="700"></canvas><script>const canvas = document.getElementById('canvas')const ctx = canvas.getContext('2d')
    ctx.rect(200,150,300,300)setTimeout(()=>{
        ctx.stroke()},2000)</script>
两秒钟后会显示矩形:
(2)填充矩形
绘制填充矩形有两种方式。
第一种方式:只需要将
strokeRect()
方法和
strokeStyle()
方法的"stroke"改成"fill"即可。
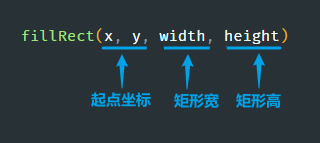
fillStyle = '颜色'
:选择填充色
<canvasid="canvas"height="600"width="700"></canvas><script>const canvas = document.getElementById('canvas')const ctx = canvas.getContext('2d')
    ctx.beginPath()
    ctx.fillStyle ='skyblue'// 填充颜色一定要写在生成矩形(fillRect())之前,否则颜色不生效
    ctx.fillRect(200,150,300,300)
    ctx.closePath()</script>
显示:

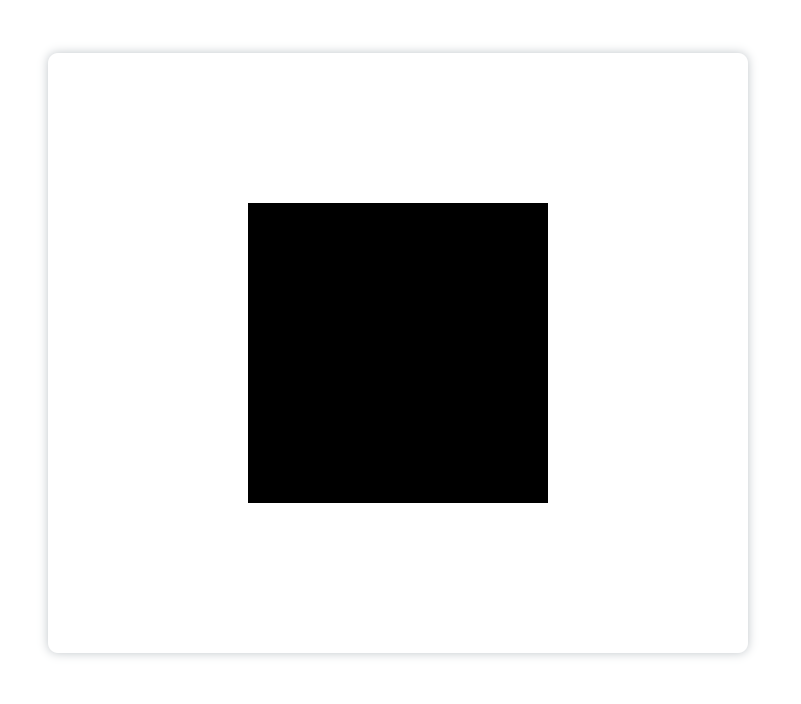
第二种方式:
这种方式和绘制空心矩形的第三种方法很像,只需要用
fill()
方法替代
stroke()
方法即可:
<canvasid="canvas"height="600"width="700"></canvas><script>const canvas = document.getElementById('canvas')const ctx = canvas.getContext('2d')
    ctx.rect(200,150,300,300)// 先用rect()方法生成矩形setTimeout(()=>{
        ctx.fill()// 再用fill()方法绘制填充矩形},2000)</script>
两秒钟后绘制填充矩形:
这里使用的
fill()
方法和
stroke()
方法都是用来绘制出来形状,只不过前者是填充绘制,后者是用线轮廓。后边我们也会经常使用发到
fill()
方法。
4. 画⌒/⚪
绘制圆弧通常有两种方式。
第一种方法:
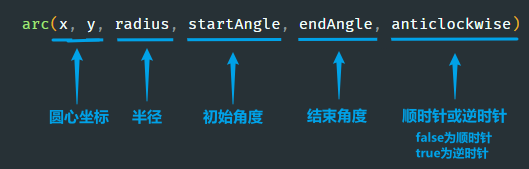
使用
arc(x, y, radius, startAngle, endAngle, anticlockwise)
方法生成⚪/⌒,再使用
stroke()
方法绘制圆。

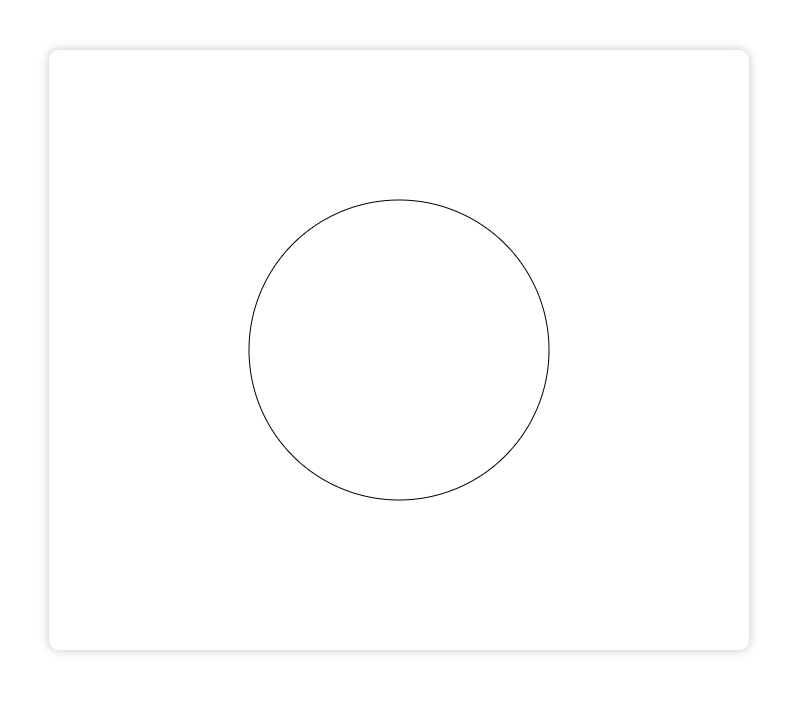
例如:
<canvasid="canvas"height="600"width="700"></canvas><script>const canvas = document.getElementById('canvas')const ctx = canvas.getContext('2d')
    ctx.beginPath()
    ctx.arc(350,300,150,0,[(Math.PI)/180]*360)// 不写anticlockwise项的话默认为顺时针
    ctx.stroke()// 如果此处改为使用fill()方法,那么将会绘制出填充的圆</script>
显示:
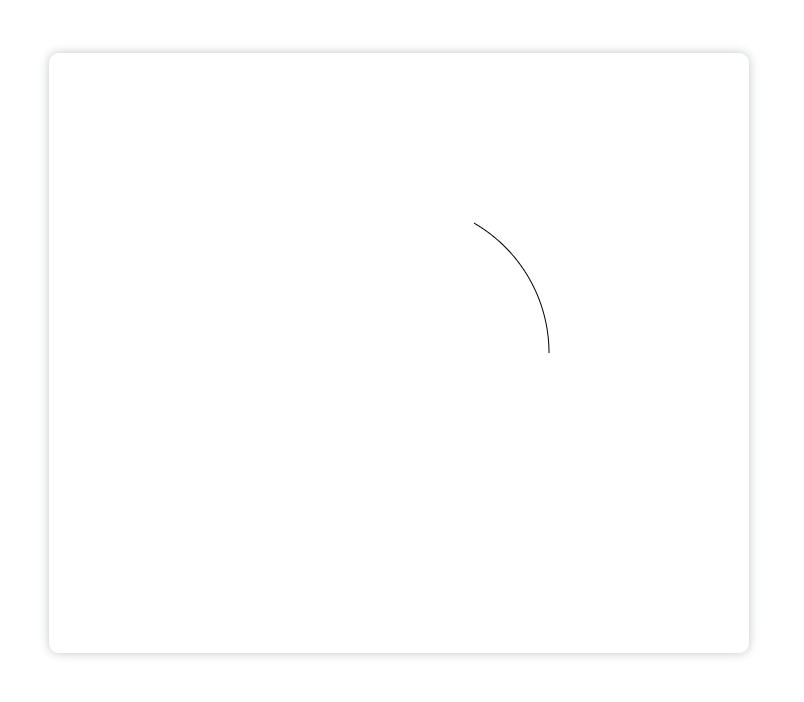
逆时针绘制一段圆弧:
<canvasid="canvas"height="600"width="700"></canvas><script>const canvas = document.getElementById('canvas')const ctx = canvas.getContext('2d')
    ctx.beginPath()
    ctx.arc(350,300,150,0,[(Math.PI)/180]*300,true)// (Math.PI) / 180 = 1°
    ctx.stroke()</script>
显示:
圆弧也可以和点连接起来,比如:
<canvasid="canvas"height="600"width="700"></canvas><script>const canvas = document.getElementById('canvas')const ctx = canvas.getContext('2d')
    ctx.beginPath()
    ctx.arc(350,300,150,[(Math.PI)/180]*30,[(Math.PI)/180]*330)
    ctx.lineTo(350,300)
    ctx.closePath()// 用于连接首尾点
    ctx.stroke()</script>
显示:

进而,我们可以用这段代码画出一个“贪吃豆”:
<canvasid="canvas"height="600"width="700"></canvas><script>const canvas = document.getElementById('canvas')const ctx = canvas.getContext('2d')
    ctx.beginPath()
    ctx.arc(350,300,150,[(Math.PI)/180]*30,[(Math.PI)/180]*330)
    ctx.lineTo(350,300)
    ctx.closePath()
    ctx.fillStyle ='#ffd11f'
    ctx.fill()
    ctx.beginPath()
    ctx.arc(380,220,20,0,[(Math.PI)/180]*360)
    ctx.closePath()
    ctx.fillStyle ='#000'
    ctx.fill()
    ctx.beginPath()
    ctx.arc(450,300,20,0,[(Math.PI)/180]*360)
    ctx.fillStyle ='#cfa500'
    ctx.closePath()
    ctx.fill()
    ctx.beginPath()
    ctx.arc(520,300,20,0,[(Math.PI)/180]*360)
    ctx.closePath()
    ctx.fill()
    ctx.beginPath()
    ctx.arc(590,300,20,0,[(Math.PI)/180]*360)
    ctx.closePath()
    ctx.fill()</script>
显示:

在上面的例子中我们使用到了
beginPath()
和
closePath()
方法来绘制多个形状。
绘制圆弧的第二种方法:
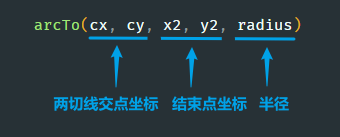
还可以用
arcTo()
方法来绘制圆弧,它接收四个参数(如下图),在它前边会有一个开始点坐标,一般由
moveTo()
或
lineTo()
方法提供。
这个方法有点难以理解,解释一下:
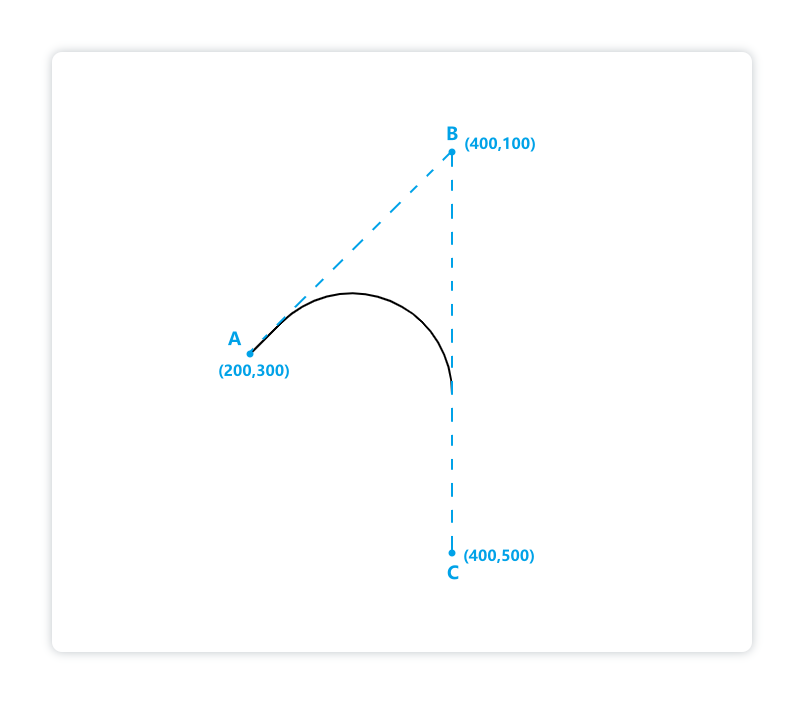
arcTo()
方法就是利用“开始点”、“控制点”和“结束点”这三个点所形成的夹角,然后绘制一段与夹角的两边相切并且半径为radius的圆弧。其中,弧线的起点是“开始点所在边与圆的切点”,而弧线的终点是“结束点所在边与圆的切点”。
arcTo()
方法绘制的弧线是两个切点之间长度最短的那个圆弧。此外,如果开始点不是弧线起点,arcTo()方法还将添加一条当前端点到弧线起点的直线线段。也就是说,开始点坐标不一定是弧线起点坐标
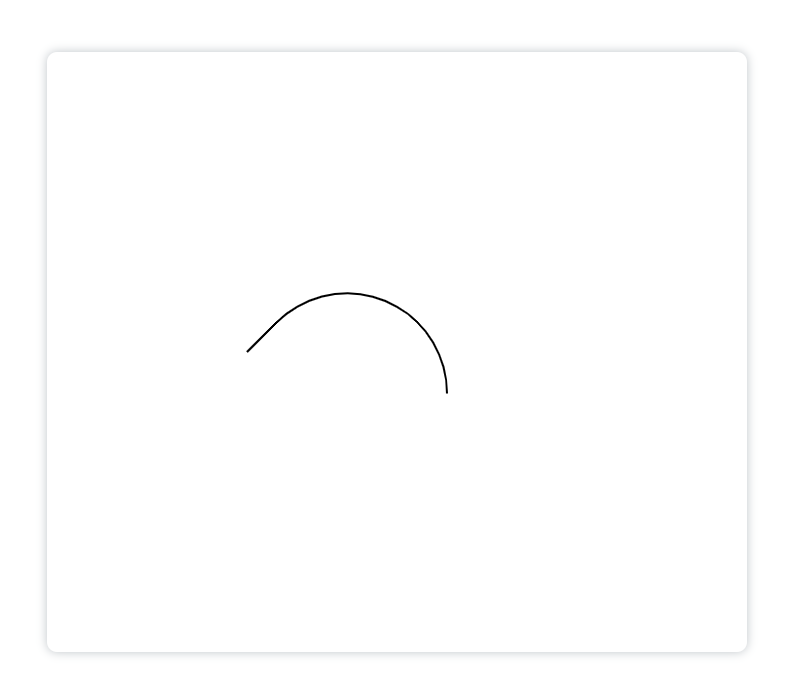
例如我们绘制一个这样的弧线:
<canvasid="canvas"height="600"width="700"></canvas><script>const cnv = document.getElementById('canvas')const ctx = cnv.getContext('2d')
    ctx.moveTo(200,300)// 定义线段的起点
    ctx.arcTo(400,100,400,500,100)// 切线交点坐标为(400,100),结束点为(400,500)
    ctx.lineWidth =2
    ctx.stroke()</script>
显示:
解释:点A是给出的开始点,弧线是∠ABC与半径为100像素的圆相切的部分,如图:
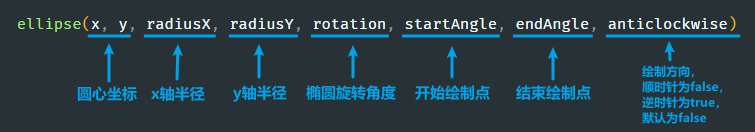
5. 画椭圆
使用
ellipse()
方法来绘制椭圆
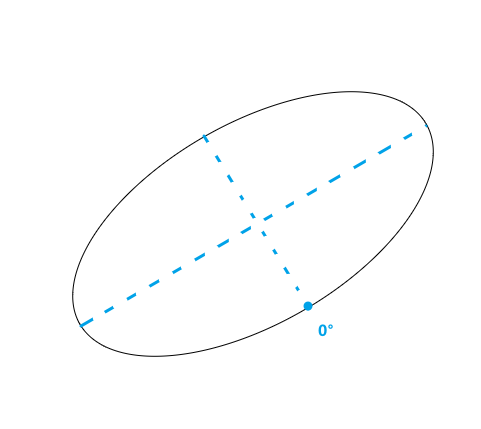
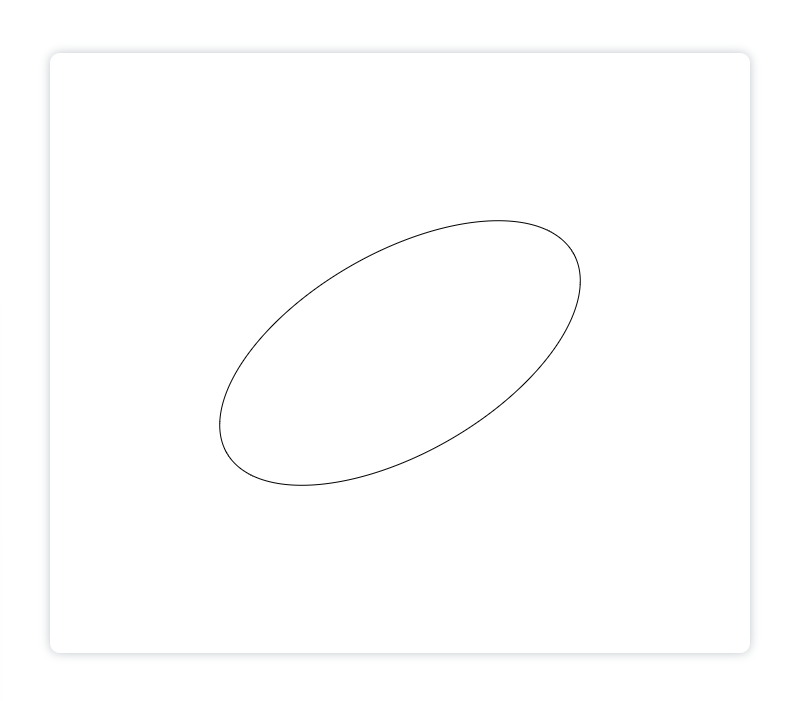
例如:
<canvasid="canvas"height="600"width="700"></canvas><script>const cnv = document.getElementById('canvas')const ctx = cnv.getContext('2d')
    ctx.ellipse(350,300,100,200,[(Math.PI)/180]*60,[(Math.PI)/180]*0,[(Math.PI)/180]*360,false)
    ctx.stroke()</script>
显示:
添加填充并设置颜色:
<canvasid="canvas"height="600"width="700"></canvas><script>const cnv = document.getElementById('canvas')const ctx = cnv.getContext('2d')
    ctx.ellipse(350,300,100,200,[(Math.PI)/180]*60,[(Math.PI)/180]*0,[(Math.PI)/180]*360,false)
    ctx.fillStyle ='skyblue'
    ctx.fill()</script>
显示:

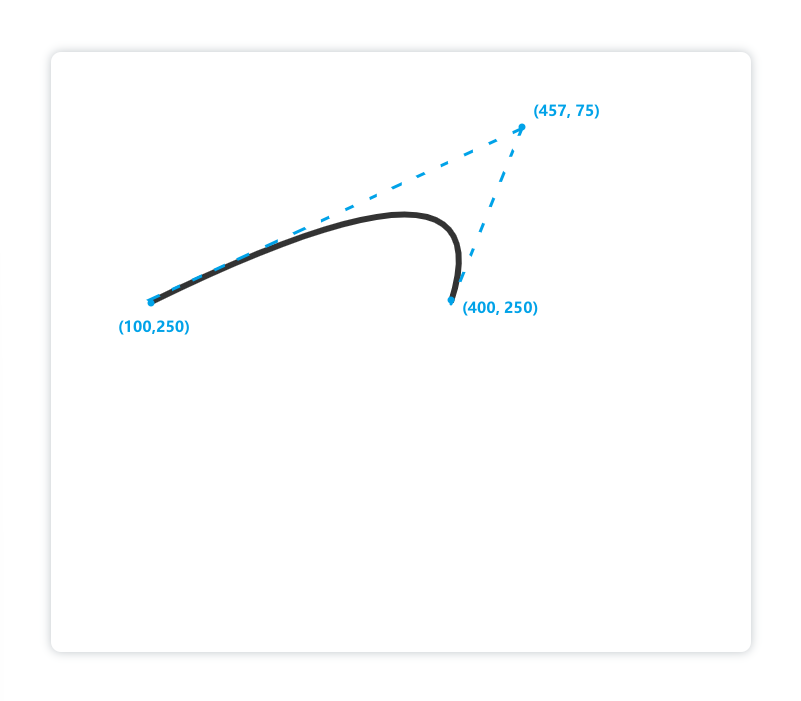
6. 画贝塞尔曲线
二次贝塞尔曲线:
使用
quadraticCurveTo()
方法来绘制二次贝塞尔曲线:
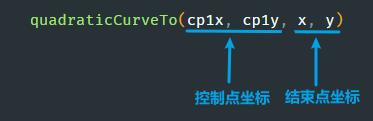
同
arcTo()
方法一样,在它前边也会有一个开始点坐标,一般由
moveTo()
或
lineTo()
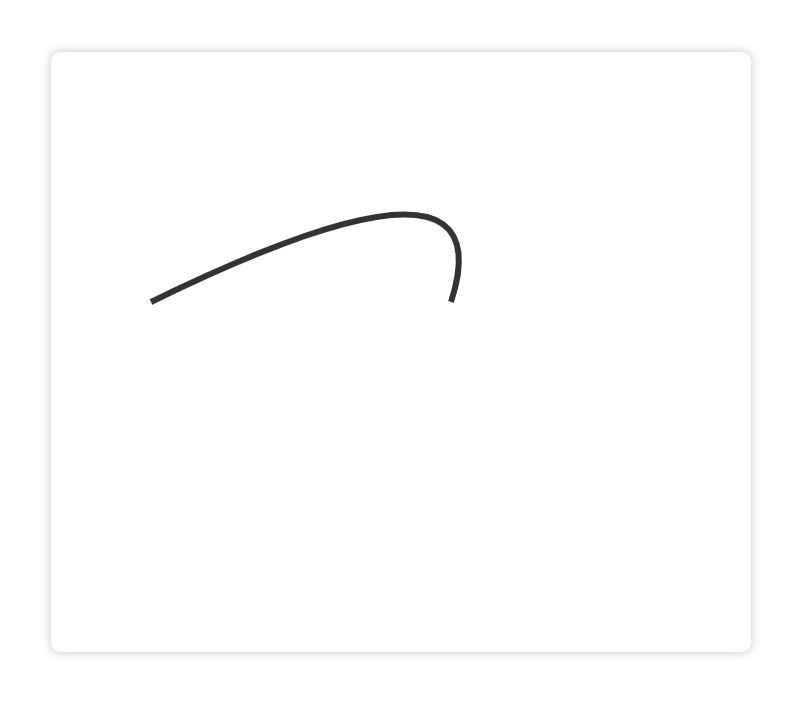
方法提供,例如:
<canvasid="canvas"height="600"width="700"></canvas><script>
    canvas = document.getElementById("canvas");
    ctx = canvas.getContext("2d")
    ctx.lineWidth =6;
    ctx.strokeStyle ="#333";
    ctx.beginPath();
    ctx.moveTo(100,250);
    ctx.quadraticCurveTo(457,75,400,250);
    ctx.stroke();</script>
显示:
解释:二次贝塞尔曲线由起点、控制点和重点来控制:
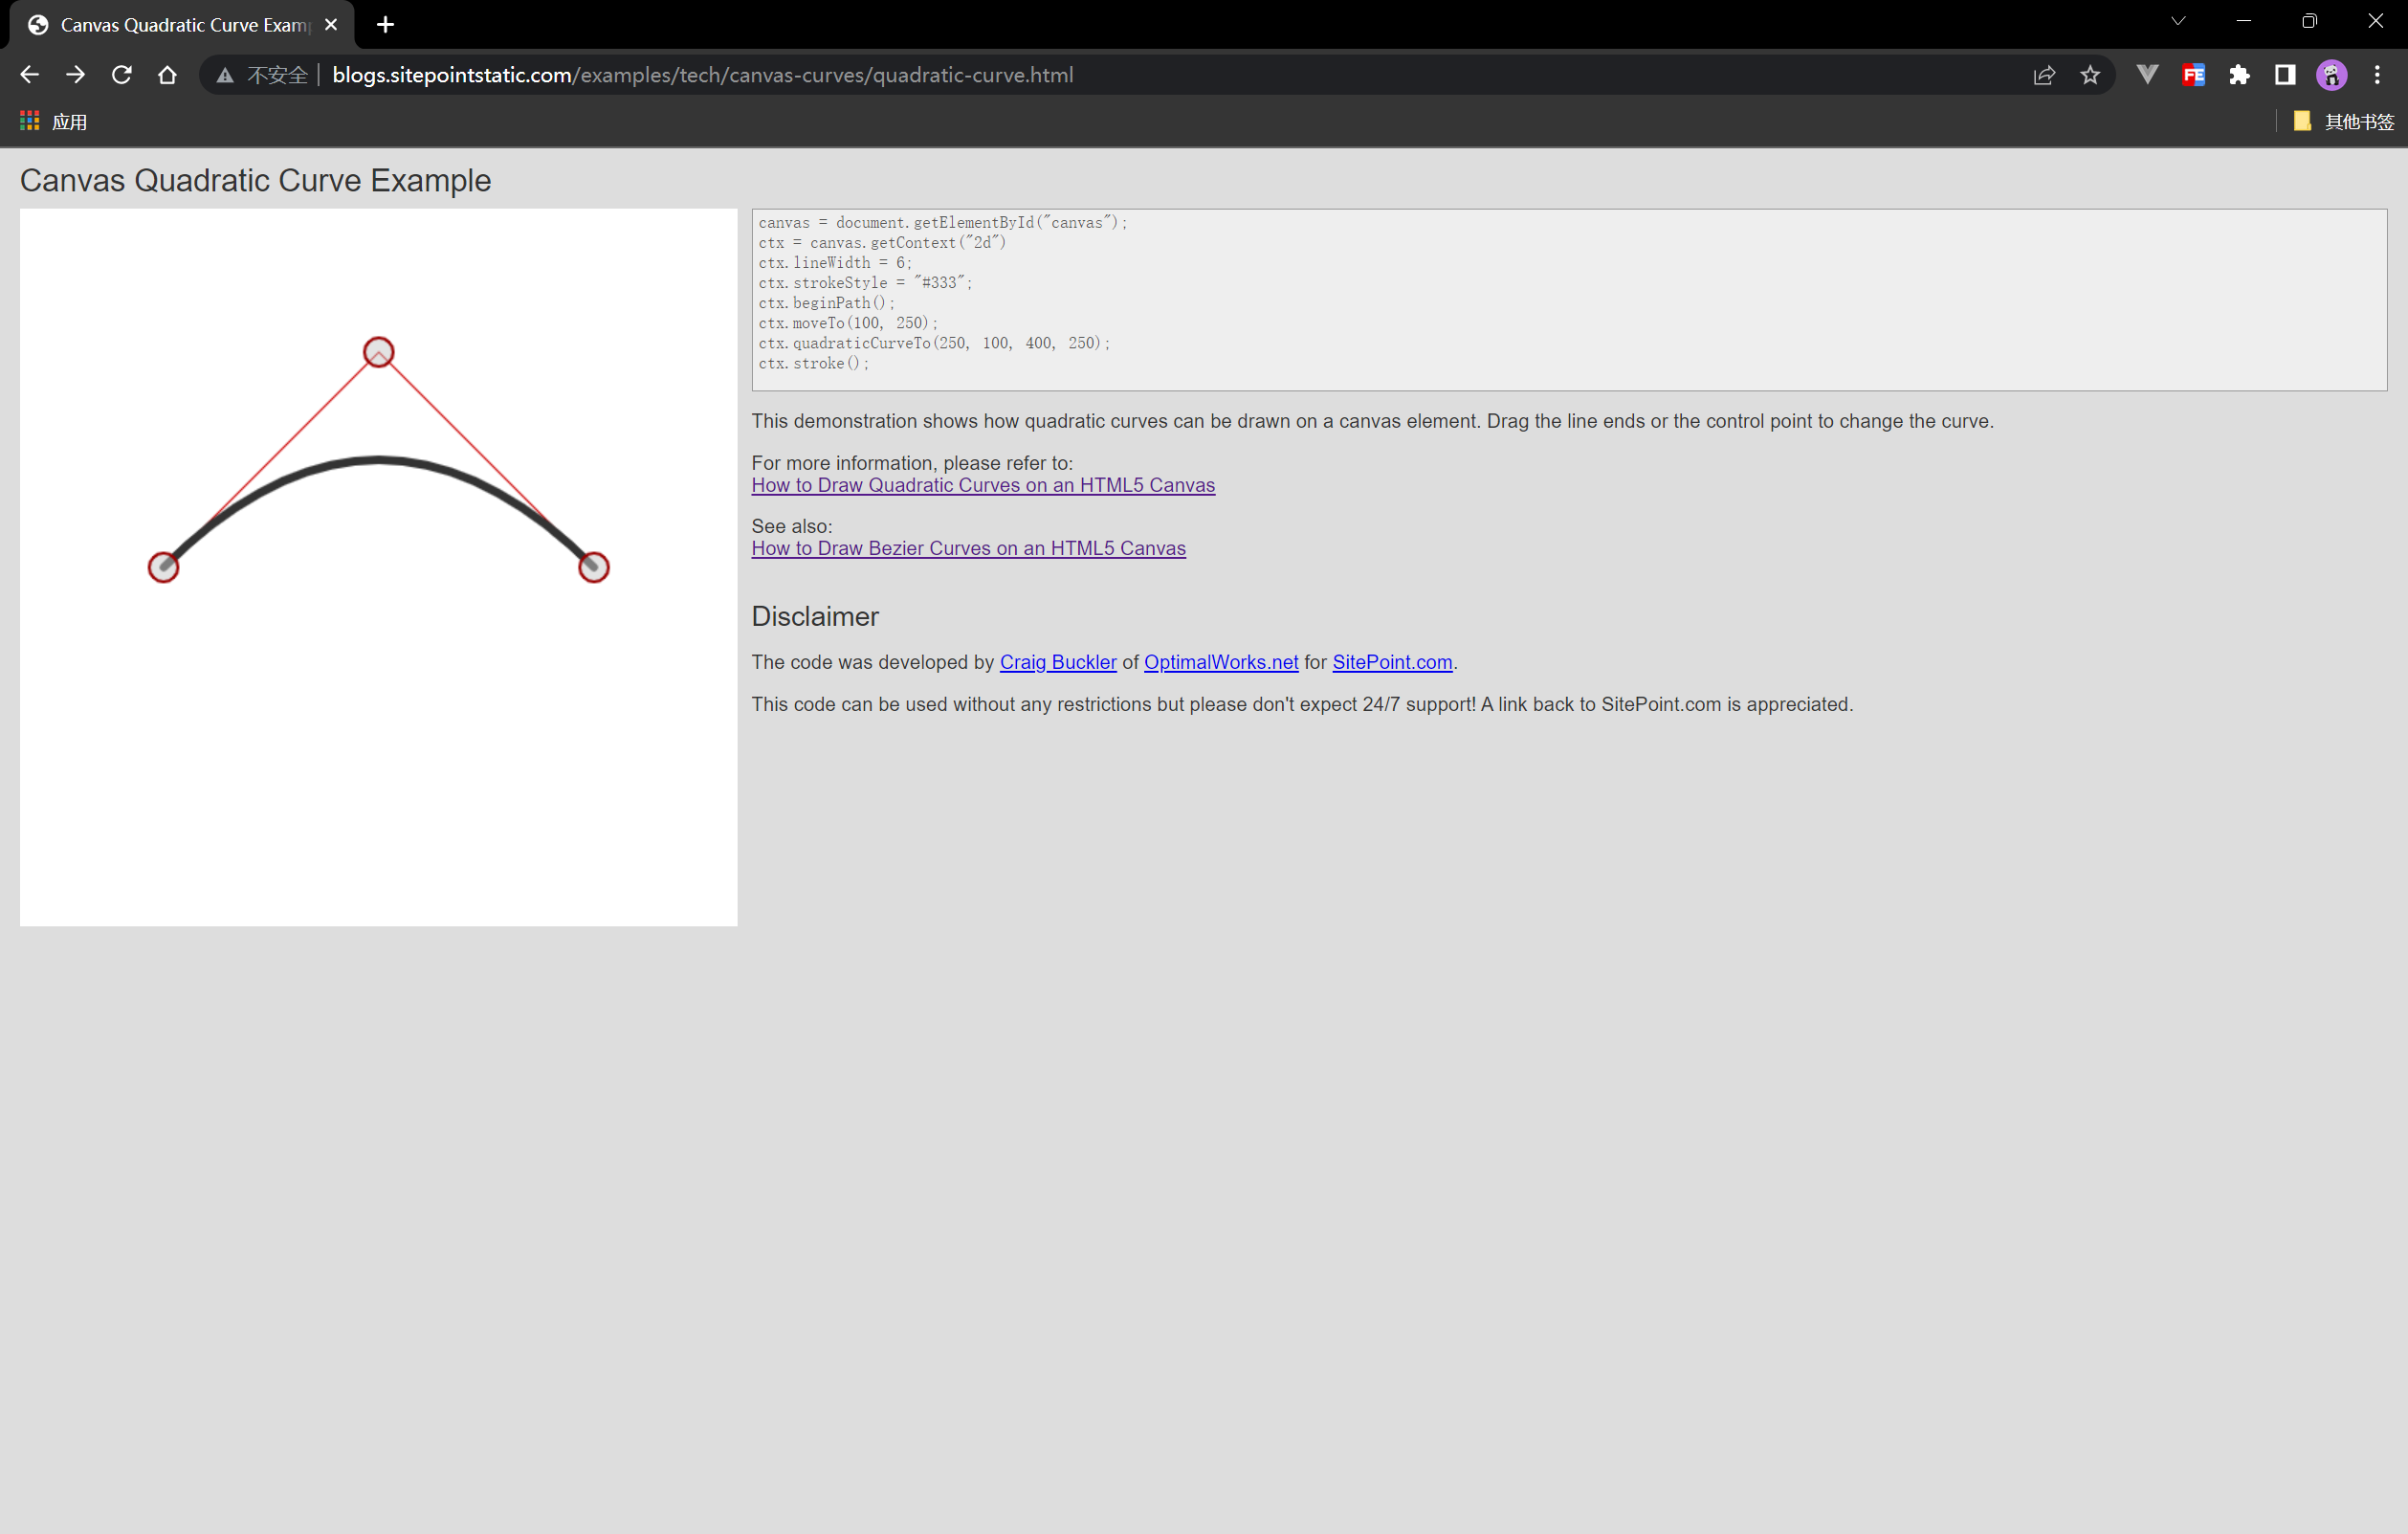
在这推荐给大家一个在线调试二次贝塞尔曲线的小工具,大家可以在这里调节好之后,复制代码到IDE里即可:
链接:http://blogs.sitepointstatic.com/examples/tech/canvas-curves/quadratic-curve.html
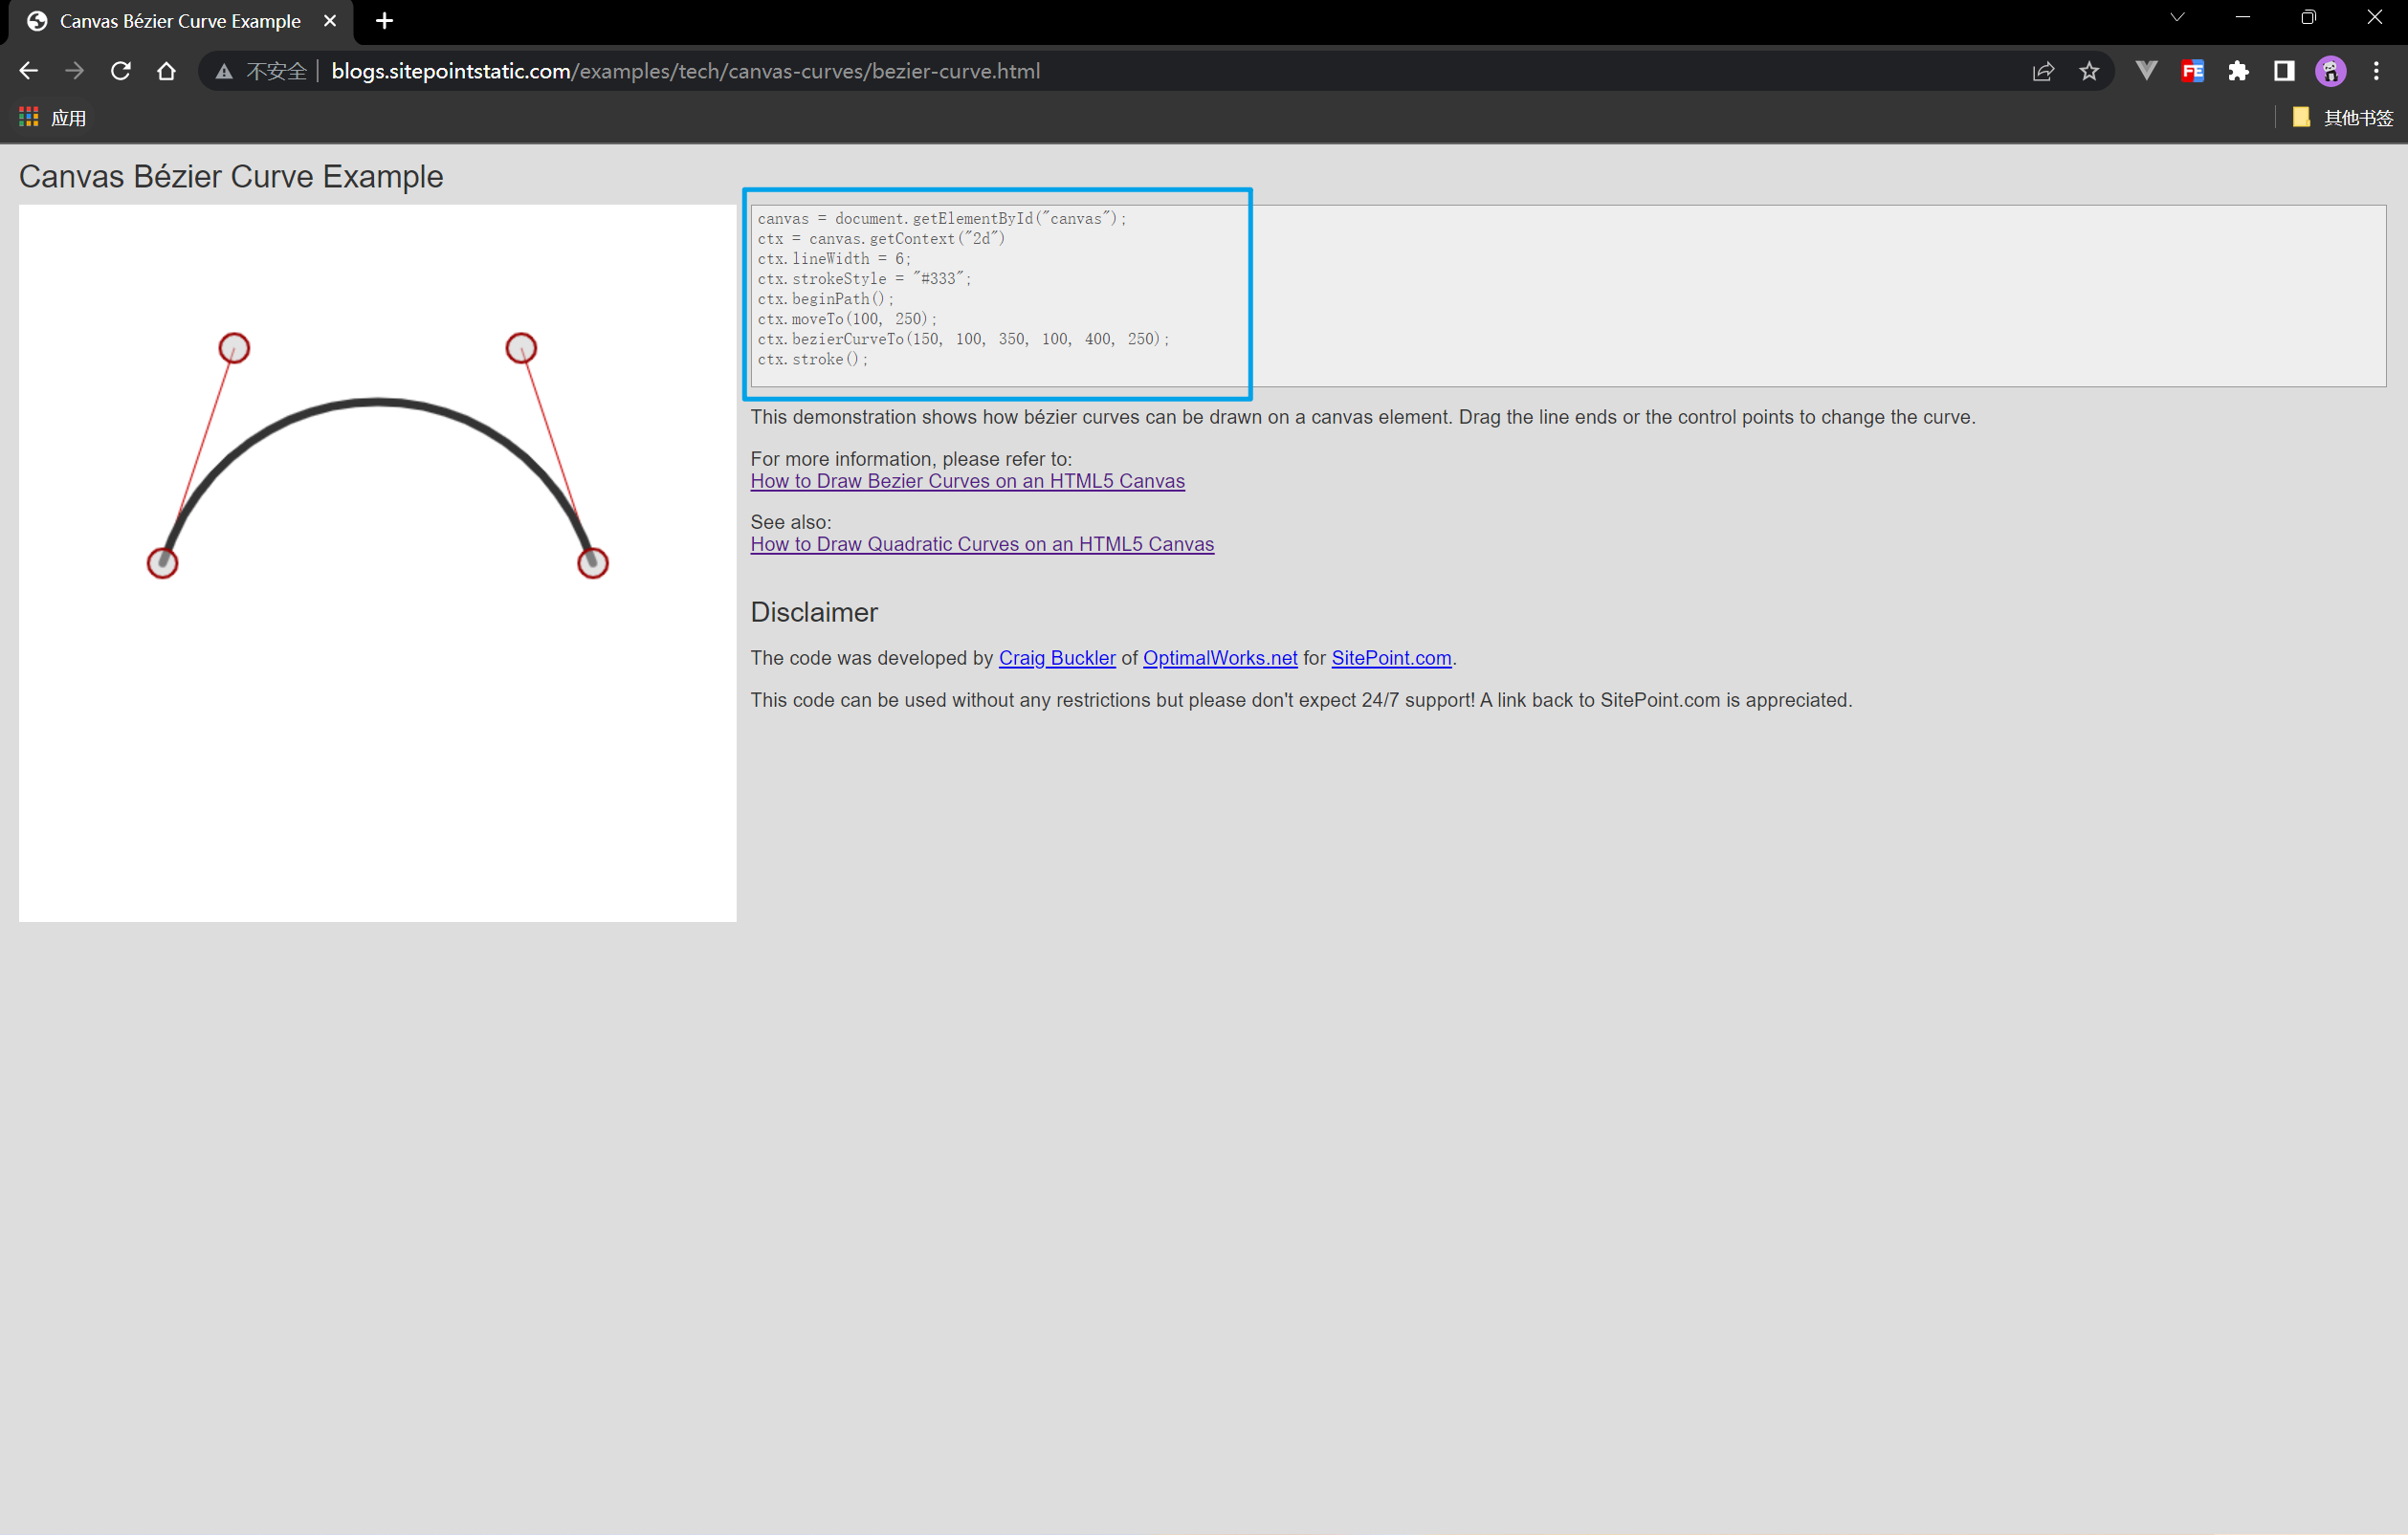
三次贝塞尔曲线
二次贝塞尔曲线由一个控制点控制,而三次贝塞尔曲线由两个控制点来控制。
使用
bezierCurveTo()
来绘制三次贝塞尔曲线:

例如:
<canvasid="canvas"height="600"width="700"></canvas><script>
    canvas = document.getElementById("canvas");
    ctx = canvas.getContext("2d")
    ctx.lineWidth =6;
    ctx.strokeStyle ="#333";
    ctx.beginPath();
    ctx.moveTo(100,250);
    ctx.bezierCurveTo(213,100,260,371,400,250);
    ctx.stroke();</script>
显示:
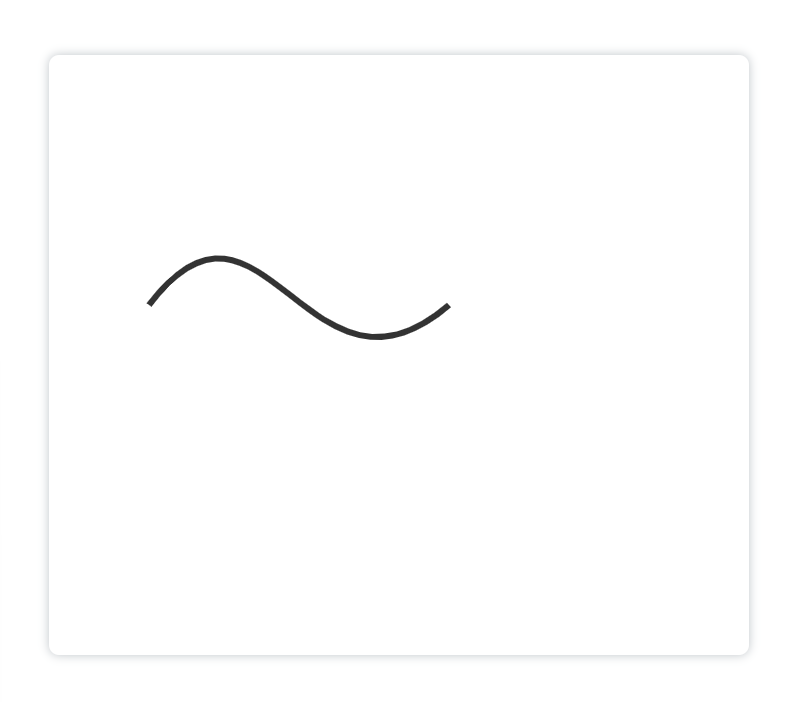
解释:
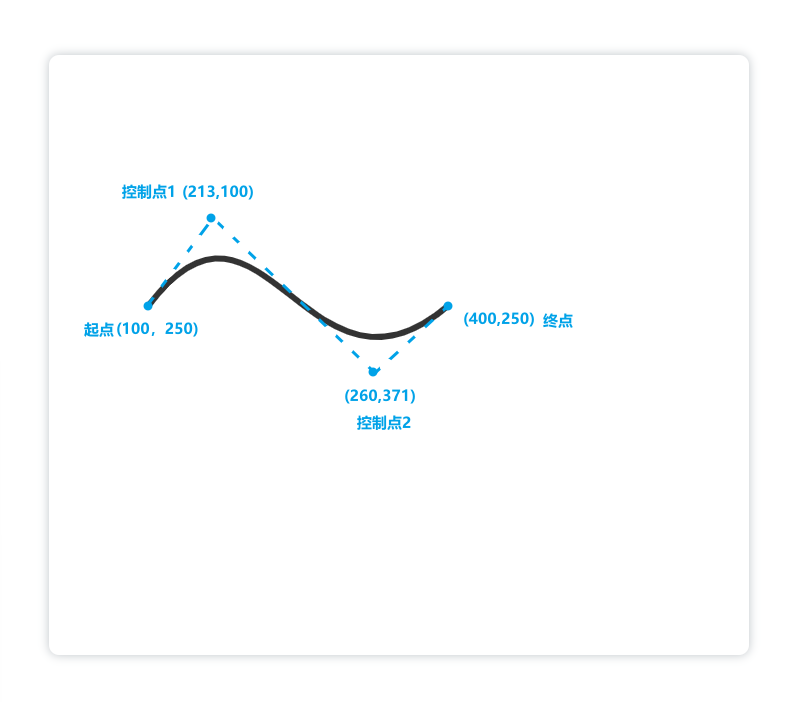
同样,三次贝塞尔曲线也有调试工具,可以手动调节到目标曲线,再复制右侧代码即可:
链接:http://blogs.sitepointstatic.com/examples/tech/canvas-curves/bezier-curve.html
7. 画虚线
使用
setLineDash([])
方法来绘制虚线,
setLineDash([])
方法可以接收若干个参数,例如:
<canvasid="canvas"height="600"width="700"></canvas><script>
    canvas = document.getElementById("canvas");
    ctx = canvas.getContext("2d")
    ctx.beginPath()
    ctx.lineWidth =10
    ctx.strokeStyle ='skyblue'
    ctx.moveTo(200,200)
    ctx.lineTo(500,200)
    ctx.setLineDash([10])
    ctx.stroke()
    ctx.beginPath()
    ctx.moveTo(200,300)
    ctx.lineTo(500,300)
    ctx.setLineDash([10,30])
    ctx.stroke()
    ctx.beginPath()
    ctx.moveTo(200,400)
    ctx.lineTo(500,400)
    ctx.setLineDash([10,30,5])
    ctx.stroke()</script>
显示:
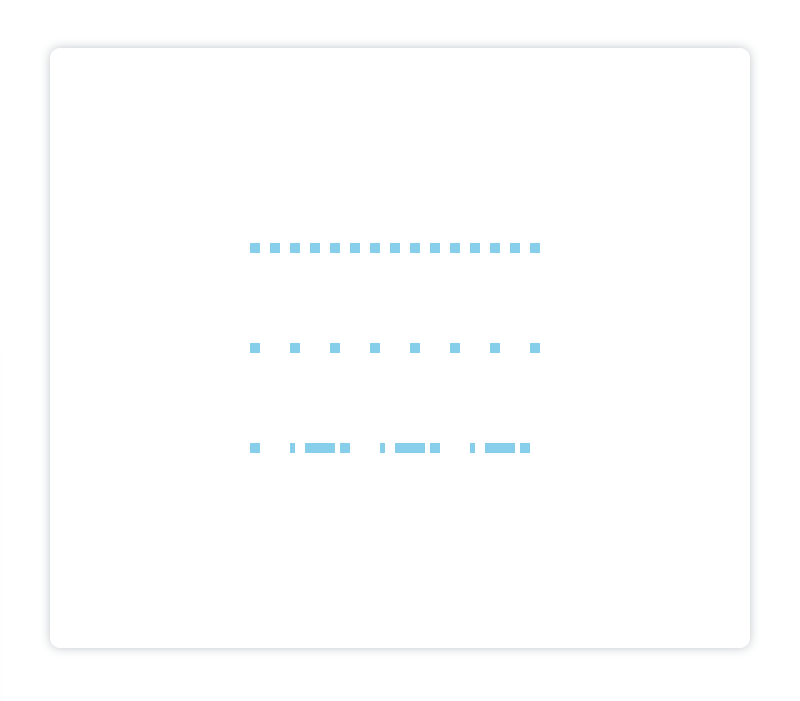
解读:
setLineDash([])
里的数组参数会“铺开”,下标为偶数的项为实线,为奇数项为透明线段,数字的大小代表着线段的长度
你也可以结合
arc()、ellipse()、arcTo()...
方法,画一个虚线的图形,比如:
<canvasid="canvas"height="600"width="700"></canvas><script>
    canvas = document.getElementById("canvas");
    ctx = canvas.getContext("2d")
    ctx.arc(350,300,150,0,[(Math.PI)/180]*360,false)
    ctx.setLineDash([10,20,5])
    ctx.lineWidth =8
    ctx.strokeStyle ='skyblue'
    ctx.stroke()
    console.log(ctx.getLineDash());</script>
显示:

getLineDash()
方法可以获得当前虚线设置的样式,它的长度为非负偶数。例如:
<canvasid="canvas"height="600"width="700"></canvas><script>
    canvas = document.getElementById("canvas");
    ctx = canvas.getContext("2d")
    ctx.beginPath()
    ctx.moveTo(200,400)
    ctx.lineTo(500,400)
    ctx.setLineDash([10,30,5])
    ctx.stroke()
    console.log(ctx.getLineDash());
    ctx.beginPath()
    ctx.moveTo(200,200)
    ctx.lineTo(500,200)
    ctx.setLineDash([10,30])
    ctx.stroke()
    console.log(ctx.getLineDash());</script>
打印出:
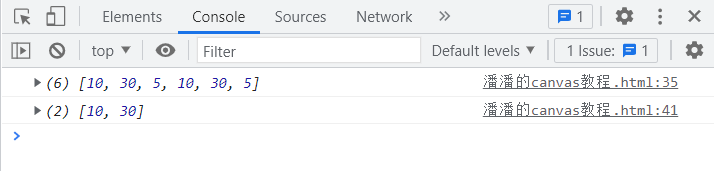
如果虚线设置的样式是基数,那么
getLineDash()
方法得到的是两组样式的集合。
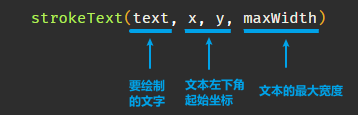
二、绘制文本
下面讲解的是用canvas绘制文本的方法,其实如果学会了绘制图形,在学绘制文本就会感觉很简单了。
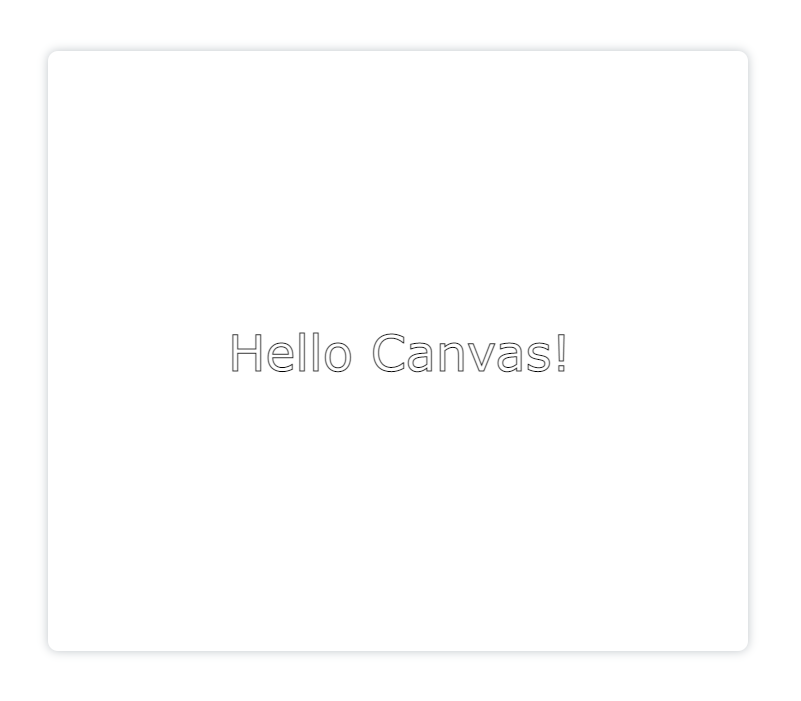
Hello Canvas!
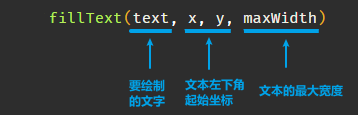
使用
strokeText()
方法接收四个参数绘制描边文本:
示例:
<canvasid="canvas"height="600"width="700"></canvas><script>const canvas = document.getElementById('canvas')const ctx = canvas.getContext('2d')

    ctx.font ='50px Verdana'// 为了展示方便,这里为文本添加了样式,使用 .font 设置样式会在后边讲到
    ctx.strokeText('Hello Canvas!',180,320,400)</script>
和
strokeText()
方法类似,使用
fillStroke()
方法绘制填充文本:
示例:
<canvasid="canvas"height="600"width="700"></canvas><script>const canvas = document.getElementById('canvas')const ctx = canvas.getContext('2d')

    ctx.font ='50px Verdana'
    ctx.fillText('Hello Canvas!',180,320,400)</script>

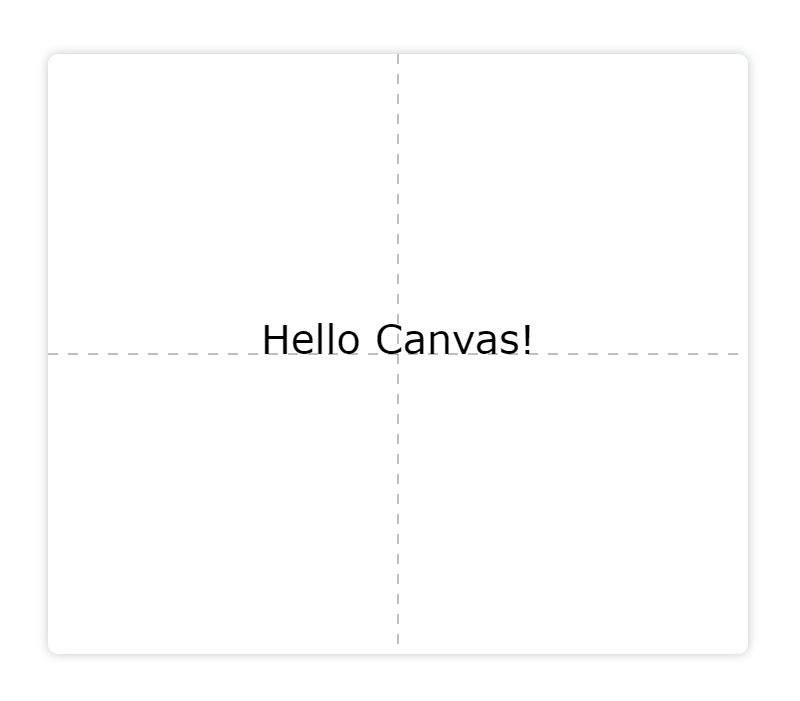
设置文本样式
.font
方法可以设置文本大小和字体;
.textAlign
:设置文本的对齐方式,可选
left
/
right
/
center
/
start
/
end
,对齐方式是以文本对
strokeText()
方法中坐标参数为参考的水平方向对齐方式。这段代码可以帮助你理解
textAlign
方法(仔细看代码和注释部分):
<canvasid="canvas"height="600"width="700"></canvas><script>const canvas = document.getElementById('canvas')const ctx = canvas.getContext('2d')// 居中对齐文本:
    ctx.beginPath()
    ctx.font ='40px Verdana'
    ctx.textAlign ='center'
    ctx.fillText('Hello Canvas!',350,300,400)// 两条相互垂直的辅助线,两条线的交点为文本绘制的起始点:
    ctx.beginPath()
    ctx.moveTo(350,0)
    ctx.lineTo(350,600)
    ctx.setLineDash([10])
    ctx.globalAlpha =0.5
    ctx.stroke()
    ctx.beginPath()
    ctx.moveTo(0,300)
    ctx.lineTo(700,300)
    ctx.stroke()</script>
textBaseline
:决定了文本在垂直方向的对齐方式,可选
alphabetic
/
top
/
hanging
/
middle
/
ideographic
/
bottom
。仔细看下面这段代码和注释部分:
<canvasid="canvas"height="600"width="700"></canvas><script>const canvas = document.getElementById('canvas')const ctx = canvas.getContext('2d')// 垂直方向对齐为top:
    ctx.beginPath()
    ctx.font ='30px Verdana'
    ctx.textAlign ='center'
    ctx.textBaseline ='top'
    ctx.fillText('Hello Canvas!',120,300,200)// 垂直方向对齐为middle:
    ctx.beginPath()
    ctx.textBaseline ='middle'
    ctx.fillText('Hello Canvas!',350,300,200)// 垂直方向对齐为bottom:
    ctx.beginPath()
    ctx.textBaseline ='bottom'
    ctx.fillText('Hello Canvas!',600,300,200)// 一条水平过文本起始点的辅助线:
    ctx.beginPath()
    ctx.setLineDash([10])
    ctx.globalAlpha =0.5
    ctx.moveTo(0,300)
    ctx.lineTo(700,300)
    ctx.stroke()</script>

.direction
:设置文本的绘制方向,可选
ltr
(left to right)和
rtl
(right to left),比如:
<canvasid="canvas"height="600"width="700"></canvas><script>const canvas = document.getElementById('canvas')const ctx = canvas.getContext('2d')// 从左向右绘制:
    ctx.beginPath()
    ctx.font ='40px Verdana'
    ctx.textAlign ='center'
    ctx.lineWidth =1.6
    ctx.direction ='ltr'
    ctx.strokeText('Hello Canvas !',350,220,400)
    ctx.closePath()// 从右向左绘制:
    ctx.beginPath()
    ctx.direction ='rtl'
    ctx.strokeText('Hello Canvas !',350,380,400)</script>

文本样式综合示例:
<canvasid="canvas"height="600"width="700"></canvas><script>const canvas = document.getElementById('canvas')const ctx = canvas.getContext('2d')// 左对齐文本:
    ctx.beginPath()
    ctx.font ='40px Verdana'
    ctx.textAlign ='left'
    ctx.direction ="ltr"
    ctx.strokeText('Hello Canvas!',350,50,400)// 中间对齐文本:
    ctx.beginPath()
    ctx.font ='40px serif'
    ctx.textAlign ='center'
    ctx.direction ='ltr'
    ctx.strokeText('Hello Canvas!',350,150,400)// 右对齐文本:
    ctx.beginPath()
    ctx.font ='40px serif'
    ctx.textAlign ='right'
    ctx.direction ='ltr'
    ctx.strokeText('Hello Canvas!',350,250,400)
    ctx.beginPath()// 文本方向为从右向左绘制文本:// 对齐方式为start、center、end
    ctx.font ='40px serif'
    ctx.textAlign ='start'
    ctx.direction ='rtl'
    ctx.strokeText('Hello Canvas!',350,350,400)
    ctx.beginPath()
    ctx.font ='40px serif'
    ctx.textAlign ='center'
    ctx.direction ='rtl'
    ctx.strokeText('Hello Canvas!',350,450,400)
    ctx.beginPath()
    ctx.font ='50px serif'
    ctx.textAlign ='end'
    ctx.direction ='rtl'
    ctx.strokeText('Hello Canvas!',350,550,400)// 绘制一条中心辅助线:
    ctx.beginPath()
    ctx.moveTo(350,0)
    ctx.lineTo(350,600)
    ctx.strokeStyle ='red'
    ctx.setLineDash([10])
    ctx.stroke()</script>

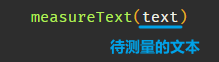
获取文本宽度
可以使用
measureText()
方法测量文本的宽度:
例如:
<canvasid="canvas"height="600"width="700"></canvas><script>var canvas = document.getElementById('canvas');var ctx = canvas.getContext('2d');
    ctx.beginPath()
    ctx.font ='50px Verdana'// 改变字的大小,文本的长度也会发生变化
    ctx.textAlign ='center'// 不是必须写出来
    ctx.textBaseline ='middle'// 不是必须写出来
    ctx.strokeText('Hello Canvas!',350,300,400)// 不是必须写出来const width = ctx.measureText('Hello Canvas!').width
    console.log('文本的宽度为:', width);</script>
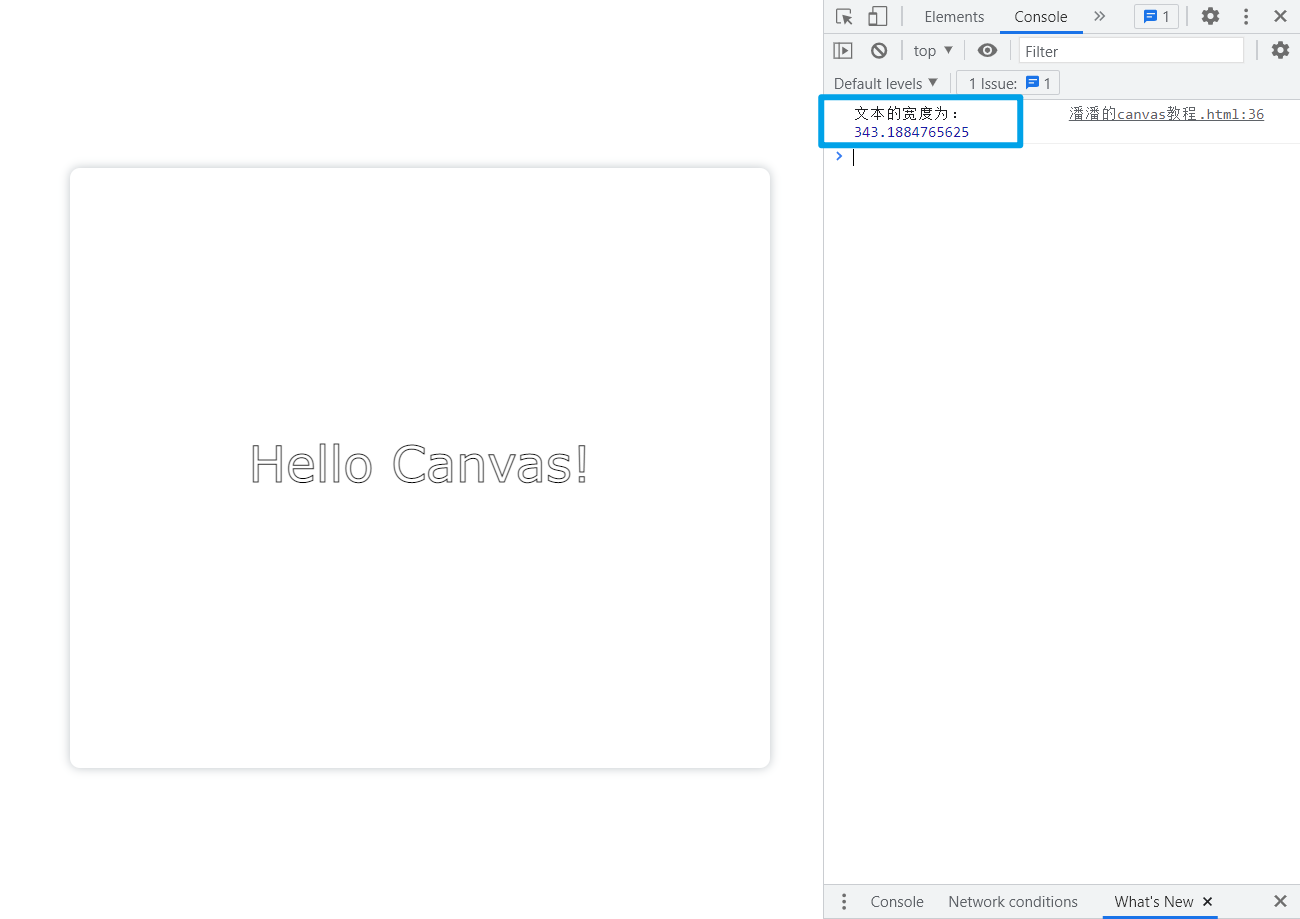
注意:这里不是必须显示出文本来才能计算文本的长度,测量结果也不受文本的最大宽度等外界因素的影响,文本长度的测量结果只和文本的
font
参数相关。
样式补充
渐变色
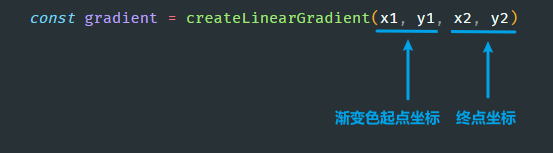
(1)线性渐变
使用
createLinearGradient()
来创建线性渐变色:
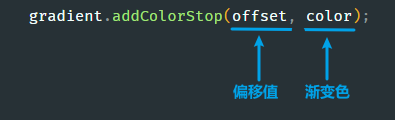
使用
addColorStop()
添加渐变色:
看例子:
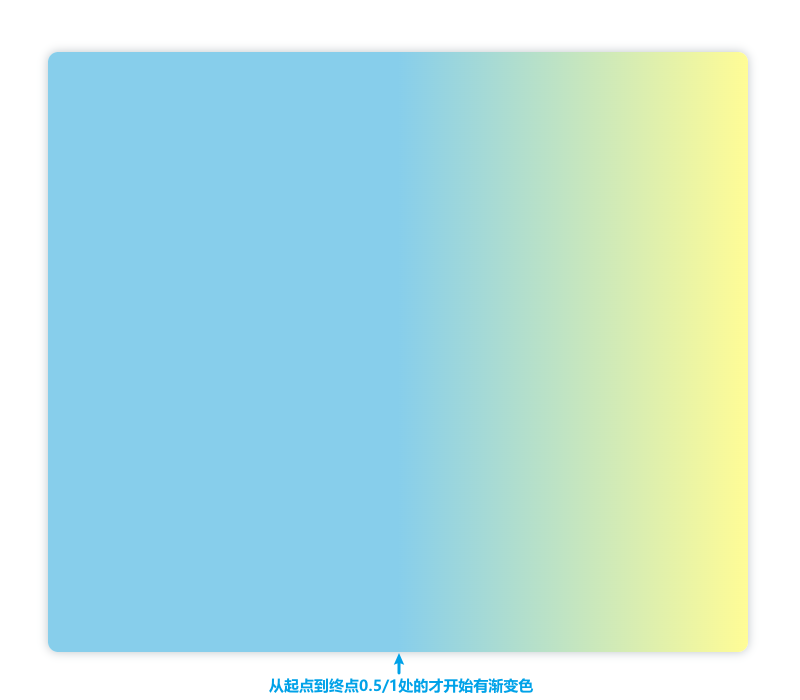
<canvasid="canvas"height="600"width="700"></canvas><script>// 获取 canvas 元素var canvas = document.getElementById('canvas');var ctx = canvas.getContext('2d');// 创建渐变var gradient = ctx.createLinearGradient(0,0,700,0);
    gradient.addColorStop(0,"skyblue");// 第一个偏移值为0
    gradient.addColorStop(1,"#fffc96");// 第一个偏移值为1
    ctx.beginPath()
    ctx.fillStyle = gradient
    ctx.fillRect(0,0,700,600)
    ctx.fill()</script>
显示:

如果我们把上边代码中的第一个偏移值改为0.5,那么显示如下:
(2)径向渐变
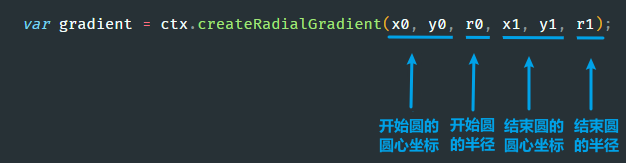
同线性渐变的唯一区别就是,径向渐变是通过
createRadialGradient()
方法来创建渐变色:
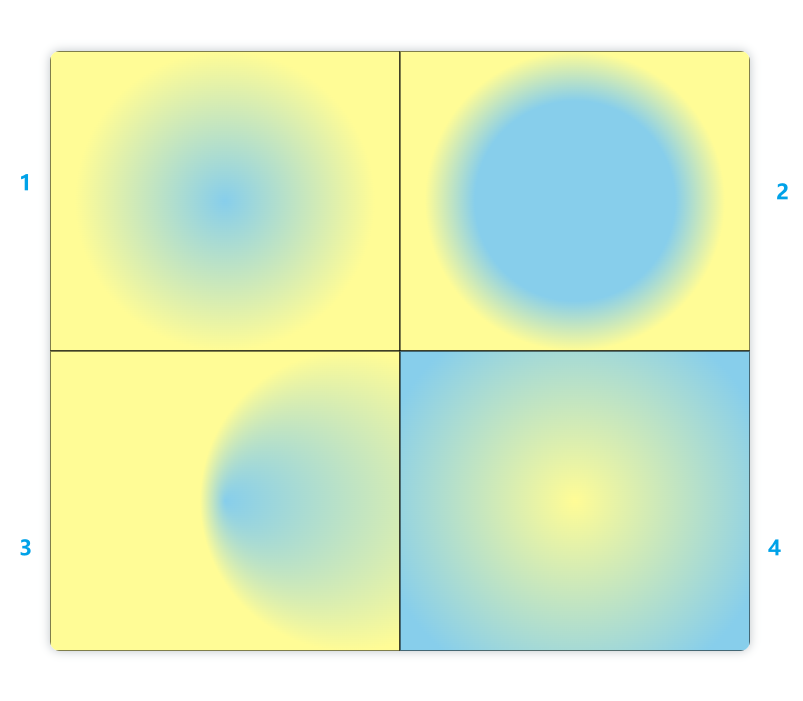
示例:
<canvasid="canvas"height="600"width="700"></canvas><script>// 获取 canvas 元素var canvas = document.getElementById('canvas');var ctx = canvas.getContext('2d');// 创建渐变var gradient1 = ctx.createRadialGradient(175,150,0,175,150,150);
    gradient1.addColorStop(0,"skyblue");
    gradient1.addColorStop(1,"#fffc96");var gradient2 = ctx.createRadialGradient(525,150,100,525,150,150);
    gradient2.addColorStop(0,"skyblue");
    gradient2.addColorStop(1,"#fffc96");var gradient3 = ctx.createRadialGradient(175,450,0,300,450,150);
    gradient3.addColorStop(0,"skyblue");
    gradient3.addColorStop(1,"#fffc96");var gradient4 = ctx.createRadialGradient(525,450,200,525,450,0);
    gradient4.addColorStop(0,"skyblue");
    gradient4.addColorStop(1,"#fffc96");
    ctx.beginPath()
    ctx.fillStyle = gradient1
    ctx.fillRect(0,0,350,300)
    ctx.strokeRect(0,0,350,300)
    ctx.beginPath()
    ctx.fillStyle = gradient2
    ctx.fillRect(350,0,350,300)
    ctx.strokeRect(350,0,350,300)
    ctx.beginPath()
    ctx.fillStyle = gradient3
    ctx.fillRect(0,300,350,300)
    ctx.strokeRect(0,300,350,300)
    ctx.beginPath()
    ctx.fillStyle = gradient4
    ctx.fillRect(350,300,350,300)
    ctx.strokeRect(350,300,350,300)</script>
显示:
添加指定元素
使用
createPattern()
方法接收两个参数来添加指定元素:
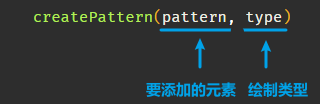
pattern可以是图片,视频,canvas对象;type可以选择repeat/no-repeat/repeat-x(沿x轴平铺)/repeat-y(沿y轴平铺)
添加image
<canvasid="canvas"height="600"width="700"></canvas><script>var canvas = document.getElementById('canvas');var ctx = canvas.getContext('2d');// 创建一个 image对象:var img =newImage();// 绑定图片的src:
    img.src ="http://panpan.dapanna.cn//image-20221006120003257.png";// 当图片加载完之后运行:
    img.onload=function(){// 创建图案:var ptrn = ctx.createPattern(img,'no-repeat');
        ctx.fillStyle = ptrn;
        ctx.fillRect(0,0,700,600);}</script>
显示:

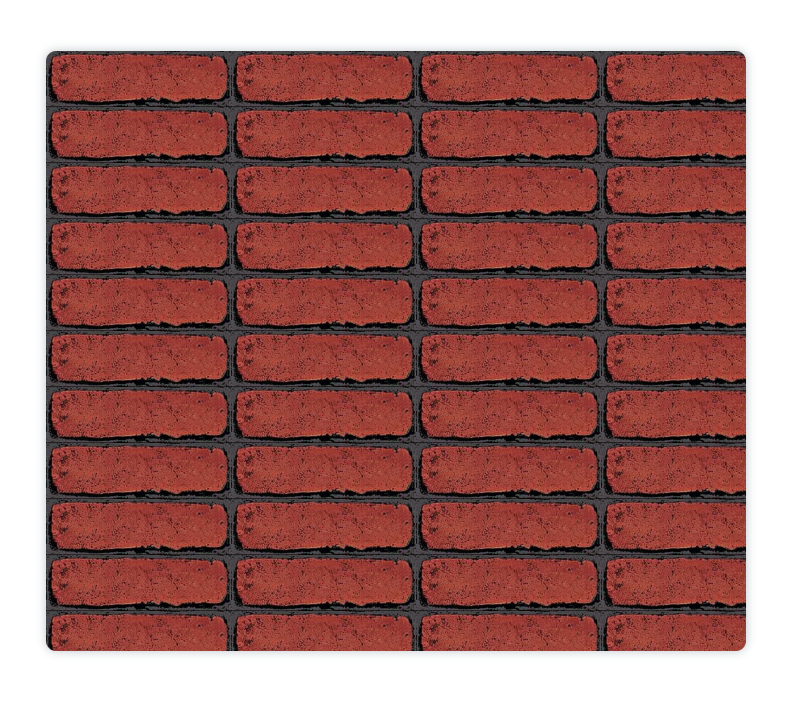
当然,你也可以使用这种方式在canvas画布中添加图片:
<canvasid="canvas"height="600"width="700"></canvas><imgid="img"src="http://panpan.dapanna.cn//image-20221008162339344.png"alt=""style="display:none;"><script>var canvas = document.getElementById('canvas');var ctx = canvas.getContext('2d');const img = document.getElementById('img')// 当图片加载完之后运行:
    img.onload=function(){// 图片加载完以后// 创建图案var ptrn = ctx.createPattern(img,'repeat');
        ctx.fillStyle = ptrn;
        ctx.fillRect(0,0,700,600);}</script>
这里设置为repeat,显示:
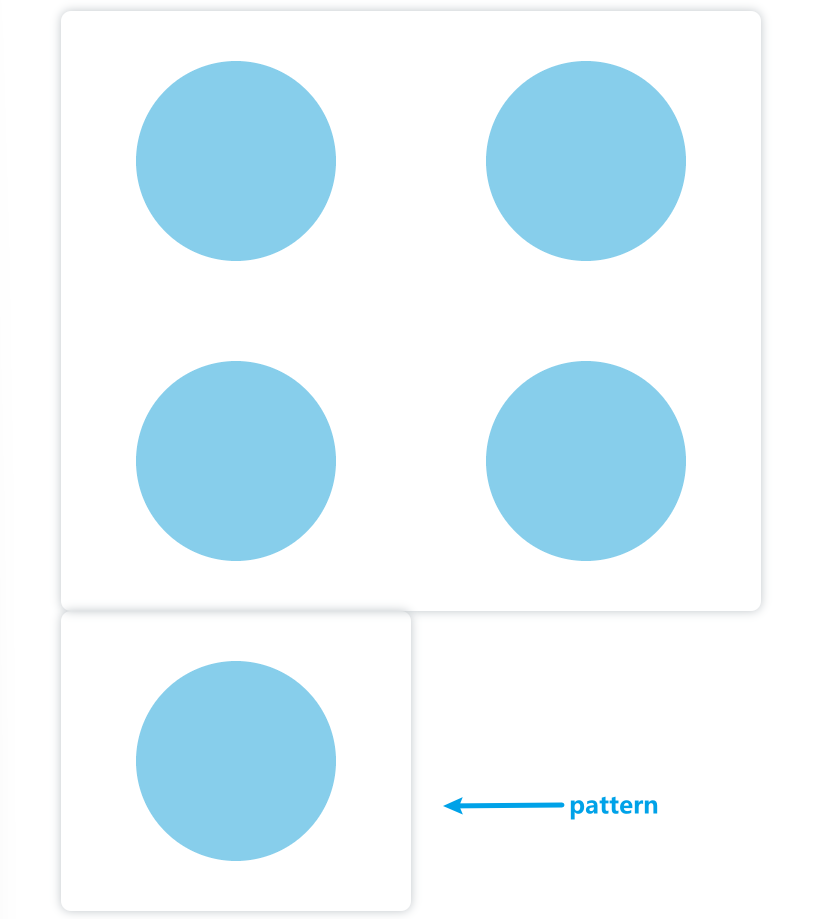
添加canvas
和添加image类似:
<canvasid="canvas1"height="600"width="700"></canvas><canvasid="canvas2"height="300"width="350"></canvas><script>// 创建一个填充pattern的canvas画布:const canvas1 = document.getElementById('canvas1')const ctx1 = canvas1.getContext('2d');// 创建一个canvas画布作为Pattern:const canvas2 = document.getElementById('canvas2');const ctx2 = canvas2.getContext('2d');
    ctx2.arc(175,150,100,0,[(Math.PI)/180]*360)
    ctx2.fillStyle ='skyblue'
    ctx2.fill()// 把canvas2作为pttern重复绘制到canvas1中:const pat = ctx1.createPattern(canvas2,'repeat')
    ctx1.fillStyle = pat
    ctx1.fillRect(0,0,700,600)</script>
显示:
阴影样式
文本和图形都可以设置阴影样式,且方法一样:
shadowOffsetX = 数字
:设置阴影在X轴上的延申距离,正值表示阴影向x轴正方向延申,负值表示阴影向x轴负方向延申;
shadowOffsetY = 数字
:设置阴影在Y轴上的延申距离,正值表示阴影向y轴正方向延申,负值表示阴影向y轴负方向延申;
shadowBlur = 数字
:设定阴影的模糊度,默认为0;
shadowColor = '颜色'
:设置阴影的颜色,默认是全透明色;
综合示例:
<canvasid="canvas"height="600"width="700"></canvas><script>var canvas = document.getElementById('canvas');var ctx = canvas.getContext('2d');// 绘制一条带阴影的线段:
    ctx.moveTo(100,100)
    ctx.lineTo(600,100)
    ctx.shadowOffsetX =10// 向x轴正方向平移10像素
    ctx.shadowOffsetY =10// 向y轴正方向平移10像素
    ctx.shadowColor ='#ccc'// 设置阴影颜色
    ctx.shadowBlur =3// 设置阴影模糊度
    ctx.lineWidth =6
    ctx.stroke()// 绘制一个带阴影的矩形:
    ctx.fillRect(100,150,100,50)// 绘制带阴影的文本:
    ctx.lineWidth =1
    ctx.font ='30px Verdana'
    ctx.strokeText('Hello Canvas!',300,190,400)// 绘制带阴影的圆:
    ctx.beginPath()
    ctx.shadowOffsetX =-20// 向x轴负方向平移20像素
    ctx.shadowOffsetY =-20// 向y轴负方向平移20像素
    ctx.shadowColor ='skyblue'// 设置阴影颜色为天蓝色
    ctx.shadowBlur =9// 设置阴影模糊度
    ctx.lineWidth =5
    ctx.arc(350,400,100,0,[(Math.PI)/180]*360)
    ctx.stroke()</script>

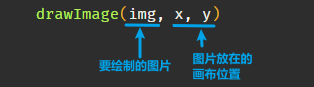
三、绘制图片
使用
drawImage()
方法绘制图形,该方法可以接收3-9个参数进行拉伸、裁剪等。比如基础的绘制图片接收3个参数即可:
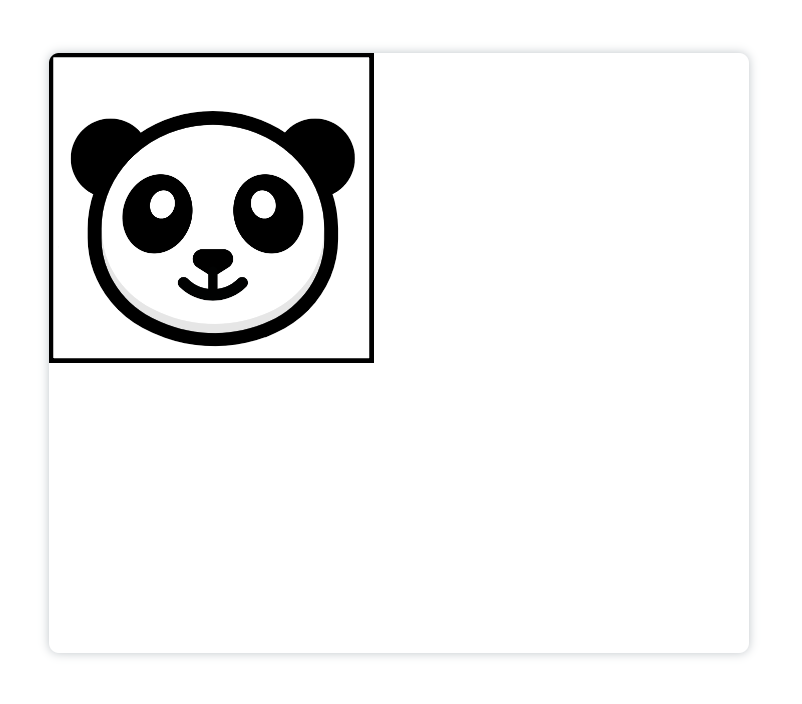
<canvasid="canvas"height="600"width="700"></canvas><script>var canvas = document.getElementById('canvas');var ctx = canvas.getContext('2d');// 创建一个图片对象:var img =newImage();
    img.src ='http://panpan.dapanna.cn//image-20221009113426344.png';// 图片加载完成之后绘制图片:
    img.onload=function(){
        ctx.drawImage(img,0,0);// 在(0,0)处绘制原图}</script>
如果要拉伸图片到指定宽和高,要在
drawImage()
方法上多加两个参数:
<canvasid="canvas"height="600"width="700"></canvas><script>var canvas = document.getElementById('canvas');var ctx = canvas.getContext('2d');// 创建一个图片对象:var img =newImage();
    img.src ='http://panpan.dapanna.cn//image-20221009113426344.png';// 图片加载完成之后绘制图片:
    img.onload=function(){
        ctx.drawImage(img,0,0,500,500);// 在(0,0)处绘制被拉成500×500像素的图片}</script>

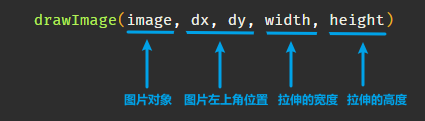
drawImage()
方法再加4个参数可以绘制拉伸和裁剪之后的图片:

<canvasid="canvas"height="600"width="700"></canvas><script>var canvas = document.getElementById('canvas');var ctx = canvas.getContext('2d');// 创建一个图片对象:var img =newImage();
    img.src ='http://panpan.dapanna.cn//image-20221009113426344.png';// 图片加载完成之后绘制图片:
    img.onload=function(){
        ctx.drawImage(img,100,100,300,300,0,0,500,500);// 在(100,100)处向右下方裁剪300×300像素的被拉成500×500像素的图片}</script>
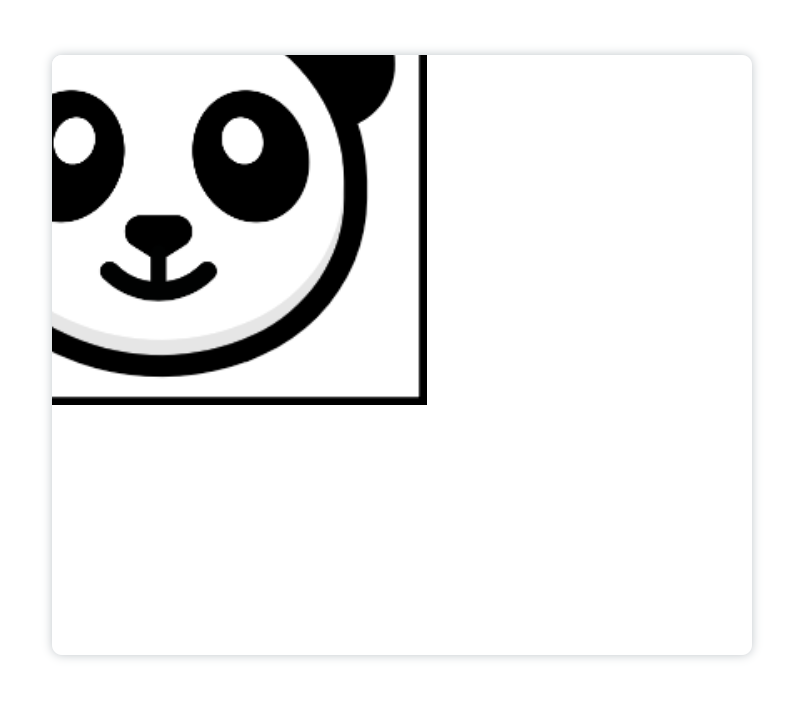
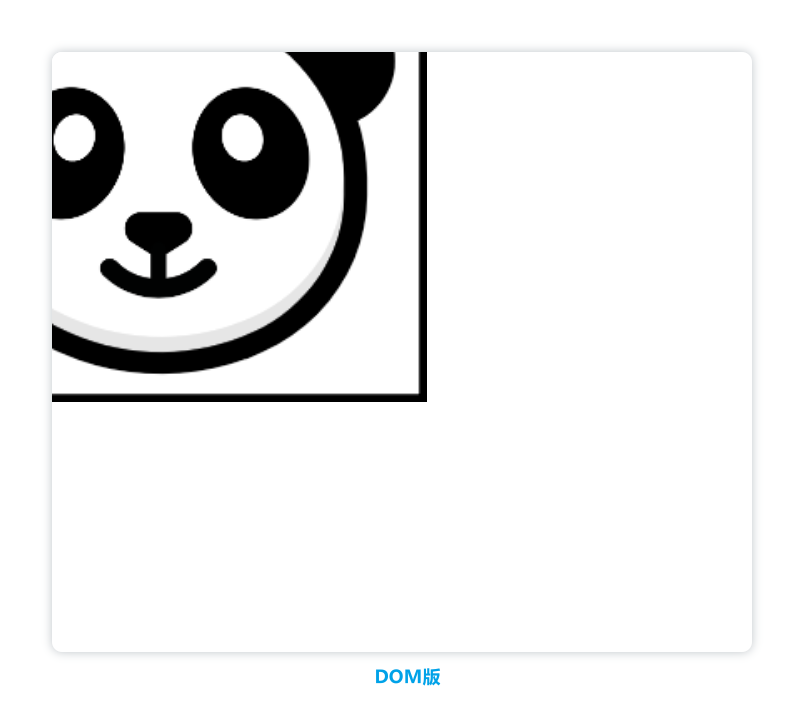
以上绘制的图片都是用js生成的image对象,我们也可以使用现有的DOM对象来绘制,比如:
<canvasid="canvas"height="600"width="700"></canvas><imgid="img"src="http://panpan.dapanna.cn//image-20221009113426344.png"alt=""style='display: none;'><script>const img = document.getElementById('img')var canvas = document.getElementById('canvas');var ctx = canvas.getContext('2d');
    img.onload=()=>{
        ctx.drawImage(img,100,100,300,300,0,0,500,500);// 在(100,100)处向右下方裁剪300×300像素的被拉成500×500像素的图片}</script>
绘制的效果和之前一样:
合成、保存和还原绘画状态、变形、裁剪
合成
当我们在绘制canvas画布的时候,不可避免地要考虑到绘制的顺序,如果我们希望一个图形一直置顶显示,那么就可以使用
globalCompositeOperation = type
这个方法,根据
type
的值,这个方法有以下几种作用:
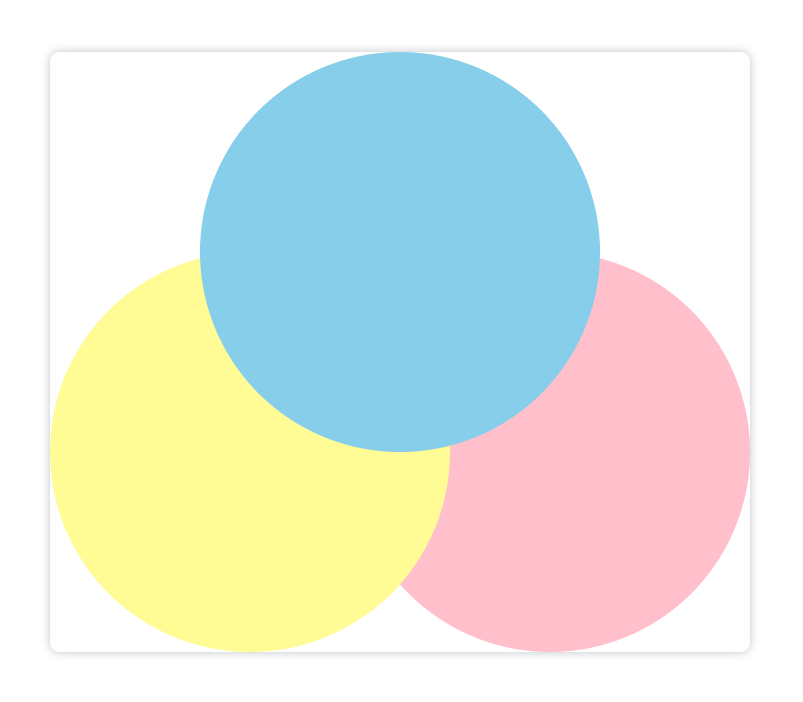
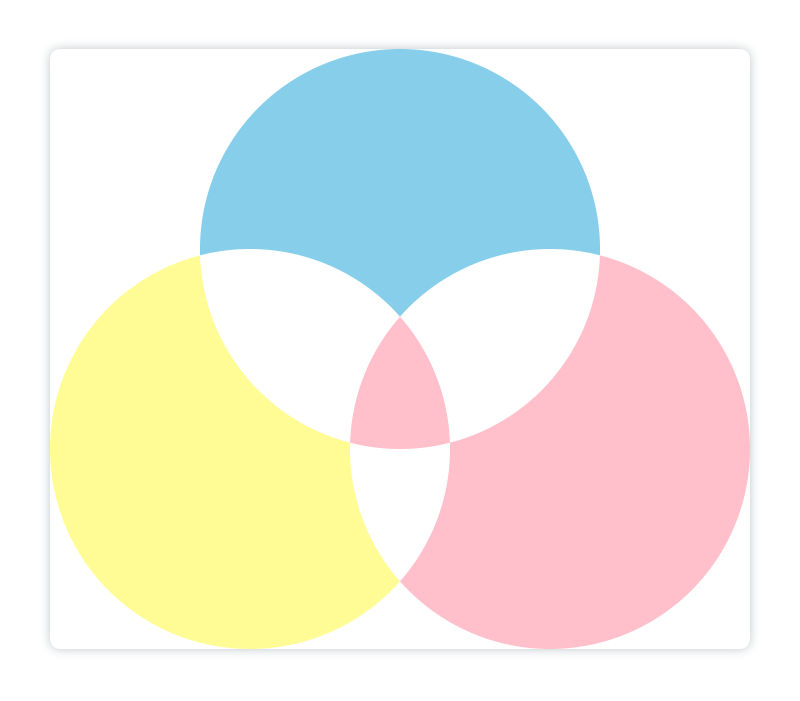
source-over
默认值,在已有图像之上绘制新图像。
<canvasid="canvas"height="600"width="700"></canvas><script>const canvas = document.getElementById('canvas');const ctx = canvas.getContext('2d');
    ctx.arc(350,200,200,0,[(Math.PI)/180]*360)
    ctx.fillStyle ='skyblue'
    ctx.globalCompositeOperation ='source-over'
    ctx.fill()
    ctx.beginPath()
    ctx.arc(200,400,200,0,[(Math.PI)/180]*360)
    ctx.fillStyle ='#fffc96'
    ctx.globalCompositeOperation ='source-over'
    ctx.fill()
    ctx.beginPath()
    ctx.arc(500,400,200,0,[(Math.PI)/180]*360)
    ctx.fillStyle ='pink'
    ctx.globalCompositeOperation ='source-over'
    ctx.fill()</script>

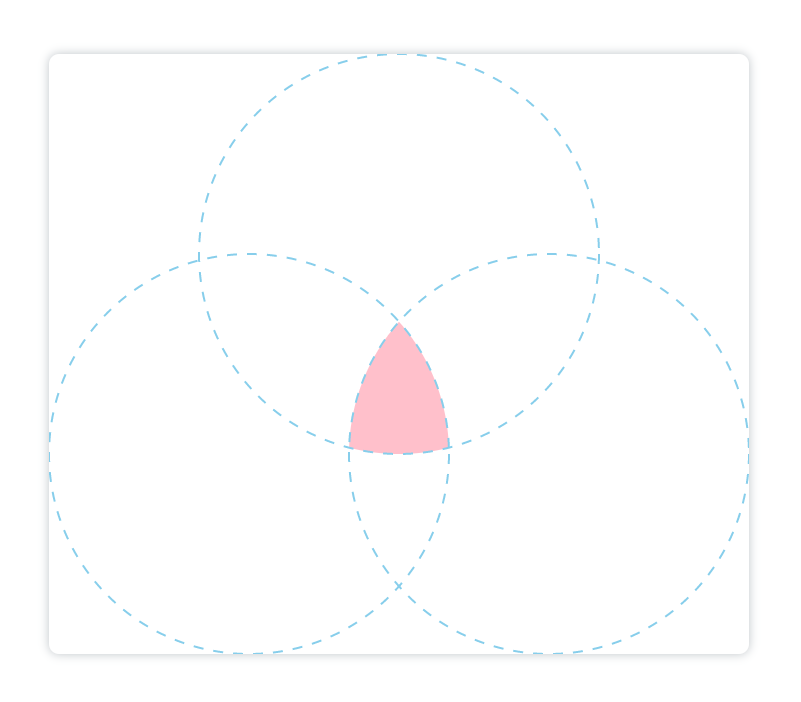
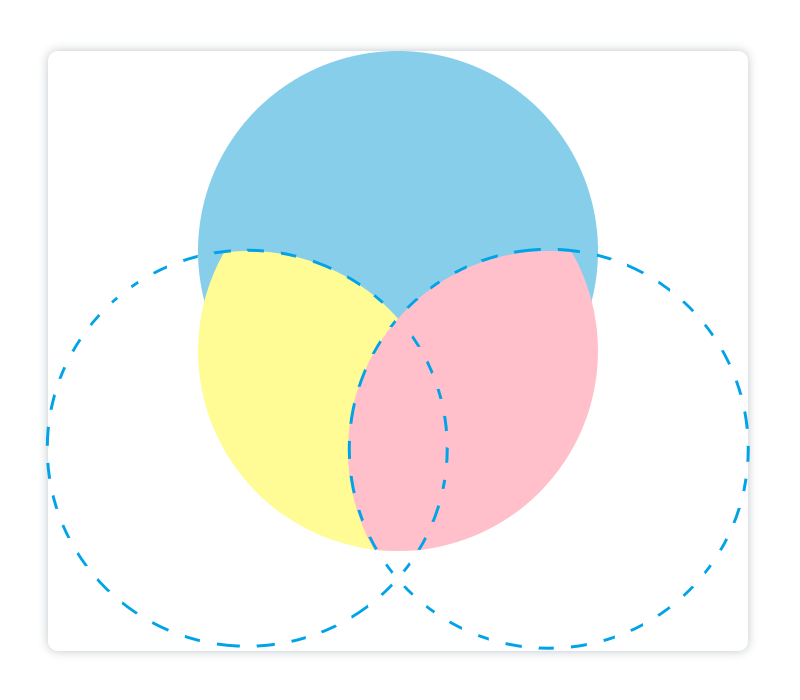
source-in
在已有图像中显示新绘制的图像。只有已有图像之内的新图像部分才会显示,已有图像是透明的。可以简单理解为,只会展示新图像与已有图像重叠的部分。
示例:
<canvasid="canvas"height="600"width="700"></canvas><script>const canvas = document.getElementById('canvas');const ctx = canvas.getContext('2d');// 第一个天蓝色圆:
    ctx.arc(350,200,200,0,[(Math.PI)/180]*360)
    ctx.fillStyle ='skyblue'
    ctx.globalCompositeOperation ='source-over'
    ctx.fill()// 第二个浅黄色圆:
    ctx.beginPath()
    ctx.arc(200,400,200,0,[(Math.PI)/180]*360)
    ctx.fillStyle ='#fffc96'
    ctx.globalCompositeOperation ='source-in'
    ctx.fill()// 第三个粉色圆:
    ctx.beginPath()
    ctx.arc(500,400,200,0,[(Math.PI)/180]*360)
    ctx.fillStyle ='pink'
    ctx.globalCompositeOperation ='source-in'
    ctx.fill()</script>
蓝色部分为为了便于大家理解我添加的辅助线,不属于图像部分:
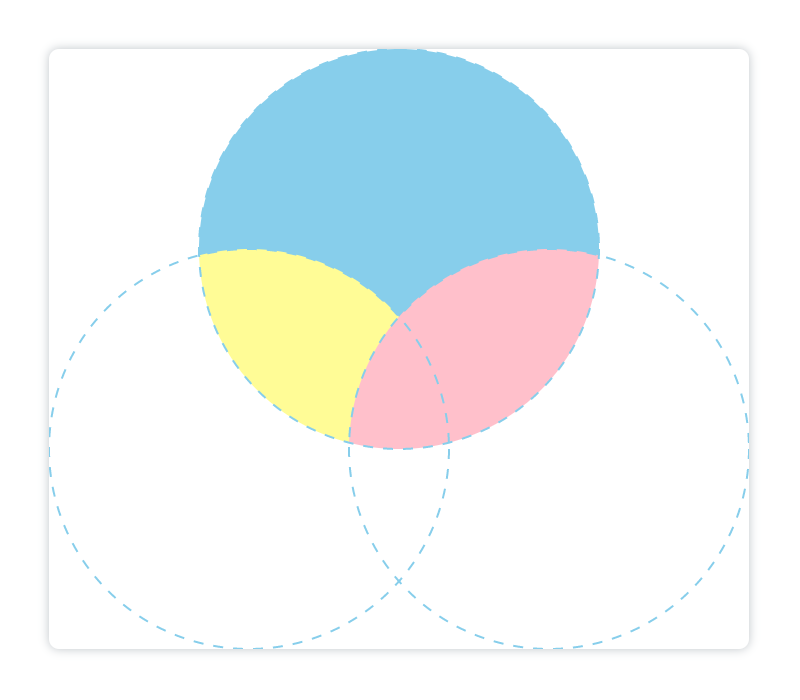
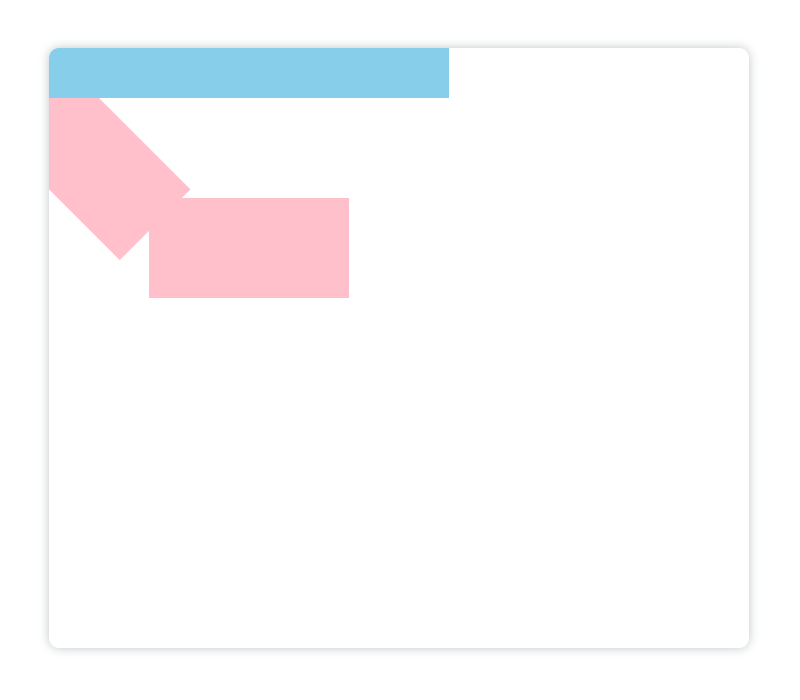
source-out
在已有图像之外显示新图像,只有已有图像之外的新图像部分会显示,已有图像是透明的。
<canvasid="canvas"height="600"width="700"></canvas><script>const canvas = document.getElementById('canvas');const ctx = canvas.getContext('2d');// 第一个天蓝色圆:
    ctx.arc(350,200,200,0,[(Math.PI)/180]*360)
    ctx.fillStyle ='skyblue'
    ctx.globalCompositeOperation ='source-over'
    ctx.fill()// 第二个浅黄色圆:
    ctx.beginPath()
    ctx.arc(200,400,200,0,[(Math.PI)/180]*360)
    ctx.fillStyle ='#fffc96'
    ctx.globalCompositeOperation ='source-out'
    ctx.fill()// 第三个粉色圆:
    ctx.beginPath()
    ctx.arc(500,400,200,0,[(Math.PI)/180]*360)
    ctx.fillStyle ='pink'
    ctx.globalCompositeOperation ='source-out'
    ctx.fill()</script>
蓝色虚线为辅助线,不属于图像:
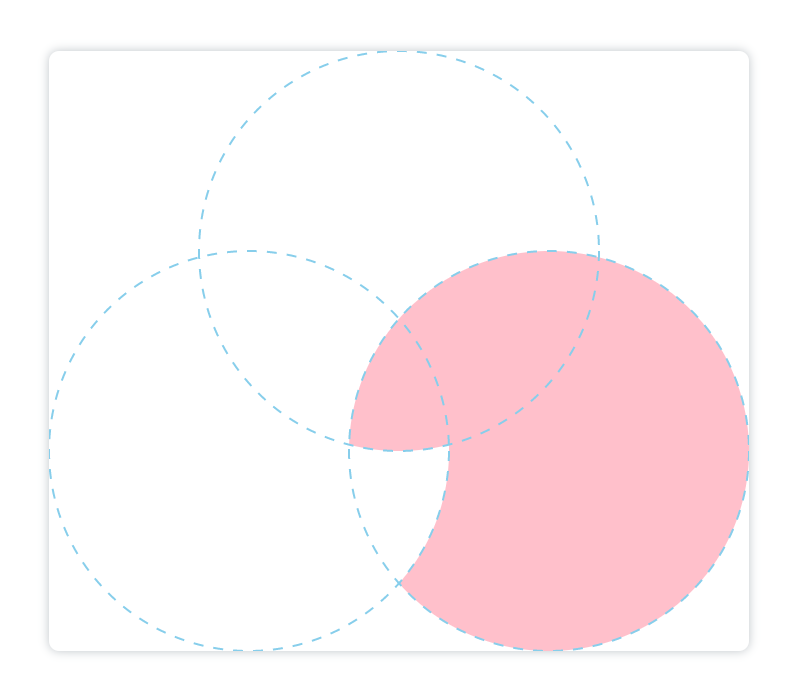
这里解释以下为什么图像呈现出来是这样的:我们在画天蓝色圆的时候,
globaoCompositeOperation
的参数是
source-over
,所以会全部画出来,但是又因为下一个绘制浅黄色圆的参数是
source-out
,所以浅黄色圆只会显示和浅蓝色圆重叠之外的部分,且浅蓝色圆会变透明,继续画第三个粉色圆,粉色圆只会与画出已有浅黄色圆重叠之外的部分,故得到如图所示结果。
source-atop
在已有图像顶部显示新绘制的图像。已有图像位于新绘制图像之外的部分是不可见的。
<canvasid="canvas"height="600"width="700"></canvas><script>const canvas = document.getElementById('canvas');const ctx = canvas.getContext('2d');// 第一个天蓝色圆:
    ctx.arc(350,200,200,0,[(Math.PI)/180]*360)
    ctx.fillStyle ='skyblue'
    ctx.globalCompositeOperation ='source-over'
    ctx.fill()// 第二个浅黄色圆:
    ctx.beginPath()
    ctx.arc(200,400,200,0,[(Math.PI)/180]*360)
    ctx.fillStyle ='#fffc96'
    ctx.globalCompositeOperation ='source-atop'
    ctx.fill()// 第三个粉色圆:
    ctx.beginPath()
    ctx.arc(500,400,200,0,[(Math.PI)/180]*360)
    ctx.fillStyle ='pink'
    ctx.globalCompositeOperation ='source-atop'
    ctx.fill()</script>
蓝色虚线为辅助线:
destination-over
和
source-over
相反,在已有图像之后绘制新图像。
<canvasid="canvas"height="600"width="700"></canvas><script>const canvas = document.getElementById('canvas');const ctx = canvas.getContext('2d');// 第一个天蓝色圆:
    ctx.arc(350,200,200,0,[(Math.PI)/180]*360)
    ctx.fillStyle ='skyblue'
    ctx.globalCompositeOperation ='source-over'
    ctx.fill()// 第二个浅黄色圆:
    ctx.beginPath()
    ctx.arc(200,400,200,0,[(Math.PI)/180]*360)
    ctx.fillStyle ='#fffc96'
    ctx.globalCompositeOperation ='destination-over'
    ctx.fill()// 第三个粉色圆:
    ctx.beginPath()
    ctx.arc(500,400,200,0,[(Math.PI)/180]*360)
    ctx.globalCompositeOperation ='destination-over'
    ctx.fillStyle ='pink'
    ctx.fill()</script>
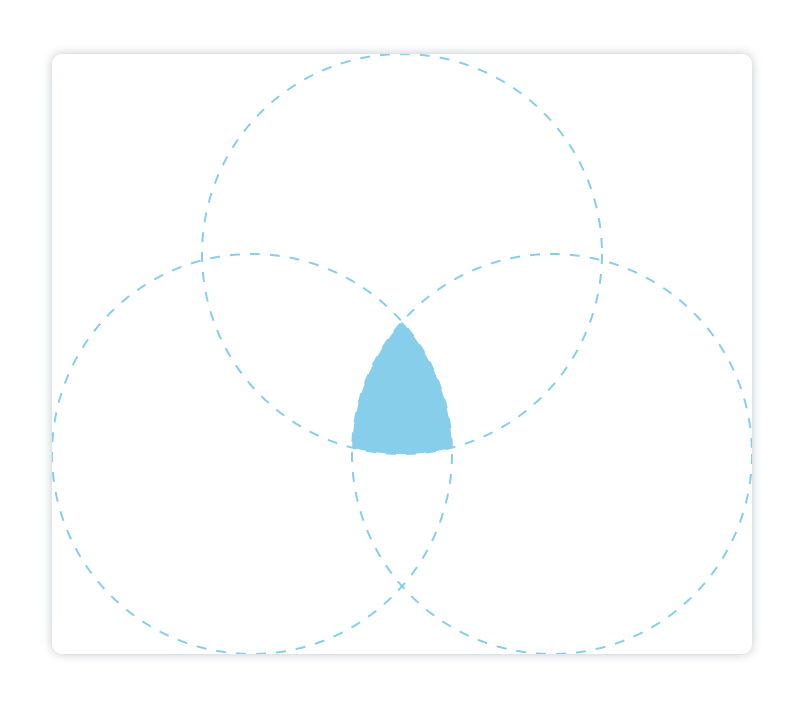
destination-in
和
source-in
类似,但是显示的是最开始的已有图像
<canvasid="canvas"height="600"width="700"></canvas><script>const canvas = document.getElementById('canvas');const ctx = canvas.getContext('2d');// 第一个天蓝色圆:
    ctx.arc(350,200,200,0,[(Math.PI)/180]*360)
    ctx.fillStyle ='skyblue'
    ctx.globalCompositeOperation ='source-over'
    ctx.fill()// 第二个浅黄色圆:
    ctx.beginPath()
    ctx.arc(200,400,200,0,[(Math.PI)/180]*360)
    ctx.fillStyle ='#fffc96'
    ctx.globalCompositeOperation ='destination-in'
    ctx.fill()// 第三个粉色圆:
    ctx.beginPath()
    ctx.arc(500,400,200,0,[(Math.PI)/180]*360)
    ctx.globalCompositeOperation ='destination-in'
    ctx.fillStyle ='pink'
    ctx.fill()</script>
蓝色虚线为辅助线:
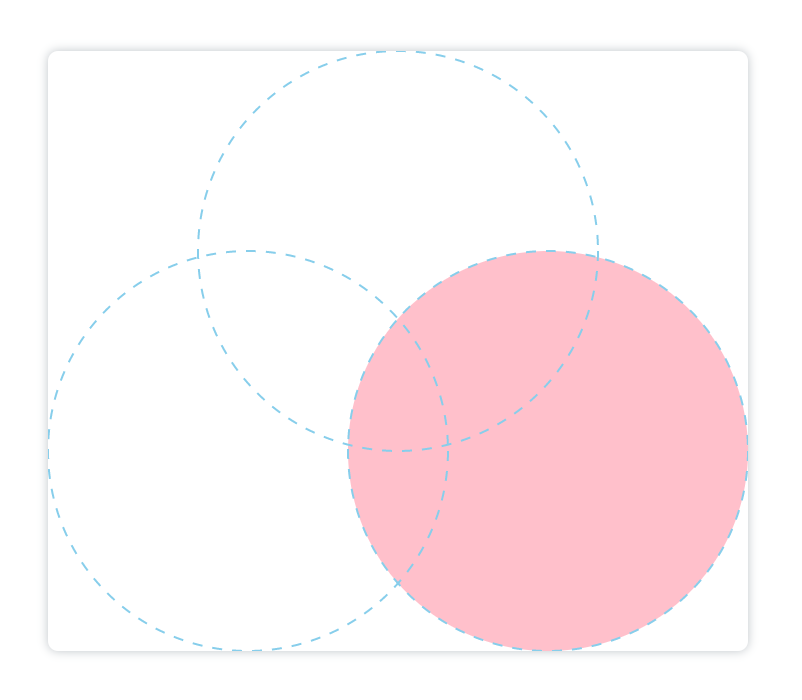
destination-out
在新绘制的图像之外显示已有图像。只有新图像之外的已有图像部分会被显示,新绘制的图像是透明的。
<canvasid="canvas"height="600"width="700"></canvas><script>const canvas = document.getElementById('canvas');const ctx = canvas.getContext('2d');// 第一个天蓝色圆:
    ctx.arc(350,200,200,0,[(Math.PI)/180]*360)
    ctx.fillStyle ='skyblue'
    ctx.globalCompositeOperation ='source-over'
    ctx.fill()// 第二个浅黄色圆:
    ctx.beginPath()
    ctx.arc(200,400,200,0,[(Math.PI)/180]*360)
    ctx.fillStyle ='#fffc96'
    ctx.globalCompositeOperation ='destination-out'
    ctx.fill()// 第三个粉色圆:
    ctx.beginPath()
    ctx.arc(500,400,200,0,[(Math.PI)/180]*360)
    ctx.globalCompositeOperation ='destination-out'
    ctx.fillStyle ='pink'
    ctx.fill()</script>
蓝色虚线为辅助线:

destination-atop
在新绘制图像顶部显示已有图像。已有图像位于新绘制图像之外的部分是不可见的。
<canvasid="canvas"height="600"width="700"></canvas><script>const canvas = document.getElementById('canvas');const ctx = canvas.getContext('2d');// 第一个天蓝色圆:
    ctx.arc(350,200,200,0,[(Math.PI)/180]*360)
    ctx.fillStyle ='skyblue'
    ctx.globalCompositeOperation ='source-over'
    ctx.fill()// 第二个浅黄色圆:
    ctx.beginPath()
    ctx.arc(200,400,200,0,[(Math.PI)/180]*360)
    ctx.fillStyle ='#fffc96'
    ctx.globalCompositeOperation ='destination-atop'
    ctx.fill()// 第三个粉色圆:
    ctx.beginPath()
    ctx.arc(500,400,200,0,[(Math.PI)/180]*360)
    ctx.globalCompositeOperation ='destination-atop'
    ctx.fillStyle ='pink'
    ctx.fill()</script>
蓝色虚线为辅助线:

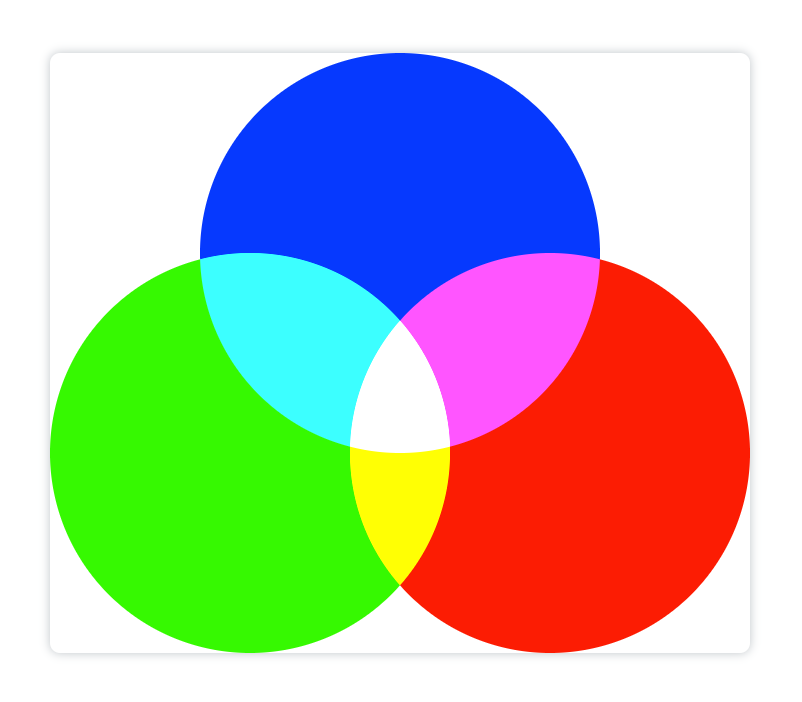
lighter
折叠图像的颜色是有颜色值相加得来的
<canvasid="canvas"height="600"width="700"></canvas><script>const canvas = document.getElementById('canvas');const ctx = canvas.getContext('2d');// 第一个蓝色圆:
    ctx.arc(350,200,200,0,[(Math.PI)/180]*360)
    ctx.fillStyle ='#0639fe'
    ctx.globalCompositeOperation ='source-over'
    ctx.fill()// 第二个绿色圆:
    ctx.beginPath()
    ctx.arc(200,400,200,0,[(Math.PI)/180]*360)
    ctx.fillStyle ='#36f901'
    ctx.globalCompositeOperation ='lighter'
    ctx.fill()// 第三个红色圆:
    ctx.beginPath()
    ctx.arc(500,400,200,0,[(Math.PI)/180]*360)
    ctx.globalCompositeOperation ='lighter'
    ctx.fillStyle ='#fc1c03'
    ctx.fill()</script>
copy
显示新绘制的图像。忽略已有的图像。
<canvasid="canvas"height="600"width="700"></canvas><script>const canvas = document.getElementById('canvas');const ctx = canvas.getContext('2d');// 第一个天蓝色圆:
    ctx.arc(350,200,200,0,[(Math.PI)/180]*360)
    ctx.fillStyle ='skyblue'
    ctx.globalCompositeOperation ='source-over'
    ctx.fill()// 第二个浅黄色圆:
    ctx.beginPath()
    ctx.arc(200,400,200,0,[(Math.PI)/180]*360)
    ctx.fillStyle ='#fffc96'
    ctx.globalCompositeOperation ='copy'
    ctx.fill()// 第三个粉色圆:
    ctx.beginPath()
    ctx.arc(500,400,200,0,[(Math.PI)/180]*360)
    ctx.globalCompositeOperation ='copy'
    ctx.fillStyle ='pink'
    ctx.fill()</script>
蓝色虚线为辅助线:
xor
两个图像重叠之后,二者都变为透明的
<canvasid="canvas"height="600"width="700"></canvas><script>const canvas = document.getElementById('canvas');const ctx = canvas.getContext('2d');// 第一个天蓝色圆:
    ctx.arc(350,200,200,0,[(Math.PI)/180]*360)
    ctx.fillStyle ='skyblue'
    ctx.globalCompositeOperation ='source-over'
    ctx.fill()// 第二个浅黄色圆:
    ctx.beginPath()
    ctx.arc(200,400,200,0,[(Math.PI)/180]*360)
    ctx.fillStyle ='#fffc96'
    ctx.globalCompositeOperation ='xor'
    ctx.fill()// 第三个粉色圆:
    ctx.beginPath()
    ctx.arc(500,400,200,0,[(Math.PI)/180]*360)
    ctx.globalCompositeOperation ='xor'
    ctx.fillStyle ='pink'
    ctx.fill()</script>
解释一下:中间显示粉色是因为蓝色圆与黄色圆重叠之后为透明的了,所以中间部分粉色圆没有和其他图形重叠了。
保存和还原绘画状态
通过
save()
方法可以保存当前绘画的状态,并通过
restore()
方法还原之前保存的状态。保存和还原可以多次调用。
示例:
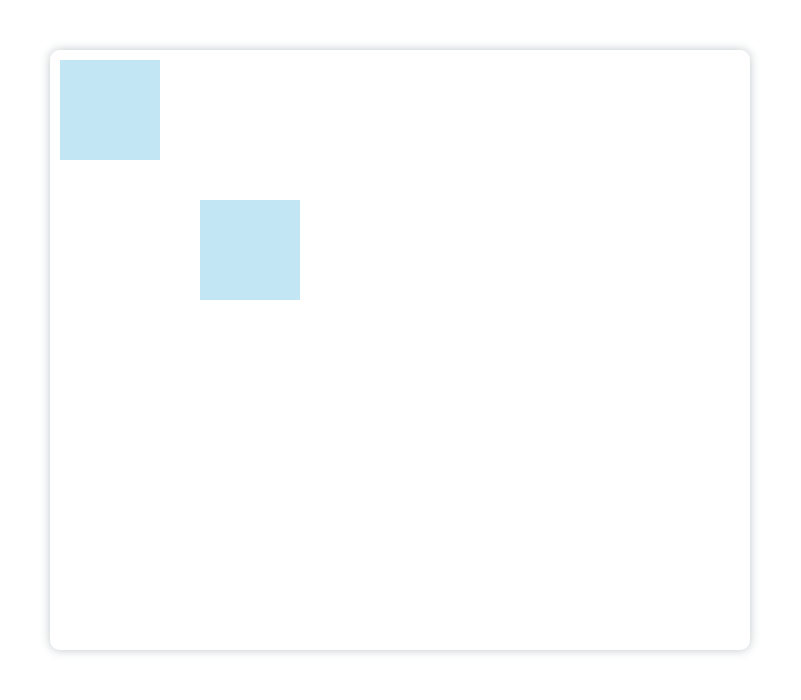
在之前讲过,如果我们这样画出来两个矩形,那么这两个矩形的颜色都将是天蓝色,透明度50%,
<canvasid="canvas"height="600"width="700"></canvas><script>var canvas = document.getElementById('canvas');var ctx = canvas.getContext('2d');
    ctx.fillStyle ='skyblue'
    ctx.globalAlpha =0.5
    ctx.fillRect(10,10,100,100)
    ctx.fillRect(150,150,100,100)</script>
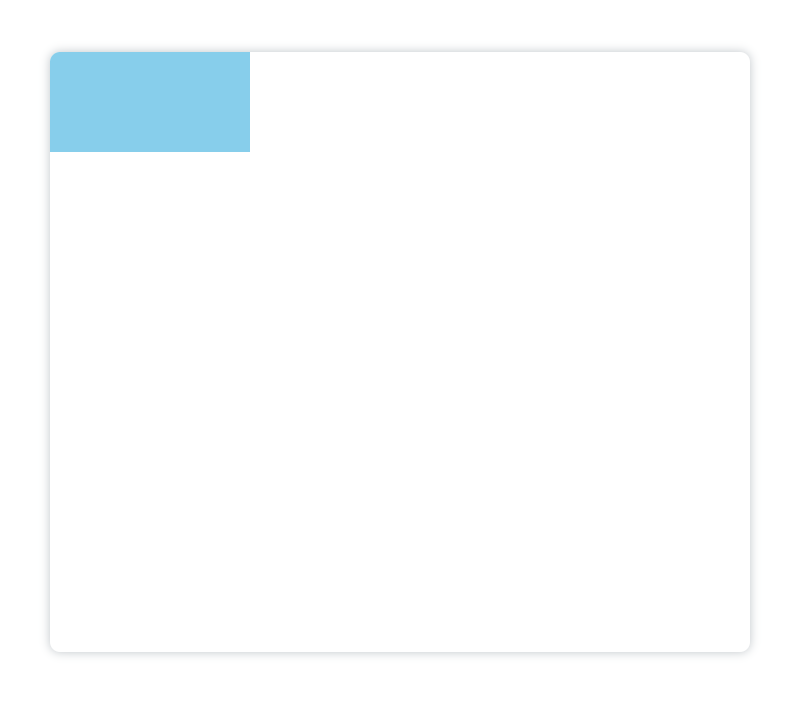
而如果在设置
storeStyle = 'skyblue'
之前保存状态,并在绘制第二个矩形之前还原状态,第二个矩形绘制的就会是黑色:
<canvasid="canvas"height="600"width="700"></canvas><script>var canvas = document.getElementById('canvas');var ctx = canvas.getContext('2d');
    ctx.save()// 保存绘画状态
    ctx.fillStyle ='skyblue'
    ctx.globalAlpha =0.5
    ctx.fillRect(10,10,100,100)
    ctx.restore()// 还原状态
    ctx.fillRect(150,150,100,100)</script>

Canvas的状态是存储在栈中的,每次调用
save()
方法后,当前的状态都会被推送到栈中保存起来。绘画状态包含:
strokeStyle
fillStyle
globalAlpha
lineWidth
lineCap
lineJoin
miterLimit
lineDashOffset
shadowOffsetX
shadowOffsetY
shadowBlur
shadowColor
globalCompositeOperation
font
textAlign
textBaseline
direction
imageSmoothingEnabled
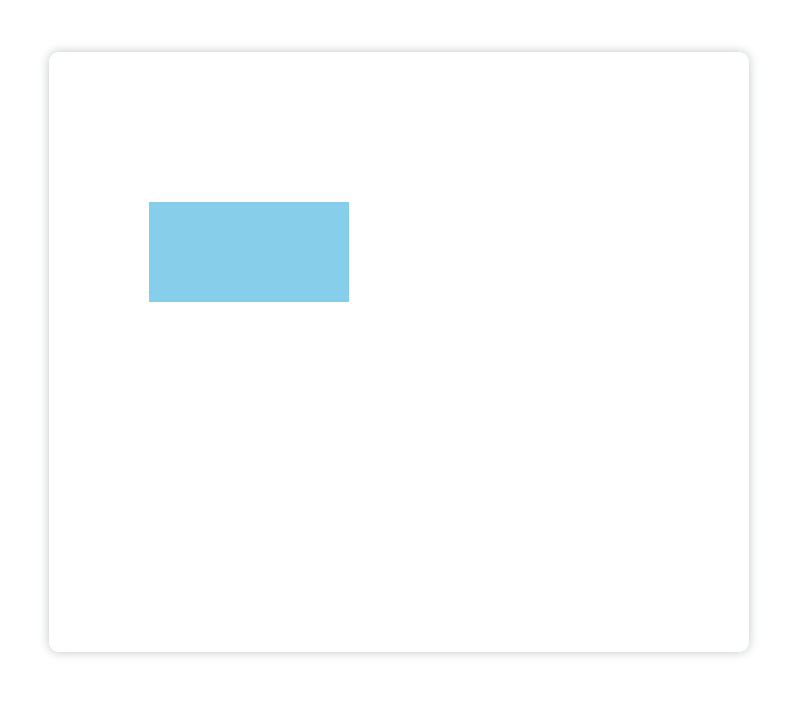
变形
我们现在有一个基础图形,要在其基础上进行移动原点、旋转、缩放的效果:
<canvasid="canvas"height="600"width="700"></canvas><script>var canvas = document.getElementById('canvas');var ctx = canvas.getContext('2d');
    ctx.fillStyle ='skyblue';
    ctx.fillRect(0,0,200,100);</script>
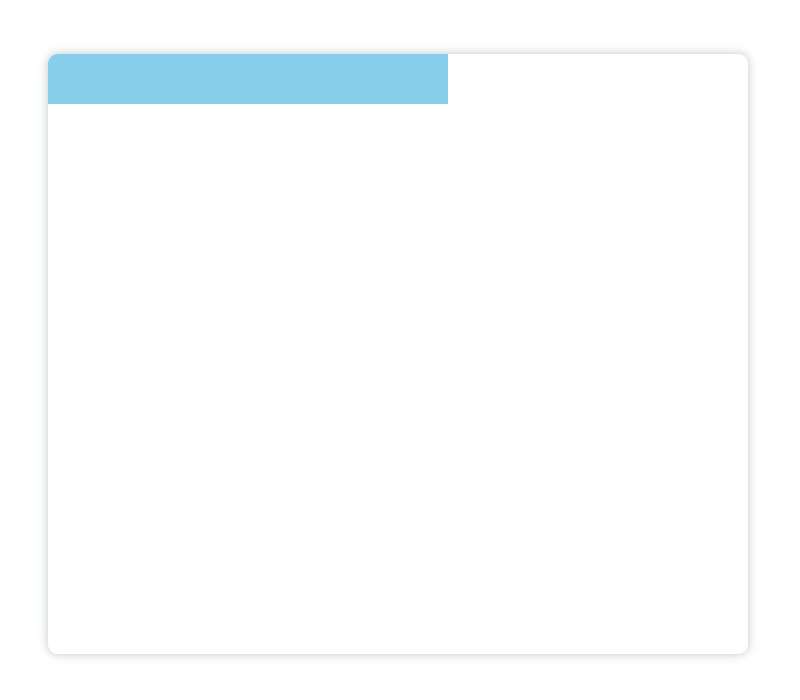
移动原点位置
使用
translate(x, y)
方法接收两个参数向x轴和y轴正方向分别移动x、y像素:
<canvasid="canvas"height="600"width="700"></canvas><script>var canvas = document.getElementById('canvas');var ctx = canvas.getContext('2d');
    ctx.fillStyle ='skyblue';
    ctx.translate(100,150);// 向x轴正方向移动了100像素,y轴正方向移动了150像素
    ctx.fillRect(0,0,200,100);</script>
蓝色矩形的绘制坐标还是(0,0)点,但是在此之前移动了原点位置,所以视觉上矩形的位置是在(100,150)处绘制的。
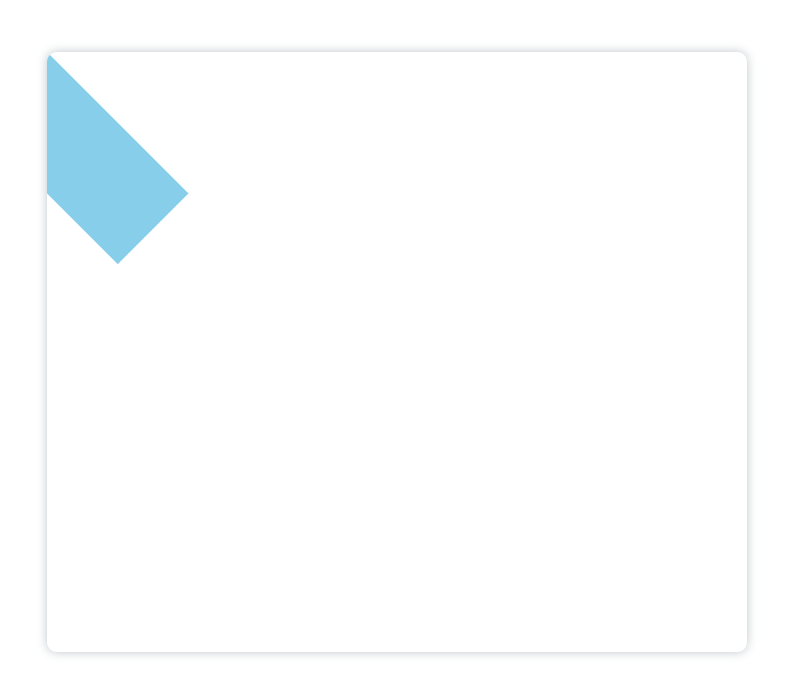
旋转
使用
rotate(angle)
方法以此时的画布原点为中心,顺时针旋转angle度。继续以上边的矩形为例,以(0,0)点为中心旋转45°:
<canvasid="canvas"height="600"width="700"></canvas><script>var canvas = document.getElementById('canvas');var ctx = canvas.getContext('2d');
    ctx.fillStyle ='skyblue';
    ctx.rotate(Math.PI/4)// 矩形以canvas的原点为中心(此时的原点为(0,0)),旋转了45°
    ctx.fillRect(0,0,200,100);</script>
缩放
使用
scale(x, y)
方法可以缩放图形。

在基础矩形的上做缩放:
<canvasid="canvas"height="600"width="700"></canvas><script>var canvas = document.getElementById('canvas');var ctx = canvas.getContext('2d');
    ctx.fillStyle ='skyblue';
    ctx.scale(2,0.5)// x轴上放大2倍,y轴方向上缩小到之前的0.5倍
    ctx.fillRect(0,0,200,100);</script>
如果想要同时绘制这三种效果到一张画布上,那么就需要用到
save()
和
restore()
方法:
<canvasid="canvas"height="600"width="700"></canvas><script>var canvas = document.getElementById('canvas');var ctx = canvas.getContext('2d');
    ctx.fillStyle ='skyblue';
    ctx.save()// 保存状态
    ctx.save()// 保存状态
    ctx.translate(100,150);// 向x轴正方向移动了100像素,y轴正方向移动了150像素
    ctx.fillRect(0,0,200,100);
    ctx.restore()// 还原状态
    ctx.rotate(Math.PI/4)// 矩形以canvas的原点为中心(此时的原点为(100,150)),旋转了45°
    ctx.fillRect(0,0,200,100);
    ctx.restore()// 还原状态
    ctx.scale(2,0.5)// x轴上放大2倍,y轴方向上缩小到之前的0.5倍
    ctx.fillRect(0,0,200,100);</script>
说明:
save()
保存的状态是可以多次保存的,同时保存在栈中的元素遵循的是后进先出的顺序,验证:
<canvasid="canvas"height="600"width="700"></canvas><script>var canvas = document.getElementById('canvas');var ctx = canvas.getContext('2d');
    ctx.fillStyle ='skyblue';
    ctx.save()// 保存状态1
    ctx.fillStyle ='pink'
    ctx.save()// 保存状态2
    ctx.translate(100,150);// 向x轴正方向移动了100像素,y轴正方向移动了150像素
    ctx.fillRect(0,0,200,100);
    ctx.restore()// 还原状态2
    ctx.rotate(Math.PI/4)// 矩形以canvas的原点为中心(此时的原点为(100,150)),旋转了45°
    ctx.fillRect(0,0,200,100);
    ctx.restore()// 还原状态1
    ctx.scale(2,0.5)// x轴上放大2倍,y轴方向上缩小到之前的0.5倍
    ctx.fillRect(0,0,200,100);</script>
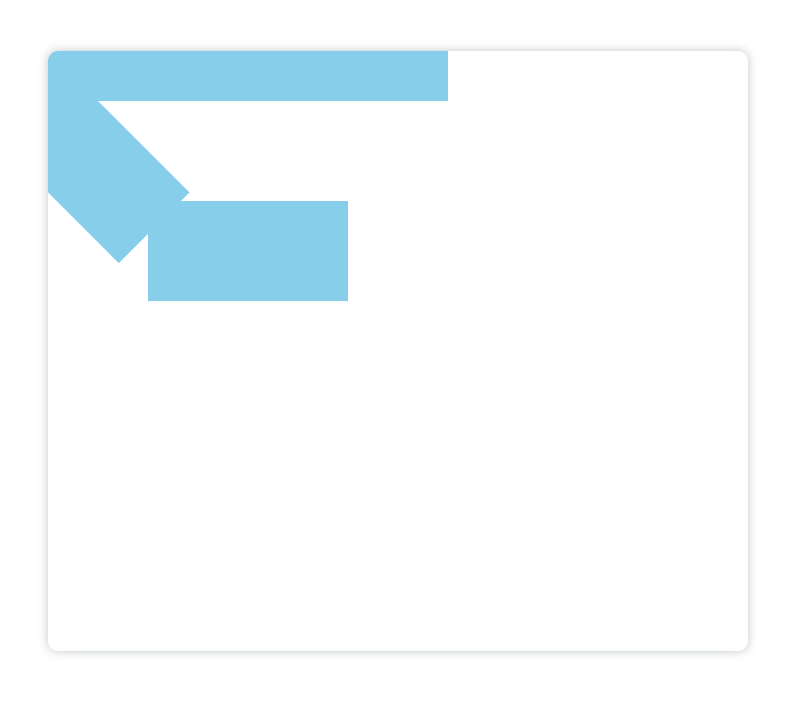
在上边的代码中,我在两个
save()
中间加了一个修改填充颜色为
pink
的代码,观察下图中更改颜色的矩形方块是哪几个:
可以看到,更改颜色的是旋转和移动原点坐标的两个矩形,而缩放的矩形颜色并未修改,所以第二个
save()
保存的状态应用到了第一个
restore()
上,故验证了
save()
在栈中保存的元素遵循的是后进先出的顺序。
裁剪
使用
clip()
方法从原始画布中剪切任意形状和尺寸。注意:一旦剪切了某个区域,则所有之后的绘图都会被限制在被剪切的区域内(不能访问画布上的其他区域),你也可以在使用
clip()
方法前通过使用
save()
方法对当前画布区域进行保存,并在以后的任意时间对其进行恢复(通过
restore()
方法)
<canvasid="canvas"height="600"width="700"></canvas><script>const canvas = document.getElementById('canvas');const ctx = canvas.getContext('2d');// 第一个天蓝色圆:
    ctx.arc(350,200,200,0,[(Math.PI)/180]*360)
    ctx.fillStyle ='skyblue'
    ctx.globalCompositeOperation ='source-over'
    ctx.fill()// 裁剪:
    ctx.beginPath()
    ctx.arc(350,300,200,0,[(Math.PI)/180]*360)
    ctx.clip()// 第二个浅黄色圆:
    ctx.beginPath()
    ctx.arc(200,400,200,0,[(Math.PI)/180]*360)
    ctx.fillStyle ='#fffc96'
    ctx.fill()// 第三个粉色圆:
    ctx.beginPath()
    ctx.arc(500,400,200,0,[(Math.PI)/180]*360)
    ctx.fillStyle ='pink'
    ctx.fill()</script>
蓝色虚线为辅助线,不属于图像:
清除
使用
clearRect()
方法清空给定矩形内的指定像素:

例如:
<canvasid="canvas"height="600"width="700">您的浏览器不支持canvas!</canvas><buttonid="clear">清除画布</button><script>const canvas = document.getElementById('canvas')const clear = document.getElementById('clear')const ctx = canvas.getContext('2d')// 绘制文本:const gradient = ctx.createRadialGradient(350,300,100,350,300,500)
    gradient.addColorStop(1,'yellow')
    gradient.addColorStop(0,'skyblue')
    ctx.font ='80px Verdana'
    ctx.textAlign ='center'
    ctx.strokeStyle = gradient
    ctx.lineWidth =3.5
    ctx.strokeText('HTML5画布Canvas',350,300,700)
    ctx.lineWidth =2
    ctx.font ='40px Verdana'
    ctx.strokeText('----入门必备!',580,450,700)// 设置清除按钮:
    clear.onclick=()=>{
        ctx.clearRect(0,0,700,600)// 清除以(0,0)为起始点,宽700,高600的矩形里的内容
        ctx.beginPath()}</script>
动画
动画的绘制其实就是在上文基础图形绘制和对画布状态的保存与恢复,再加上一些js内置的方法(比如
setInterval()
、
setTimeout()
、
requestAnimationFrame()
…)的基础上,不断地进行画布的绘制和清除来实现的。因为本文的篇幅已经够长了(我是使用Markdown文档编辑的,到现在已经有了9700词)所以我打算下一期再介绍用canvas绘制动画。
在下一期我会绘制几个动画,并且详细介绍实现原理,敬请期待!
.
以上为潘潘自己总结的canvas入门教程的全部内容。欢迎转载~ 转载请注明出处~
关于canvas的动画绘制案例和思路讲解,关注公众号: 学编程的GISer(微信号dapancoder)获取⬇:
版权归原作者 学编程的GISer 所有, 如有侵权,请联系我们删除。