
文章目录
本实验采用Python语言,从网页爬取气象数据,并使用大数据处理框架Spark对气象数据进行处理分析,并对分析结果进行可视化。
一、实验环境
(1)Linux: Ubuntu 20.04
(2)Python: 3.6
(3)Spark: 3.2.0
(4)pycharm
安装完上述环境以后,为了支持Python可视化分析,还需要执行如下命令安装新的组件:
二、实验数据介绍
本次实验所采用的数据,从中央气象台官方网站(网址:http://www.nmc.cn/)爬取,主要是最近24小时各个城市的天气数据,包括时间点(整点)、整点气温、整点降水量、风力、整点气压、相对湿度等。正常情况下,每个城市会对应24条数据(每个整点一条)。数据规模达到2429个城市,58297条数据,有部分城市部分时间点数据存在缺失或异常。限于本次大作业时间有限,没有办法全面分析这些数据,大作业中主要计算分析了各个城市过去24小时的平均气温和降水量情况。
图 1 中央气象台官网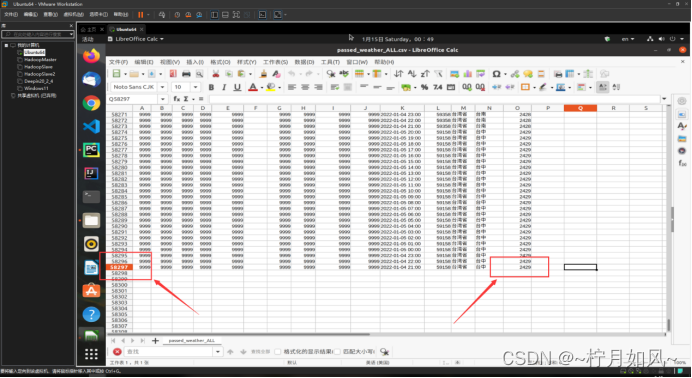
图 2 爬取的表格passed_weather_ALL.csv信息
三、数据获取
1.观察数据获取方式
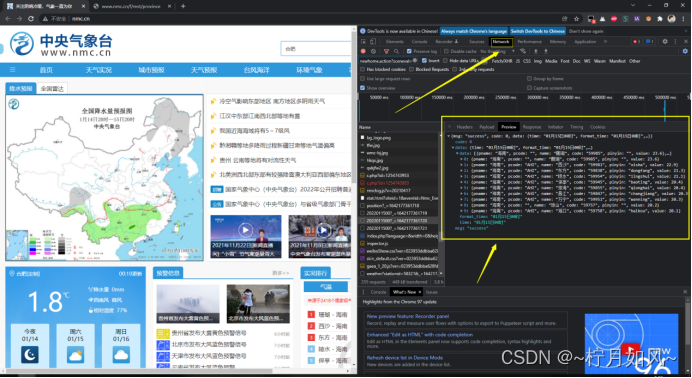
请求URL 传回数据
http://www.nmc.cn/f/rest/province 省份数据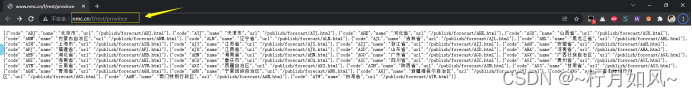
http://www.nmc.cn/f/rest/province/+省份三位编码 某个省份的城市数据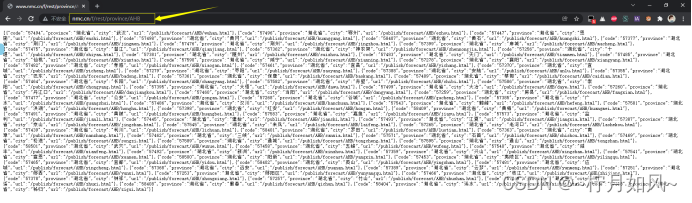
http://www.nmc.cn/f/rest/passed/+城市编号 某个城市最近24小时整点天气数据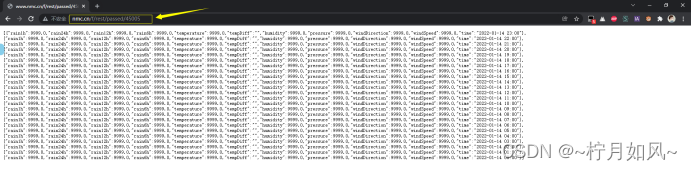
由于省份三位编码(如福建省编码为“ABJ”)需要从省份数据获得中获得,城市编号需要从城市数据获得(如福州市编号为“58847”),所以为了获得各个城市最近24小时整点天气数据,依次爬取省份数据、城市数据、最近24小时整点数据。
2.数据爬取
由于可以直接通过访问请求URL,传回的响应的数据部分即是json格式的数据,所以只需要调用python的urllib.request, urllib.error, urllib.parse库中相关函数,对上述URL进行请求即可。不需要像平常爬取HTML网页时还需要对网页源码进行解析,查找相关数据。唯一需要注意的是,有些城市可能不存在或者全部缺失最近24小时整点数据,需要进行过滤,以免出错。
3.数据存储
虽然上一步获取的json数据可以直接存储并可使用SparkSession直接读取,但是为了方便观察数据结构、辨识异常数据、对数据增加部分提示信息,爬取后的数据进行了一些处理之后,保存成了csv格式,包括省份数据(province.csv)、城市数据(city.csv)、各个城市最近24小时整点天气数据(passed_weather_ALL.csv)。由于所有城市过去24小时整点天气数据数量太多,为了避免内存不足,每爬取50个城市的数据后,就会进行一次保存。
4.数据读取
因为各个城市最近24小时整点天气数据体量较大,每次爬取需要半小时以上,为了提高实验效率,只会进行一次数据爬取。此后会直接读取第一次实验数据。如果需要重新爬取数据,需要手动删除已有数据,即删除input文件夹下province.csv、city.csv、passed_weather_ALL.csv。
5.数据结构
最后保存的各个城市最近24小时整点天气数据(passed_weather_ALL.csv)每条数据各字段含义如下所示,这里仅列出实验中使用部分。
字段 含义
province 城市所在省份(中文)
city_index 城市序号(计数)
city_name 城市名称(中文)
city_code 城市编号
time 时间点(整点)
temperature 气温
rain1h 过去1小时降雨量
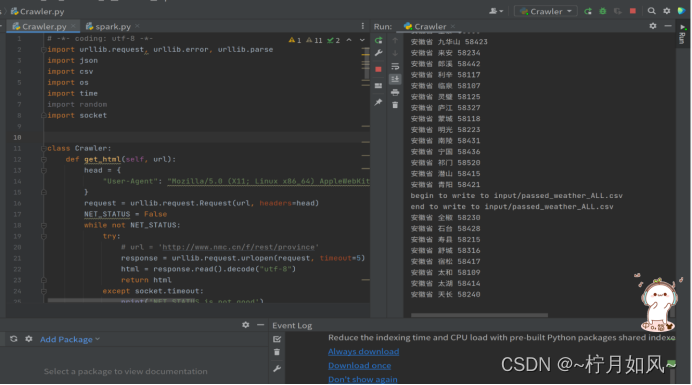
6.爬虫过程截图
开始爬虫
运行中的截图:
爬取完毕: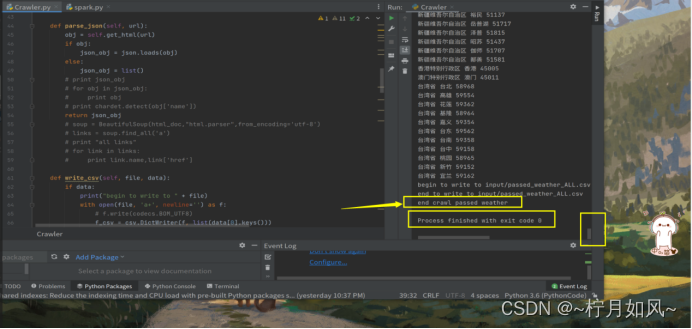
四、数据分析
数据分析主要使用Spark SQL相关知识与技术,对各个城市过去24小时累积降雨量和当日平均气温进行了计算和排序。
1.计算各个城市过去24小时累积雨量
思路:按照城市对数据进行分组,对每个城市的rain1h字段进行分组求和。
特别说明:由于获取数据所需时间较长,天气数据的时间跨度可能略有不一致,这里为了简化操作没有筛选出具有相同时间跨度的数据再进行计算。
相关步骤如下:
(1)创建SparkSession对象spark;
(2)使用spark.read.csv(filename)读取passed_weather_ALL.csv数据生成Dateframe df;
(3)对df进行操作:使用Dateframe的select方法选择province,city_name,city_code,rain1h字段,并使用Column对象的cast(dateType)方法将rain1h转成数值型,再使用Dateframe的filter方法筛选出rain1h小于1000的记录(大于1000是异常数据),得到新的Dateframe df_rain;
(4)对df_rain进行操作:使用Dateframe的groupBy操作按照province,city_name,city_code的字段分组,使用agg方法对rain1h字段进行分组求和得到新的字段rain24h(过去24小时累积雨量),使用sort方法按照rain24h降序排列,经过上述操作得到新的Dateframe df_rain_sum
(5)对df_rain_sum调用cache()方法将此前的转换关系进行缓存,提高性能
(6)对df_rain_sum调用coalesce()将数据分区数目减为1,并使用write.csv(filename)方法将得到的数据持久化到本地文件。
(7)对df_rain_sum调用head()方法取前若干条数据(即24小时累积降水量Top-N的列表)供数据可视化使用。
本部分分析对应的具体代码如下:
defpassed_rain_analyse(filename):# 计算各个城市过去24小时累积雨量print("begin to analyse passed rain")
    spark = SparkSession.builder.master("local").appName("passed_rain_analyse").getOrCreate()
    df = spark.read.csv(filename, header=True)
    df_rain = df.select(df['province'], df['city_name'], df['city_code'], df['rain1h'].cast(DecimalType(scale=1))) \
        .filter(df['rain1h']<1000)# 筛选数据,去除无效数据
    df_rain_sum = df_rain.groupBy("province","city_name","city_code") \
        .agg(F.sum("rain1h").alias("rain24h")) \
        .sort(F.desc("rain24h"))# 分组、求和、排序
    df_rain_sum.cache()
    df_rain_sum.coalesce(1).write.csv("file:///home/hadoop/PythonCode/SparkAnalysis/passed_rain_analyse.csv")print("end analysing passed rain")return df_rain_sum.head(20)
2.计算各个城市当日平均气温
思路:根据国家标准(《地面气象服务观测规范》),日平均气温取四时次数据的平均值,四时次数据为:02时、08时、14时、20时。据此,应该先筛选出各个时次的气温数据,再按照城市对数据进行分组,对每个城市的tempeature字段进行分组求平均。
特别说明:为了能获取到上述一天的四个时次的天气数据,建议在当天的20时30分后再爬取数据。
相关步骤如下:
(1)创建SparkSession对象spark;
(2)使用spark.read.csv(filename)读取passed_weather_ALL.csv数据生成Dateframe df;
(3)对df进行操作:使用Dateframe的select方法选择province,city_name,city_code,temperature字段,并使用库pyspark.sql.functions中的date_format(col,pattern)方法和hour(col)将time字段转换成date(日期)字段和hour(小时)字段,(time字段的分秒信息无用),,得到新的Dateframe df_temperature;
(4)对df_temperature进行操作:使用Dateframe的filter操作过滤出hour字段在[2,8,14,20]中的记录,经过上述操作得到新的Dateframe df_4point_temperature
(5)对df_4point_temperature进行操作:使用Dateframe的groupBy操作按照province,city_name,city_code,date字段分组,使用agg方法对temperature字段进行分组计数和求和(求和字段命名为avg_temperature),使用filter方法过滤出分组计数为4的记录(确保有4个时次才能计算日平均温),使用sort方法按照avg_temperature降序排列,再筛选出需要保存的字段province,city_name,city_code,date,avg_temperature(顺便使用库pyspark.sql.functions中的format_number(col,precision)方法保留一位小数),经过上述操作得到新的Dateframe df_avg_temperature
(6)对df_avg_temperature调用cache()方法将此前的转换关系进行缓存,提高性能
(7)对df_avg_temperature调用coalesce()将数据分区数目减为1,并使用write.json(filename)方法将得到的数据持久化到本地文件。
(8)对df_rain_sum调用collect()方法取将Dateframe转换成list,方便后续进行数据可视化。
本部分分析对应的具体代码如下:
defpassed_temperature_analyse(filename):print("begin to analyse passed temperature")
    spark = SparkSession.builder.master("local").appName("passed_temperature_analyse").getOrCreate()
    df = spark.read.csv(filename, header=True)
    df_temperature = df.select(# 选择需要的列
        df['province'],
        df['city_name'],
        df['city_code'],
        df['temperature'].cast(DecimalType(scale=1)),
        F.date_format(df['time'],"yyyy-MM-dd").alias("date"),# 得到日期数据
        F.hour(df['time']).alias("hour")# 得到小时数据)# 筛选四点时次
    df_4point_temperature = df_temperature.filter(df_temperature['hour'].isin([2,8,12,20]))# df_4point_temperature.printSchema()
    df_avg_temperature = df_4point_temperature.groupBy("province","city_name","city_code","date") \
        .agg(F.count("temperature"), F.avg("temperature").alias("avg_temperature")) \
        .filter("count(temperature) = 4") \
        .sort(F.asc("avg_temperature")) \
        .select("province","city_name","city_code","date",
                F.format_number('avg_temperature',1).alias("avg_temperature"))
    df_avg_temperature.cache()
    avg_temperature_list = df_avg_temperature.collect()
    df_avg_temperature.coalesce(1).write.json("file:///home/hadoop/PythonCode/SparkAnalysis/passed_temperature_analyse.json")print("end analysing passed temperature")return avg_temperature_list[0:10]
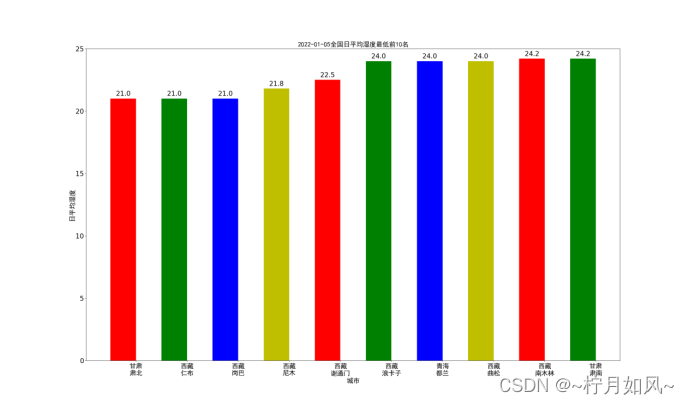
3.计算各个城市当日平均湿度
具体步骤与计算计算各个城市当日平均气温类似;
代码:
defpassed_humidity_analyse(filename):print("begin to analyse passed humidity")
    spark = SparkSession.builder.master("local").appName("passed_humidity_analyse").getOrCreate()
    df = spark.read.csv(filename, header=True)
    df_humidity = df.select(# 选择需要的列
        df['province'],
        df['city_name'],
        df['city_code'],
        df['humidity'].cast(DecimalType(scale=1)),
        F.date_format(df['time'],"yyyy-MM-dd").alias("date"),# 得到日期数据
        F.hour(df['time']).alias("hour")# 得到小时数据)# 筛选四点时次
    df_4point_humidity = df_humidity.filter(df_humidity['hour'].isin([2,8,12,20]))# df_4point_humidity.printSchema()
    df_avg_humidity = df_4point_humidity.groupBy("province","city_name","city_code","date") \
        .agg(F.count("humidity"), F.avg("humidity").alias("avg_humidity")) \
        .filter("count(humidity) = 4") \
        .sort(F.asc("avg_humidity")) \
        .select("province","city_name","city_code","date",
                F.format_number('avg_humidity',1).alias("avg_humidity"))
    df_avg_humidity.cache()
    avg_humidity_list = df_avg_humidity.collect()
    df_avg_humidity.coalesce(1).write.json("file:///home/hadoop/PythonCode/SparkAnalysis/passed_humidity_analyse.json")print("end analysing passed analyse")return avg_humidity_list[0:10]
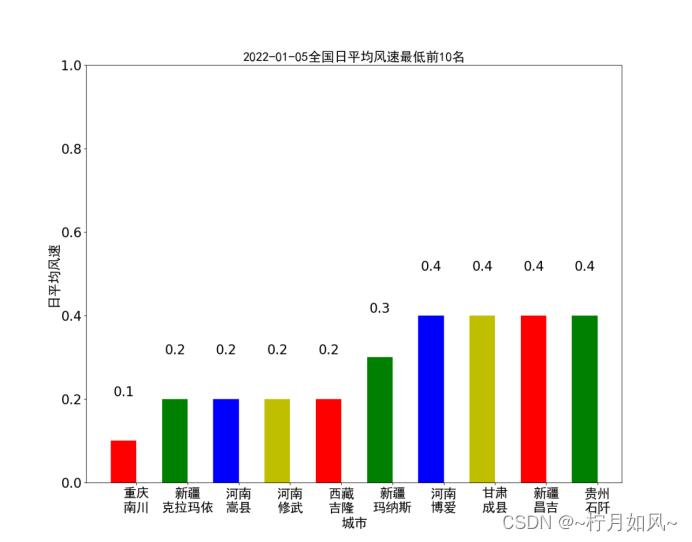
4.计算各个城市当日平均风速
具体步骤与计算计算各个城市当日平均气温类似;
代码:
defpassed_windSpeed_analyse(filename):print("begin to analyse passed windSpeed")
    spark = SparkSession.builder.master("local").appName("passed_windSpeed_analyse").getOrCreate()
    df = spark.read.csv(filename, header=True)
    df_windSpeed = df.select(# 选择需要的列
        df['province'],
        df['city_name'],
        df['city_code'],
        df['windSpeed'].cast(DecimalType(scale=1)),
        F.date_format(df['time'],"yyyy-MM-dd").alias("date"),# 得到日期数据
        F.hour(df['time']).alias("hour")# 得到小时数据)# 筛选四点时次
    df_4point_windSpeed = df_windSpeed.filter(df_windSpeed['hour'].isin([2,8,12,20]))# df_4point_windSpeed.printSchema()
    df_avg_windSpeed = df_4point_windSpeed.groupBy("province","city_name","city_code","date") \
        .agg(F.count("windSpeed"), F.avg("windSpeed").alias("avg_windSpeed")) \
        .filter("count(windSpeed) = 4") \
        .sort(F.asc("avg_windSpeed")) \
        .select("province","city_name","city_code","date",
                F.format_number('avg_windSpeed',1).alias("avg_windSpeed"))
    df_avg_windSpeed.cache()
    avg_windSpeed_list = df_avg_windSpeed.collect()
    df_avg_windSpeed.coalesce(1).write.json("file:///home/hadoop/PythonCode/SparkAnalysis/passed_windSpeed_analyse.json")print("end analysing passed windSpeed")return avg_windSpeed_list[0:10]
五、数据可视化
数据可视化使用python matplotlib库。可使用pip命令安装。也可以pycharm直接安装。
绘制过程大体如下:
第一步,应当设置字体,这里提供了黑体的字体文件simhei.tff。否则坐标轴等出现中文的地方是乱码。
第二步,设置数据(累积雨量或者日平均气温)和横轴坐标(城市名称),配置直方图。
第三步,配置横轴坐标位置,设置纵轴坐标范围
第四步,配置横纵坐标标签
第五步,配置每个条形图上方显示的数据
第六步,根据上述配置,画出直方图。
画图部分对应的运行截图如下: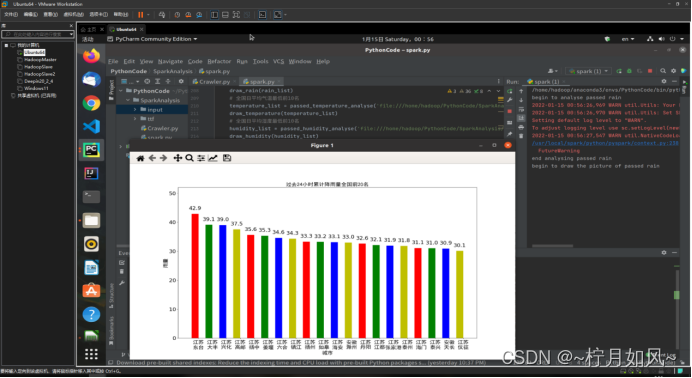
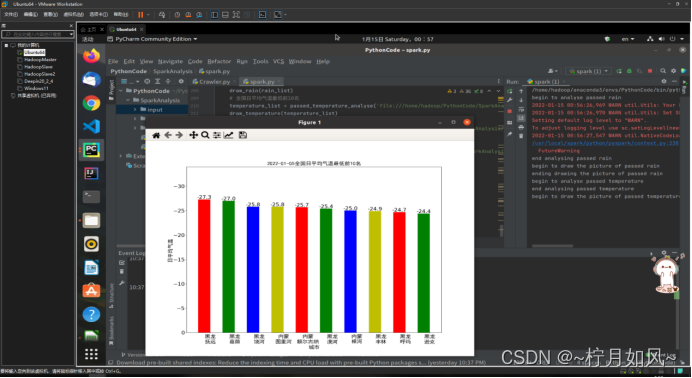
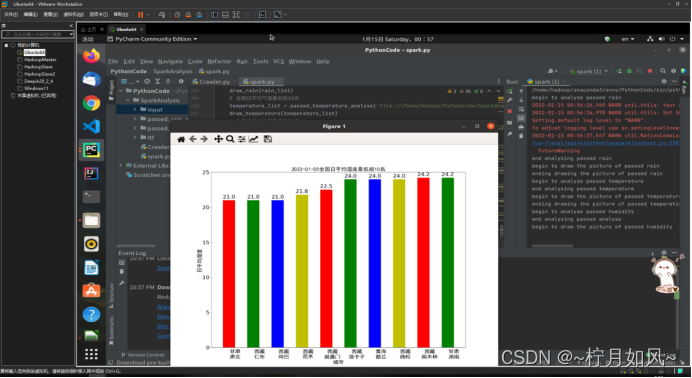

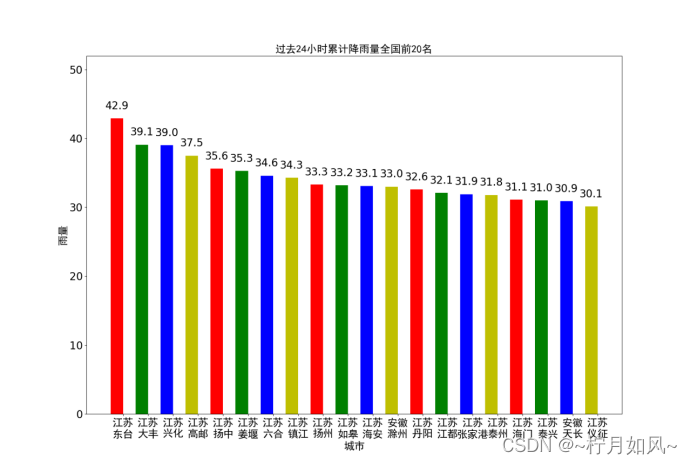
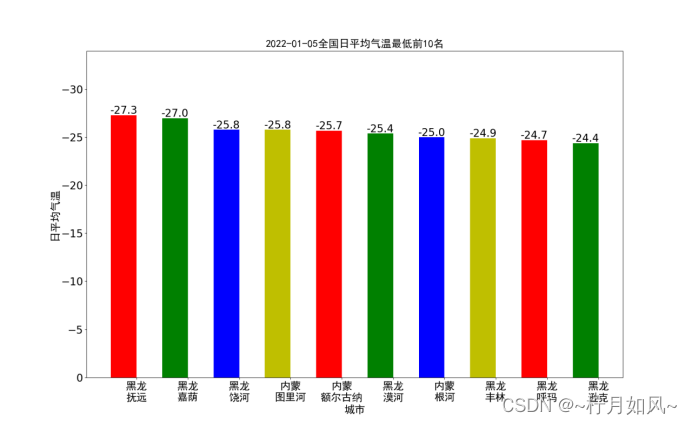
保存的matplotlib作的图:
六、数据以及源代码
1.爬取的数据截图:
city.csv
passed_weather_ALL.csv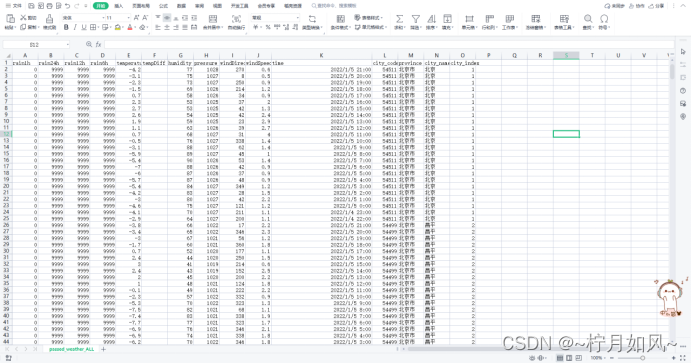
province.csv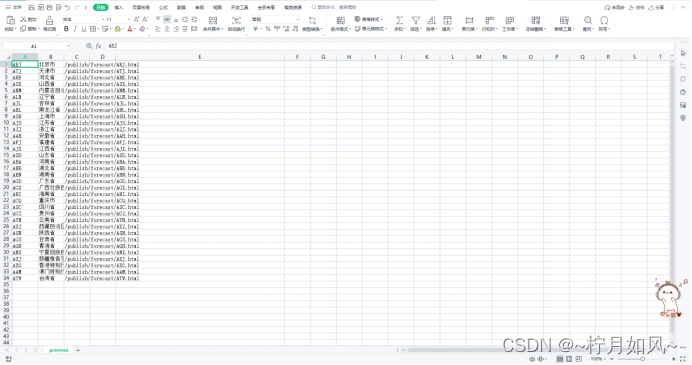
2.爬虫代码
# -*- coding: utf-8 -*-import urllib.request, urllib.error, urllib.parse
import json
import csv
import os
import time
import random
import socket

classCrawler:defget_html(self, url):
        head ={"User-Agent":"Mozilla/5.0 (X11; Linux x86_64) AppleWebKit/537.36 (KHTML, like Gecko) Chrome/96.0.4664.110 Safari/537.36"}
        request = urllib.request.Request(url, headers=head)
        NET_STATUS =Falsewhilenot NET_STATUS:try:# url = 'http://www.nmc.cn/f/rest/province'
                response = urllib.request.urlopen(request, timeout=5)
                html = response.read().decode("utf-8")return html
            except socket.timeout:print('NET_STATUS is not good')
                NET_STATUS =False# def get_html(self, url):  # 得到指定一个URL的网页内容#     head = {#         "User-Agent": "Mozilla/5.0(Windows NT 10.0;Win64;x64) AppleWebKit/537.36(KHTML, likeGecko) Chrome / 89.0.4389.90Safari / 537.36"#     }#     request = urllib.request.Request(url, headers=head)#     try:#         response = urllib.request.urlopen(request, timeout=5)#         html = response.read().decode("utf-8")#         # print(html)#     except urllib.error.URLError as e:#         if hasattr(e, "code"):#             print(e.code)#         if hasattr(e, "reason"):#             print(e.reason)#     return htmldefparse_json(self, url):
        obj = self.get_html(url)if obj:
            json_obj = json.loads(obj)else:
            json_obj =list()# print json_obj# for obj in json_obj:#     print obj# print chardet.detect(obj['name'])return json_obj
        # soup = BeautifulSoup(html_doc,"html.parser",from_encoding='utf-8')# links = soup.find_all('a')# print "all links"# for link in links:#     print link.name,link['href']defwrite_csv(self,file, data):if data:print("begin to write to "+file)withopen(file,'a+', newline='')as f:# f.write(codecs.BOM_UTF8)
                f_csv = csv.DictWriter(f,list(data[0].keys()))ifnot os.path.exists(file):
                    f_csv.writeheader()
                f_csv.writerows(data)# writerows()将一个二维列表中的每一个列表写为一行。print("end to write to "+file)defwrite_header(self,file, data):if data:print("begin to write to "+file)withopen(file,'a+', newline='')as f:# f.write(codecs.BOM_UTF8)
                f_csv = csv.DictWriter(f,list(data[0].keys()))
                f_csv.writeheader()
                f_csv.writerows(data)print("end to write to "+file)defwrite_row(self,file, data):if data:print("begin to write to "+file)withopen(file,'a+', newline='')as f:# f.write(codecs.BOM_UTF8)
                f_csv = csv.DictWriter(f,list(data[0].keys()))# f_csv.writeheader()
                f_csv.writerows(data)print("end to write to "+file)defread_csv(self,file):print("begin to read "+file)withopen(file,'r')as f:
            data = csv.DictReader(f)print("end to read "+file)returnlist(data)defget_provinces(self):
        province_file ='input/province.csv'ifnot os.path.exists(province_file):# 如果没有省份文件,开始爬取城市信息print("begin crawl province")
            provinces = self.parse_json('http://www.nmc.cn/f/rest/province')print("end crawl province")
            self.write_csv(province_file, provinces)else:
            provinces = self.read_csv(province_file)return provinces

    defget_cities(self):# 获取城市
        city_file ='input/city.csv'ifnot os.path.exists(city_file):# 如果没有城市文件,开始爬取城市信息
            cities =list()print("begin crawl city")for province in self.get_provinces():# 循环34个省份print(province['name'])
                url = province['url'].split('/')[-1].split('.')[0]
                cities.extend(self.parse_json('http://www.nmc.cn/f/rest/province/'+ url))
            self.write_csv(city_file, cities)print("end crawl city")else:
            cities = self.read_csv(city_file)return cities

    defget_passed_weather(self, province):
        weather_passed_file ='input/passed_weather_'+ province +'.csv'if os.path.exists(weather_passed_file):return
        passed_weather =list()
        count =0if province =='ALL':print("begin crawl passed weather")# 开始爬取历史天气for city in self.get_cities():print(city['province']+' '+ city['city']+' '+ city['code'])
                data = self.parse_json('http://www.nmc.cn/f/rest/passed/'+ city['code'])if data:
                    count = count +1for item in data:
                        item['city_code']= city['code']
                        item['province']= city['province']
                        item['city_name']= city['city']
                        item['city_index']=str(count)
                    passed_weather.extend(data)# time.sleep(random.random())
                time.sleep(0.8)if count %50==0:if count ==50:
                        self.write_header(weather_passed_file, passed_weather)else:
                        self.write_row(weather_passed_file, passed_weather)
                    passed_weather =list()if passed_weather:if count <=50:
                    self.write_header(weather_passed_file, passed_weather)else:
                    self.write_row(weather_passed_file, passed_weather)print("end crawl passed weather")else:print("begin crawl passed weather")
            select_city =[x for x in self.get_cities()if x['province']== province]for city in select_city:print(city['province']+' '+ city['city']+' '+ city['code'])
                data = self.parse_json('http://www.nmc.cn/f/rest/passed/'+ city['code'])if data:
                    count = count +1for item in data:
                        item['city_index']=str(count)
                        item['city_code']= city['code']
                        item['province']= city['province']
                        item['city_name']= city['city']
                    passed_weather.extend(data)# time.sleep(1)
            self.write_csv(weather_passed_file, passed_weather)print("end crawl passed weather")defrun(self,range='ALL'):
        self.get_passed_weather(range)defmain():
    crawler = Crawler()
    crawler.run("ALL")if __name__ =='__main__':
    main()
3.Spark分析代码:
# coding:utf-8from pyspark.sql import SparkSession
from pyspark.sql import functions as F
from pyspark.sql.types import DecimalType, TimestampType
import matplotlib as mpl
import matplotlib.pyplot as plt
from matplotlib.font_manager import FontProperties
import os
import math
from Crawler import*defpassed_rain_analyse(filename):# 计算各个城市过去24小时累积雨量print("begin to analyse passed rain")
    spark = SparkSession.builder.master("local").appName("passed_rain_analyse").getOrCreate()
    df = spark.read.csv(filename, header=True)
    df_rain = df.select(df['province'], df['city_name'], df['city_code'], df['rain1h'].cast(DecimalType(scale=1))) \
        .filter(df['rain1h']<1000)# 筛选数据,去除无效数据
    df_rain_sum = df_rain.groupBy("province","city_name","city_code") \
        .agg(F.sum("rain1h").alias("rain24h")) \
        .sort(F.desc("rain24h"))# 分组、求和、排序
    df_rain_sum.cache()
    df_rain_sum.coalesce(1).write.csv("file:///home/hadoop/PythonCode/SparkAnalysis/passed_rain_analyse.csv")print("end analysing passed rain")return df_rain_sum.head(20)defpassed_temperature_analyse(filename):print("begin to analyse passed temperature")
    spark = SparkSession.builder.master("local").appName("passed_temperature_analyse").getOrCreate()
    df = spark.read.csv(filename, header=True)
    df_temperature = df.select(# 选择需要的列
        df['province'],
        df['city_name'],
        df['city_code'],
        df['temperature'].cast(DecimalType(scale=1)),
        F.date_format(df['time'],"yyyy-MM-dd").alias("date"),# 得到日期数据
        F.hour(df['time']).alias("hour")# 得到小时数据)# 筛选四点时次
    df_4point_temperature = df_temperature.filter(df_temperature['hour'].isin([2,8,12,20]))# df_4point_temperature.printSchema()
    df_avg_temperature = df_4point_temperature.groupBy("province","city_name","city_code","date") \
        .agg(F.count("temperature"), F.avg("temperature").alias("avg_temperature")) \
        .filter("count(temperature) = 4") \
        .sort(F.asc("avg_temperature")) \
        .select("province","city_name","city_code","date",
                F.format_number('avg_temperature',1).alias("avg_temperature"))
    df_avg_temperature.cache()
    avg_temperature_list = df_avg_temperature.collect()
    df_avg_temperature.coalesce(1).write.json("file:///home/hadoop/PythonCode/SparkAnalysis/passed_temperature_analyse.json")print("end analysing passed temperature")return avg_temperature_list[0:10]defpassed_humidity_analyse(filename):print("begin to analyse passed humidity")
    spark = SparkSession.builder.master("local").appName("passed_humidity_analyse").getOrCreate()
    df = spark.read.csv(filename, header=True)
    df_humidity = df.select(# 选择需要的列
        df['province'],
        df['city_name'],
        df['city_code'],
        df['humidity'].cast(DecimalType(scale=1)),
        F.date_format(df['time'],"yyyy-MM-dd").alias("date"),# 得到日期数据
        F.hour(df['time']).alias("hour")# 得到小时数据)# 筛选四点时次
    df_4point_humidity = df_humidity.filter(df_humidity['hour'].isin([2,8,12,20]))# df_4point_humidity.printSchema()
    df_avg_humidity = df_4point_humidity.groupBy("province","city_name","city_code","date") \
        .agg(F.count("humidity"), F.avg("humidity").alias("avg_humidity")) \
        .filter("count(humidity) = 4") \
        .sort(F.asc("avg_humidity")) \
        .select("province","city_name","city_code","date",
                F.format_number('avg_humidity',1).alias("avg_humidity"))
    df_avg_humidity.cache()
    avg_humidity_list = df_avg_humidity.collect()
    df_avg_humidity.coalesce(1).write.json("file:///home/hadoop/PythonCode/SparkAnalysis/passed_humidity_analyse.json")print("end analysing passed analyse")return avg_humidity_list[0:10]defpassed_windSpeed_analyse(filename):print("begin to analyse passed windSpeed")
    spark = SparkSession.builder.master("local").appName("passed_windSpeed_analyse").getOrCreate()
    df = spark.read.csv(filename, header=True)
    df_windSpeed = df.select(# 选择需要的列
        df['province'],
        df['city_name'],
        df['city_code'],
        df['windSpeed'].cast(DecimalType(scale=1)),
        F.date_format(df['time'],"yyyy-MM-dd").alias("date"),# 得到日期数据
        F.hour(df['time']).alias("hour")# 得到小时数据)# 筛选四点时次
    df_4point_windSpeed = df_windSpeed.filter(df_windSpeed['hour'].isin([2,8,12,20]))# df_4point_windSpeed.printSchema()
    df_avg_windSpeed = df_4point_windSpeed.groupBy("province","city_name","city_code","date") \
        .agg(F.count("windSpeed"), F.avg("windSpeed").alias("avg_windSpeed")) \
        .filter("count(windSpeed) = 4") \
        .sort(F.asc("avg_windSpeed")) \
        .select("province","city_name","city_code","date",
                F.format_number('avg_windSpeed',1).alias("avg_windSpeed"))
    df_avg_windSpeed.cache()
    avg_windSpeed_list = df_avg_windSpeed.collect()
    df_avg_windSpeed.coalesce(1).write.json("file:///home/hadoop/PythonCode/SparkAnalysis/passed_windSpeed_analyse.json")print("end analysing passed windSpeed")return avg_windSpeed_list[0:10]defdraw_rain(rain_list):print("begin to draw the picture of passed rain")
    font = FontProperties(fname='ttf/simhei.ttf')# 设置字体
    name_list =[]
    num_list =[]for item in rain_list:
        name_list.append(item.province[0:2]+'\n'+ item.city_name)
        num_list.append(item.rain24h)
    index =[i +0.25for i inrange(0,len(num_list))]
    rects = plt.bar(index, num_list, color=['r','g','b','y'], width=0.5)
    plt.xticks([i +0.25for i in index], name_list, fontproperties=font,fontsize=20)
    plt.yticks(fontsize=20)
    plt.ylim(ymax=(int(max(num_list)+10)/100)*100, ymin=0)
    plt.xlabel("城市", fontproperties=font,fontsize=20)
    plt.ylabel("雨量", fontproperties=font,fontsize=20)
    plt.title("过去24小时累计降雨量全国前20名", fontproperties=font,fontsize=20)for rect in rects:
        height = rect.get_height()
        plt.text(rect.get_x()+ rect.get_width()/2, height +1,str(height), ha="center", va="bottom",fontsize=20)
    plt.show()print("ending drawing the picture of passed rain")defdraw_temperature(temperature_list):print("begin to draw the picture of passed temperature")
    font = FontProperties(fname='ttf/simhei.ttf')
    name_list =[]
    num_list =[]
    date = temperature_list[0].date
    for item in temperature_list:
        name_list.append(item.province[0:2]+'\n'+ item.city_name)# item.avg_temperature = item.avg_temperature.replace(',', '')
        num_list.append(float(item.avg_temperature))# num_list.append([float(x) for x in item.avg_temperature])
    index =[i +0.25for i inrange(0,len(num_list))]
    rects = plt.bar(index, num_list, color=['r','g','b','y'], width=0.5)
    plt.xticks([i +0.25for i in index], name_list, fontproperties=font,fontsize=20)
    plt.yticks(fontsize=20)
    plt.ylim(ymax=math.ceil(float(max(num_list)))-10, ymin=0)
    plt.xlabel("城市", fontproperties=font,fontsize=20)
    plt.ylabel("日平均气温", fontproperties=font,fontsize=20)
    plt.title(date +"全国日平均气温最低前10名", fontproperties=font,fontsize=20)for rect in rects:
        height = rect.get_height()
        plt.text(rect.get_x()+ rect.get_width()/2, height +0.1,str(height), ha="center", va="bottom",fontsize=20)
    plt.show()print("ending drawing the picture of passed temperature")defdraw_humidity(humidity_list):print("begin to draw the picture of passed humidity")
    font = FontProperties(fname='ttf/simhei.ttf')
    name_list =[]
    num_list =[]
    date = humidity_list[0].date
    for item in humidity_list:
        name_list.append(item.province[0:2]+'\n'+ item.city_name)
        num_list.append(float(item.avg_humidity))
    index =[i +0.25for i inrange(0,len(num_list))]
    rects = plt.bar(index, num_list, color=['r','g','b','y'], width=0.5)
    plt.xticks([i +0.25for i in index], name_list, fontproperties=font,fontsize=20)
    plt.yticks(fontsize=20)
    plt.ylim(ymax=math.ceil(float(max(num_list))), ymin=0)
    plt.xlabel("城市", fontproperties=font,fontsize=20)
    plt.ylabel("日平均湿度", fontproperties=font,fontsize=20)
    plt.title(date +"全国日平均湿度最低前10名", fontproperties=font,fontsize=20)for rect in rects:
        height = rect.get_height()
        plt.text(rect.get_x()+ rect.get_width()/2, height +0.1,str(height), ha="center", va="bottom", fontsize=20)
    plt.show()print("ending drawing the picture of passed humidity")defdraw_windSpeed(windSpeed_list):print("begin to draw the picture of passed windSpeed")
    font = FontProperties(fname='ttf/simhei.ttf')
    name_list =[]
    num_list =[]
    date = windSpeed_list[0].date
    for item in windSpeed_list:
        name_list.append(item.province[0:2]+'\n'+ item.city_name)
        num_list.append(float(item.avg_windSpeed))
    index =[i +0.25for i inrange(0,len(num_list))]
    rects = plt.bar(index, num_list, color=['r','g','b','y'], width=0.5)
    plt.xticks([i +0.25for i in index], name_list, fontproperties=font,fontsize=20)
    plt.yticks(fontsize=20)
    plt.ylim(ymax=math.ceil(float(max(num_list))), ymin=0)
    plt.xlabel("城市", fontproperties=font,fontsize=20)
    plt.ylabel("日平均风速", fontproperties=font,fontsize=20)
    plt.title(date +"全国日平均风速最低前10名", fontproperties=font, fontsize=20)for rect in rects:
        height = rect.get_height()
        plt.text(rect.get_x()+ rect.get_width()/2, height +0.1,str(height), ha="center", va="bottom", fontsize=20)
    plt.show()print("ending drawing the picture of passed windSpeed")defmain():
    sourcefile ="input/passed_weather_ALL.csv"ifnot os.path.exists(sourcefile):
        crawler = Crawler()
        crawler.run('ALL')# 过去24小时累计降雨量全国前20名
    rain_list = passed_rain_analyse('file:///home/hadoop/PythonCode/SparkAnalysis/'+ sourcefile)
    draw_rain(rain_list)# 全国日平均气温最低前10名
    temperature_list = passed_temperature_analyse('file:///home/hadoop/PythonCode/SparkAnalysis/'+ sourcefile)
    draw_temperature(temperature_list)# 全国日平均湿度最低前10名
    humidity_list = passed_humidity_analyse('file:///home/hadoop/PythonCode/SparkAnalysis/'+ sourcefile)
    draw_humidity(humidity_list)# 全国日平均风速最低前10名
    windSpeed_list = passed_windSpeed_analyse('file:///home/hadoop/PythonCode/SparkAnalysis/'+ sourcefile)
    draw_windSpeed(windSpeed_list)if __name__ =='__main__':
    main()
版权归原作者 ~柠月如风~ 所有, 如有侵权,请联系我们删除。